Analysis of Safety Culture in MDPC: Data Analysis and Findings
VerifiedAdded on 2023/04/19
|25
|5362
|243
Report
AI Summary
This report presents a comprehensive data analysis of a safety culture survey conducted within the Malaysia Deepwater Production Contractor (MDPC) organization. The study aimed to identify effective methods for enhancing and cultivating a robust safety culture. The analysis, based on data from 136 respondents in 2018, employed both qualitative and quantitative methodologies. Qualitative analysis revealed insights into workforce demographics, with breakdowns by management, workforce, and non-reporting sectors. The analysis includes figures and tables illustrating employee and work sector statistics. Quantitative analysis involved descriptive statistics, including averages, medians, and standard deviations, and a correlation analysis to examine relationships between variables. The study explored hypotheses related to code of practice adherence, safety perception, safety awareness, and the influence of job occupation on safety awareness. The report includes a t-test for difference in means. Findings highlight areas for improvement in safety awareness and employee perception, particularly regarding training, communication, and accountability. The report also compares the perceptions of KIK and Shorebase workers across several measures. Overall, the report provides valuable insights into the safety culture within MDPC and identifies key areas for improvement, offering a data-driven basis for enhancing safety practices and employee awareness.
Chapter 4: Data Analysis
The study’s original aim was to measure and examine better and effective ways through
which to improve and nurture the safety culture in the Malaysia Deepwater Production
Contractor (MDPC) organization. Using data obtained from a survey conducted in KIKEH we
conducted both qualitative and quantitative analysis.
Qualitative analysis
The research involves 136 respondents from the Malaysia Deepwater Production
Contractor (MDPC) company conducted in 2018.
Qualitative Descriptive statistics
Workforce
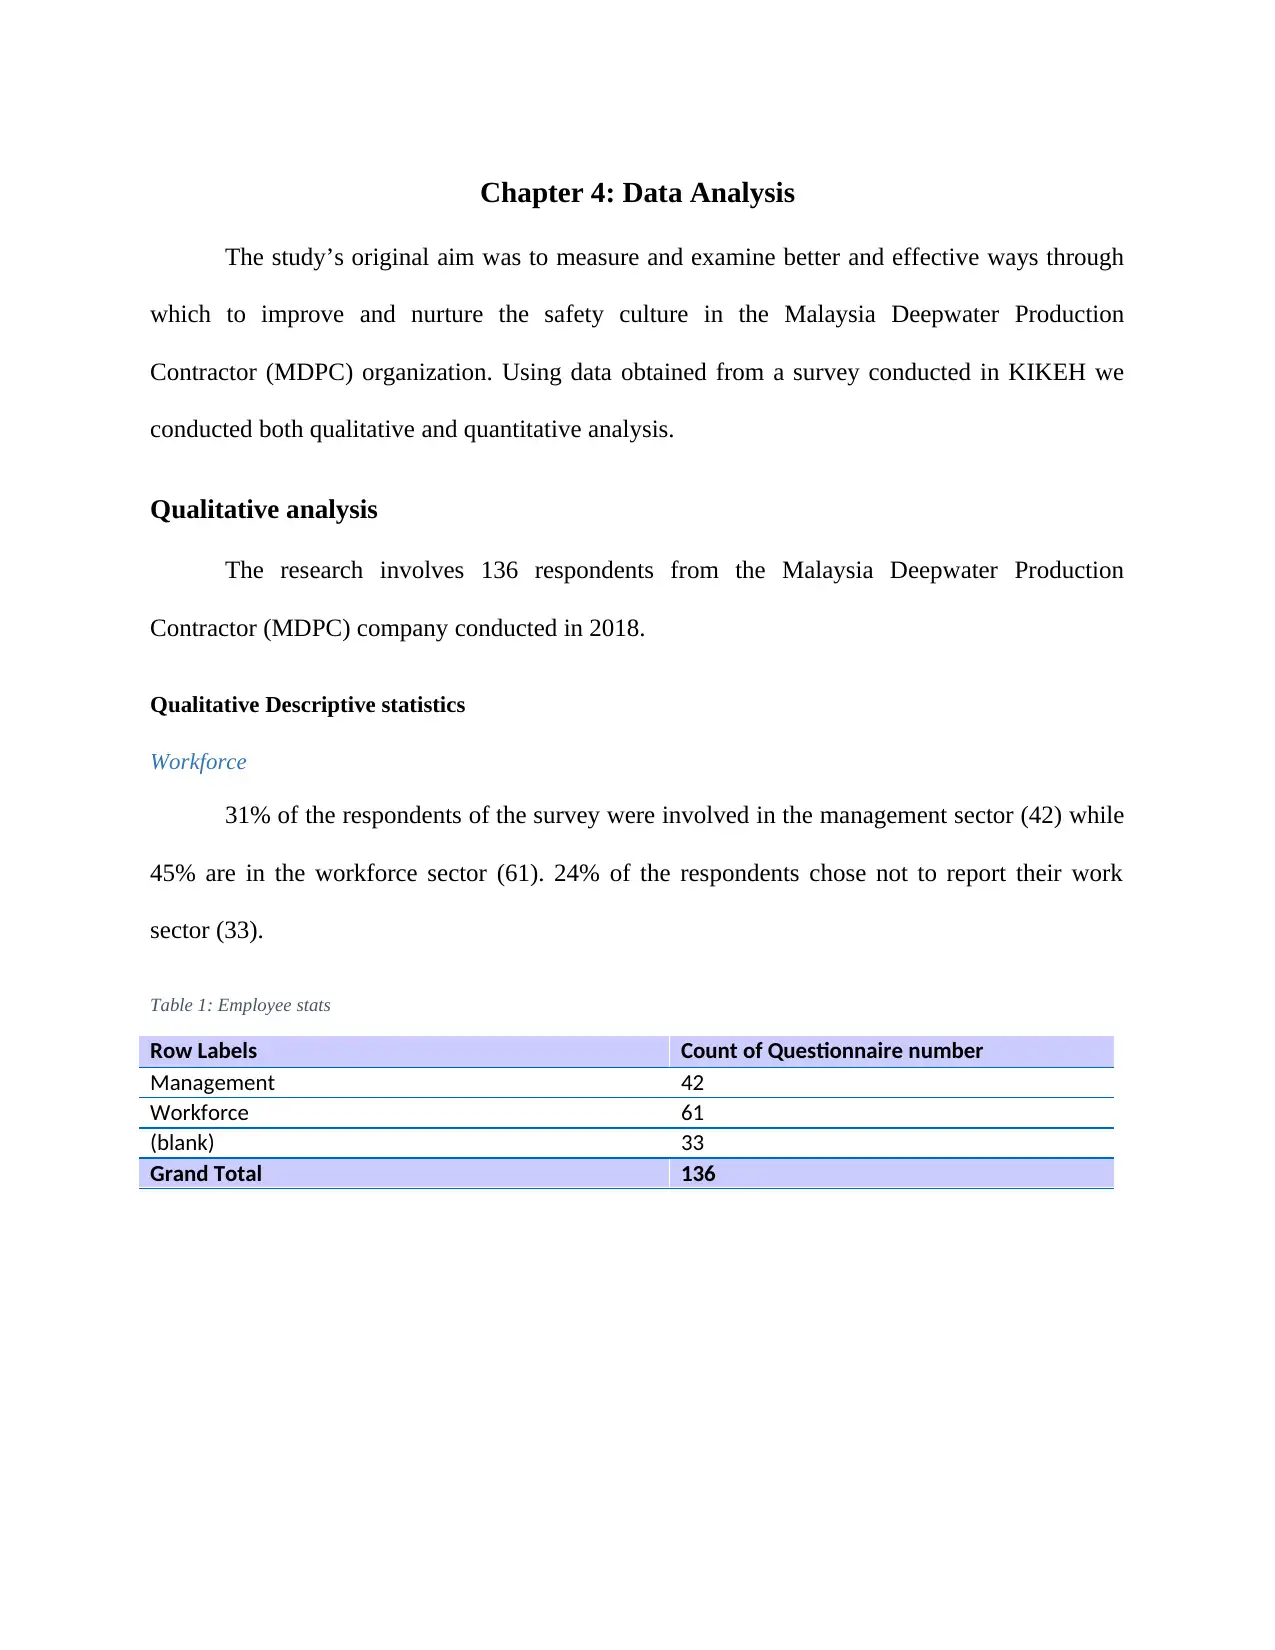
31% of the respondents of the survey were involved in the management sector (42) while
45% are in the workforce sector (61). 24% of the respondents chose not to report their work
sector (33).
Table 1: Employee stats
Row Labels Count of Questionnaire number
Management 42
Workforce 61
(blank) 33
Grand Total 136
The study’s original aim was to measure and examine better and effective ways through
which to improve and nurture the safety culture in the Malaysia Deepwater Production
Contractor (MDPC) organization. Using data obtained from a survey conducted in KIKEH we
conducted both qualitative and quantitative analysis.
Qualitative analysis
The research involves 136 respondents from the Malaysia Deepwater Production
Contractor (MDPC) company conducted in 2018.
Qualitative Descriptive statistics
Workforce
31% of the respondents of the survey were involved in the management sector (42) while
45% are in the workforce sector (61). 24% of the respondents chose not to report their work
sector (33).
Table 1: Employee stats
Row Labels Count of Questionnaire number
Management 42
Workforce 61
(blank) 33
Grand Total 136
Paraphrase This Document
Need a fresh take? Get an instant paraphrase of this document with our AI Paraphraser
Management
31%
Workforce
45%
(blank)
24%
Management
Workforce
(blank)
Figure 1: Graph for employee stats
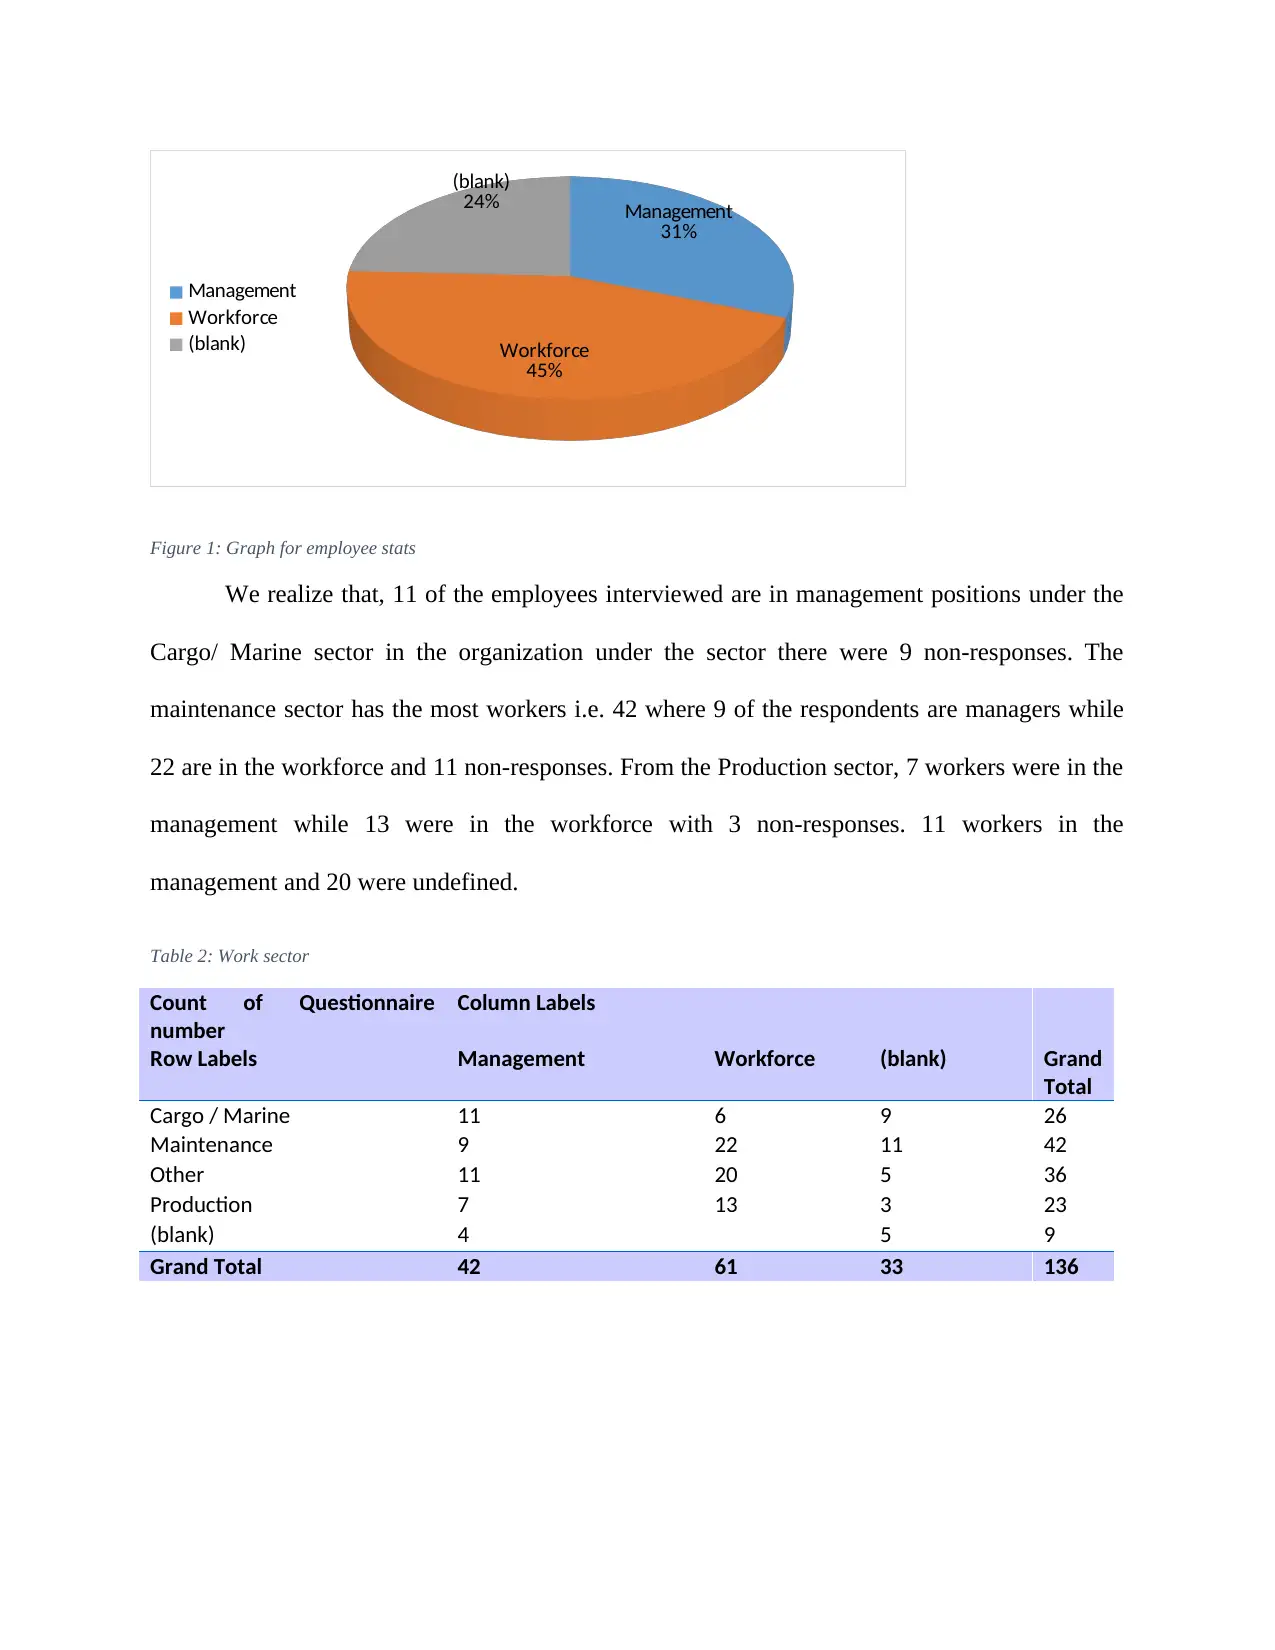
We realize that, 11 of the employees interviewed are in management positions under the
Cargo/ Marine sector in the organization under the sector there were 9 non-responses. The
maintenance sector has the most workers i.e. 42 where 9 of the respondents are managers while
22 are in the workforce and 11 non-responses. From the Production sector, 7 workers were in the
management while 13 were in the workforce with 3 non-responses. 11 workers in the
management and 20 were undefined.
Table 2: Work sector
Count of Questionnaire
number
Column Labels
Row Labels Management Workforce (blank) Grand
Total
Cargo / Marine 11 6 9 26
Maintenance 9 22 11 42
Other 11 20 5 36
Production 7 13 3 23
(blank) 4 5 9
Grand Total 42 61 33 136
31%
Workforce
45%
(blank)
24%
Management
Workforce
(blank)
Figure 1: Graph for employee stats
We realize that, 11 of the employees interviewed are in management positions under the
Cargo/ Marine sector in the organization under the sector there were 9 non-responses. The
maintenance sector has the most workers i.e. 42 where 9 of the respondents are managers while
22 are in the workforce and 11 non-responses. From the Production sector, 7 workers were in the
management while 13 were in the workforce with 3 non-responses. 11 workers in the
management and 20 were undefined.
Table 2: Work sector
Count of Questionnaire
number
Column Labels
Row Labels Management Workforce (blank) Grand
Total
Cargo / Marine 11 6 9 26
Maintenance 9 22 11 42
Other 11 20 5 36
Production 7 13 3 23
(blank) 4 5 9
Grand Total 42 61 33 136
Cargo / Marine Maintenance Other Production (blank)
0
5
10
15
20
25
Management
Workforce
(blank)
Figure 2
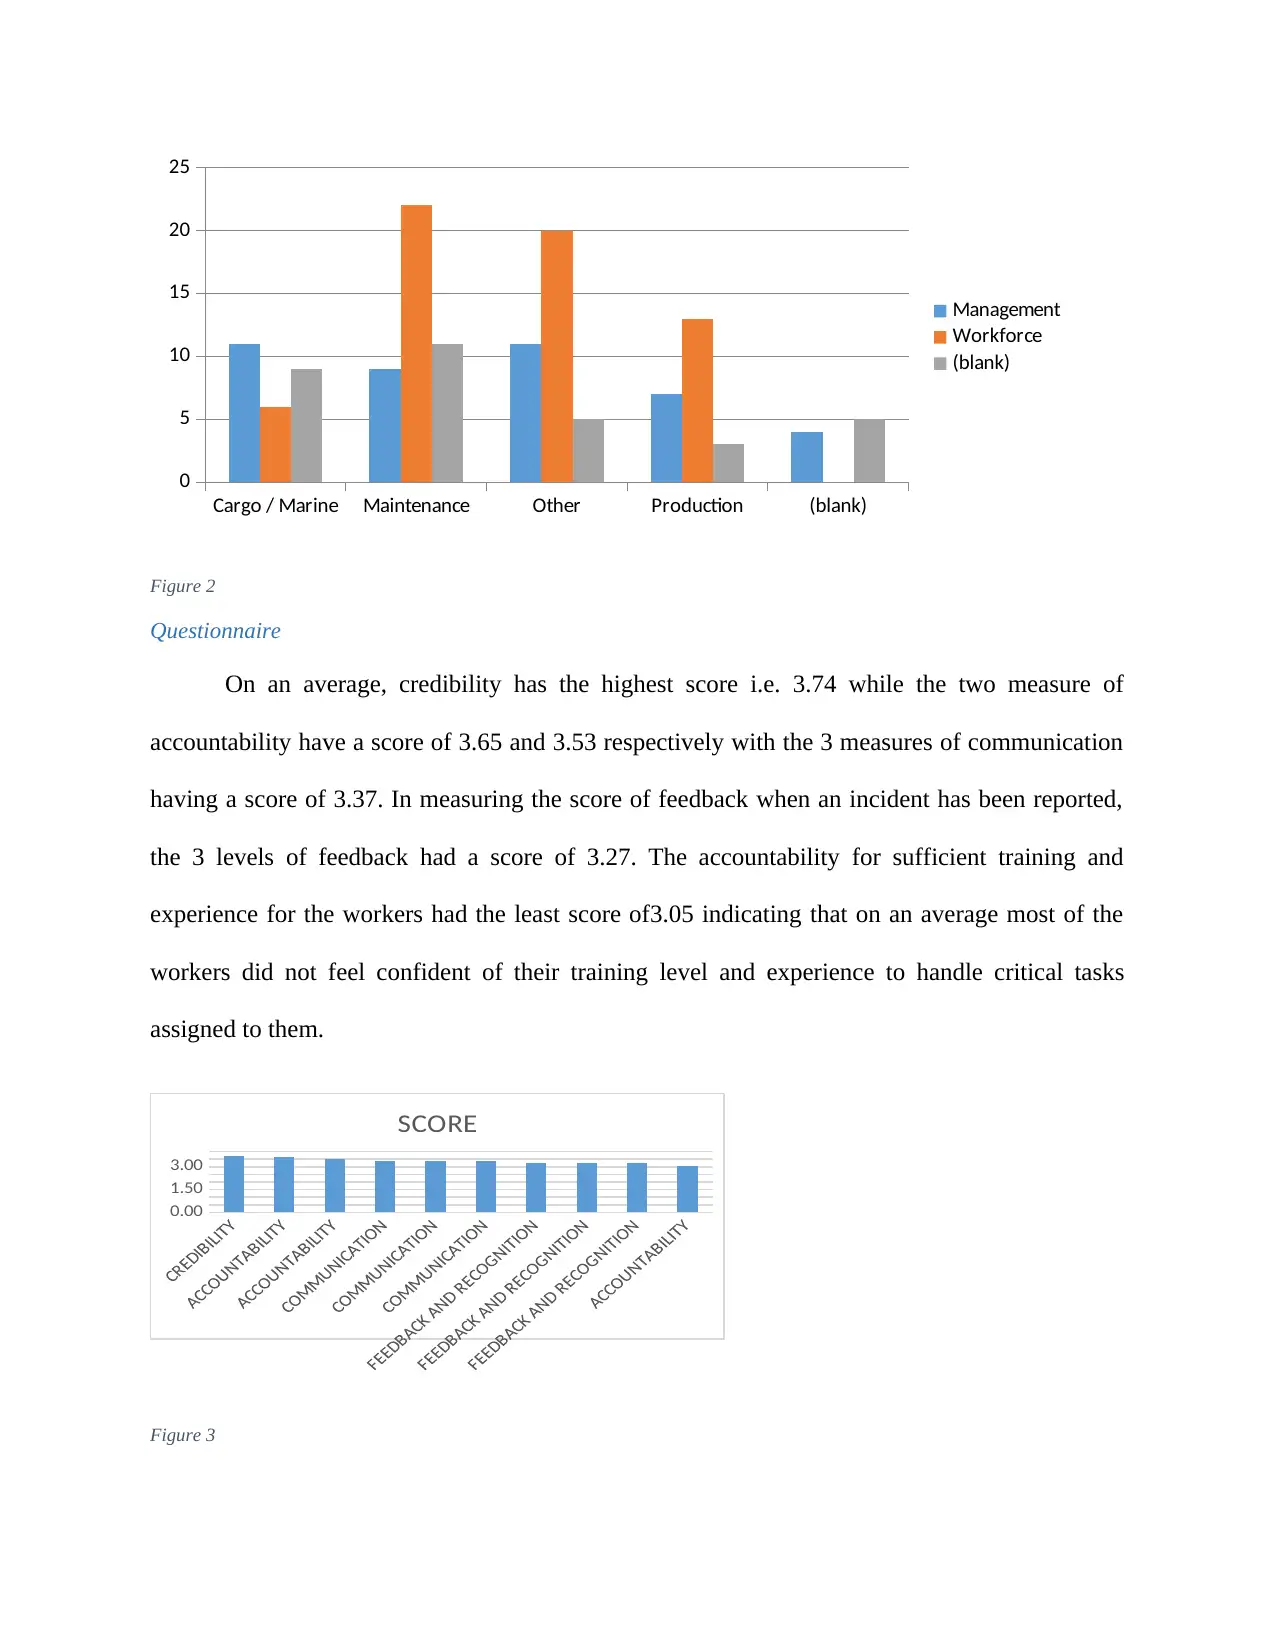
Questionnaire
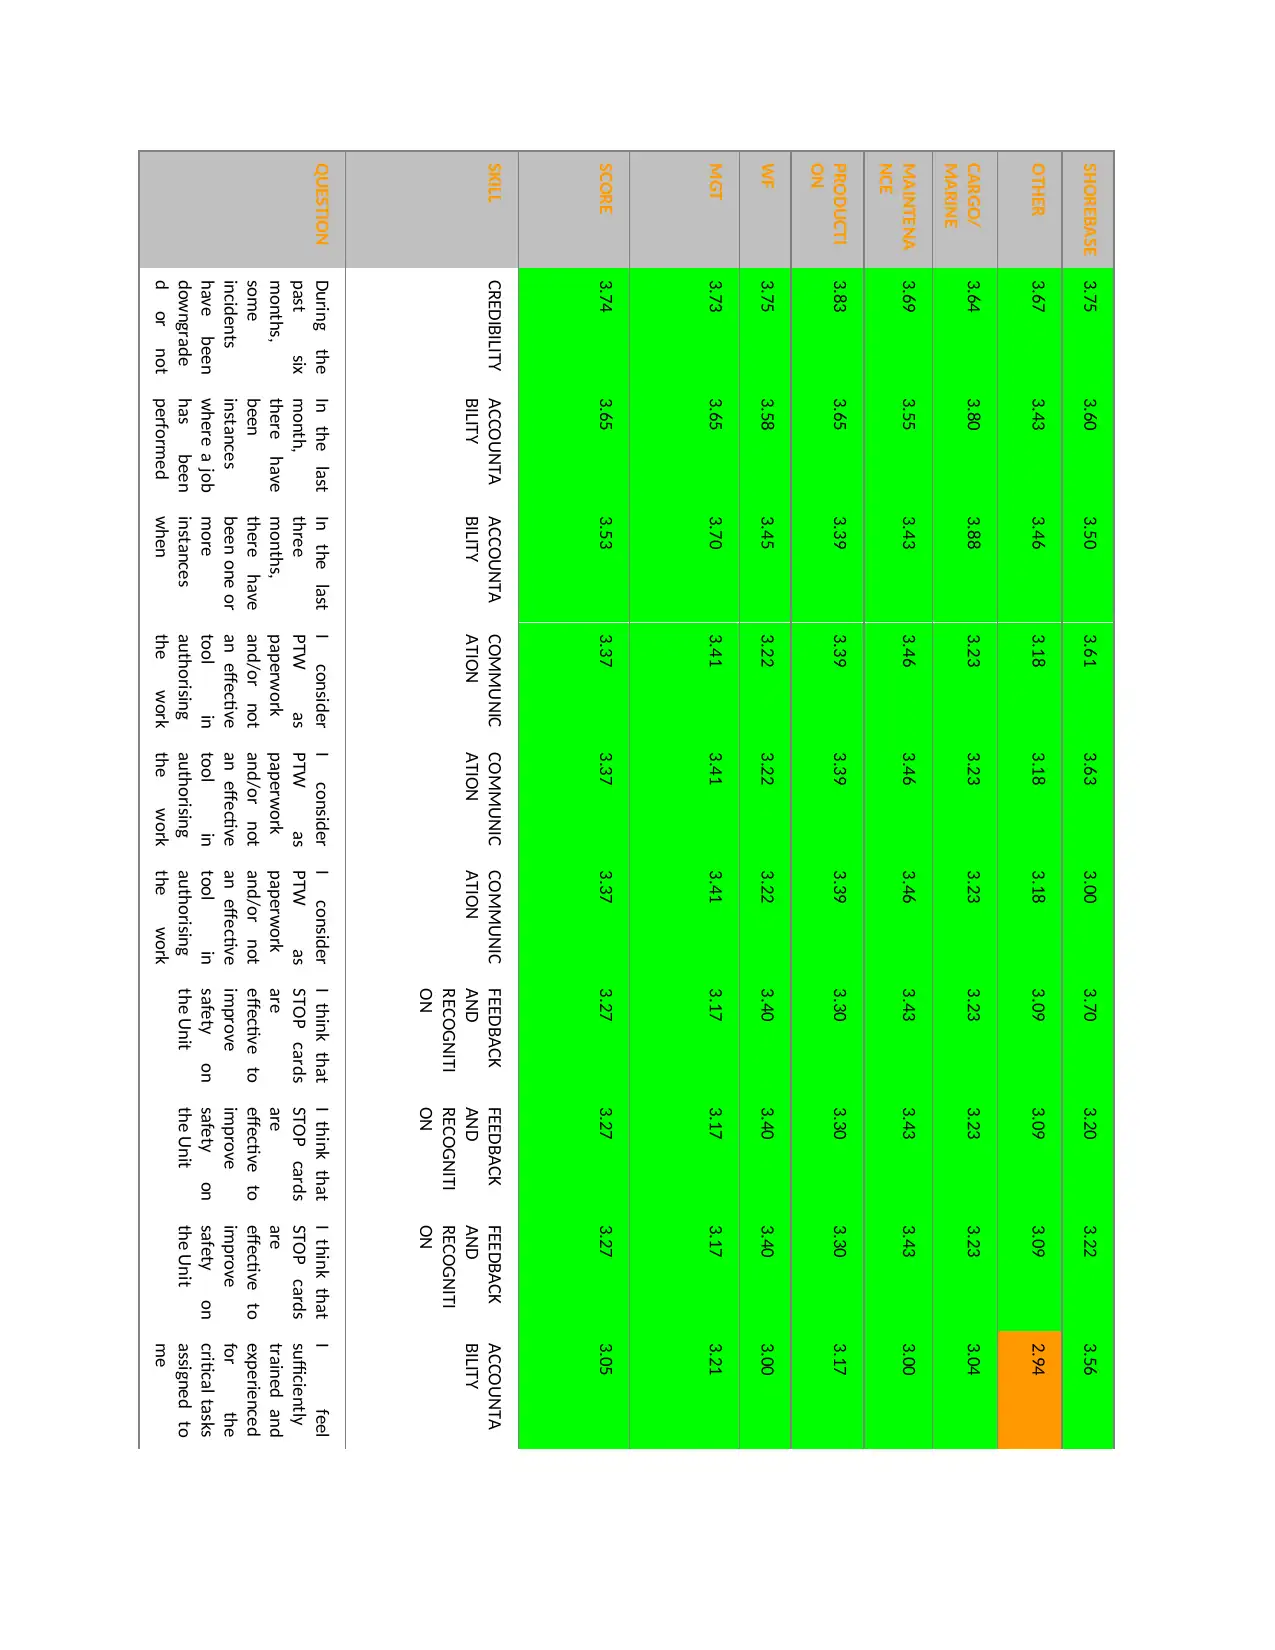
On an average, credibility has the highest score i.e. 3.74 while the two measure of
accountability have a score of 3.65 and 3.53 respectively with the 3 measures of communication
having a score of 3.37. In measuring the score of feedback when an incident has been reported,
the 3 levels of feedback had a score of 3.27. The accountability for sufficient training and
experience for the workers had the least score of3.05 indicating that on an average most of the
workers did not feel confident of their training level and experience to handle critical tasks
assigned to them.
0.00
1.50
3.00
SCORE
Figure 3
0
5
10
15
20
25
Management
Workforce
(blank)
Figure 2
Questionnaire
On an average, credibility has the highest score i.e. 3.74 while the two measure of
accountability have a score of 3.65 and 3.53 respectively with the 3 measures of communication
having a score of 3.37. In measuring the score of feedback when an incident has been reported,
the 3 levels of feedback had a score of 3.27. The accountability for sufficient training and
experience for the workers had the least score of3.05 indicating that on an average most of the
workers did not feel confident of their training level and experience to handle critical tasks
assigned to them.
0.00
1.50
3.00
SCORE
Figure 3
⊘ This is a preview!⊘
Do you want full access?
Subscribe today to unlock all pages.
Trusted by 1+ million students worldwide
QUESTION
SKILL
SCORE
MGT
WF
PRODUCTI
ON
MAINTENA
NCE
CARGO/
MARINE
OTHER
SHOREBASE
During the
past six
months,
some
incidents
have been
downgrade
d or not
reported
CREDIBILITY
3.74
3.73
3.75
3.83
3.69
3.64
3.67
3.75
In the last
month,
there have
been
instances
where a job
has been
performed
by new
ACCOUNTA
BILITY
3.65
3.65
3.58
3.65
3.55
3.80
3.43
3.60
In the last
three
months,
there have
been one or
more
instances
when
someone
ACCOUNTA
BILITY
3.53
3.70
3.45
3.39
3.43
3.88
3.46
3.50
I consider
PTW as
paperwork
and/or not
an effective
tool in
authorising
the work
and
COMMUNIC
ATION
3.37
3.41
3.22
3.39
3.46
3.23
3.18
3.61
I consider
PTW as
paperwork
and/or not
an effective
tool in
authorising
the work
and
COMMUNIC
ATION
3.37
3.41
3.22
3.39
3.46
3.23
3.18
3.63
I consider
PTW as
paperwork
and/or not
an effective
tool in
authorising
the work
and
COMMUNIC
ATION
3.37
3.41
3.22
3.39
3.46
3.23
3.18
3.00
I think that
STOP cards
are
effective to
improve
safety on
the Unit
FEEDBACK
AND
RECOGNITI
ON
3.27
3.17
3.40
3.30
3.43
3.23
3.09
3.70
I think that
STOP cards
are
effective to
improve
safety on
the Unit
FEEDBACK
AND
RECOGNITI
ON
3.27
3.17
3.40
3.30
3.43
3.23
3.09
3.20
I think that
STOP cards
are
effective to
improve
safety on
the Unit
FEEDBACK
AND
RECOGNITI
ON
3.27
3.17
3.40
3.30
3.43
3.23
3.09
3.22
I feel
sufficiently
trained and
experienced
for the
critical tasks
assigned to
me
ACCOUNTA
BILITY
3.05
3.21
3.00
3.17
3.00
3.04
2.94
3.56
Paraphrase This Document
Need a fresh take? Get an instant paraphrase of this document with our AI Paraphraser
CREDIBILITY
ACCOUNTABILITY
ACCOUNTABILITY
COMMUNICATION
COMMUNICATION
COMMUNICATION
FEEDBACK AND RECOGNITION
FEEDBACK AND RECOGNITION
FEEDBACK AND RECOGNITION
ACCOUNTABILITY
2.80
3.00
3.20
3.40
3.60
3.80
MGT
CREDIBILITY
ACCOUNTABILITY
ACCOUNTABILITY
COMMUNICATION
COMMUNICATION
COMMUNICATION
FEEDBACK AND RECOGNITION
FEEDBACK AND RECOGNITION
FEEDBACK AND RECOGNITION
ACCOUNTABILITY
0.00
1.00
2.00
3.00
4.00
WF
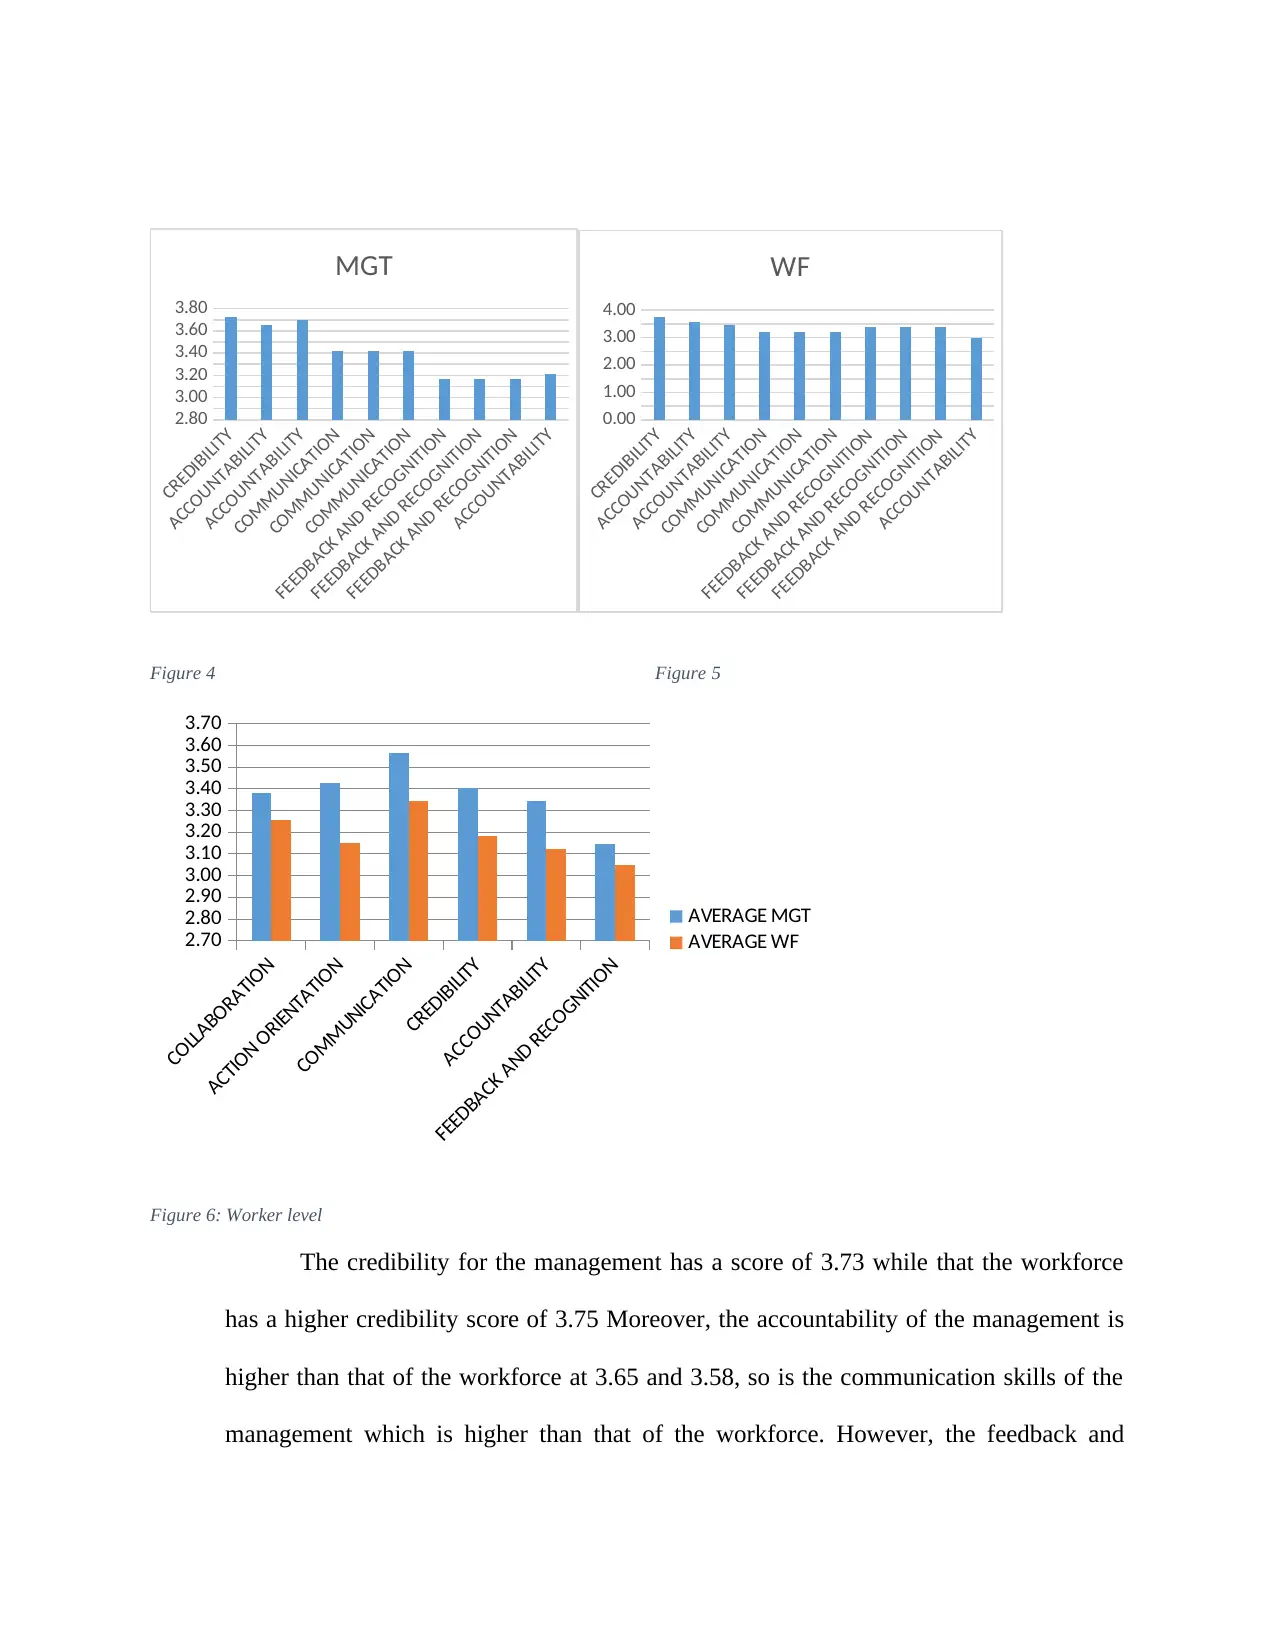
Figure 4 Figure 5
COLLABORATION
ACTION ORIENTATION
COMMUNICATION
CREDIBILITY
ACCOUNTABILITY
FEEDBACK AND RECOGNITION
2.70
2.80
2.90
3.00
3.10
3.20
3.30
3.40
3.50
3.60
3.70
AVERAGE MGT
AVERAGE WF
Figure 6: Worker level
The credibility for the management has a score of 3.73 while that the workforce
has a higher credibility score of 3.75 Moreover, the accountability of the management is
higher than that of the workforce at 3.65 and 3.58, so is the communication skills of the
management which is higher than that of the workforce. However, the feedback and
ACCOUNTABILITY
ACCOUNTABILITY
COMMUNICATION
COMMUNICATION
COMMUNICATION
FEEDBACK AND RECOGNITION
FEEDBACK AND RECOGNITION
FEEDBACK AND RECOGNITION
ACCOUNTABILITY
2.80
3.00
3.20
3.40
3.60
3.80
MGT
CREDIBILITY
ACCOUNTABILITY
ACCOUNTABILITY
COMMUNICATION
COMMUNICATION
COMMUNICATION
FEEDBACK AND RECOGNITION
FEEDBACK AND RECOGNITION
FEEDBACK AND RECOGNITION
ACCOUNTABILITY
0.00
1.00
2.00
3.00
4.00
WF
Figure 4 Figure 5
COLLABORATION
ACTION ORIENTATION
COMMUNICATION
CREDIBILITY
ACCOUNTABILITY
FEEDBACK AND RECOGNITION
2.70
2.80
2.90
3.00
3.10
3.20
3.30
3.40
3.50
3.60
3.70
AVERAGE MGT
AVERAGE WF
Figure 6: Worker level
The credibility for the management has a score of 3.73 while that the workforce
has a higher credibility score of 3.75 Moreover, the accountability of the management is
higher than that of the workforce at 3.65 and 3.58, so is the communication skills of the
management which is higher than that of the workforce. However, the feedback and
recognition of the management is lower (3.17) while that of the workforce is higher
(3.40).
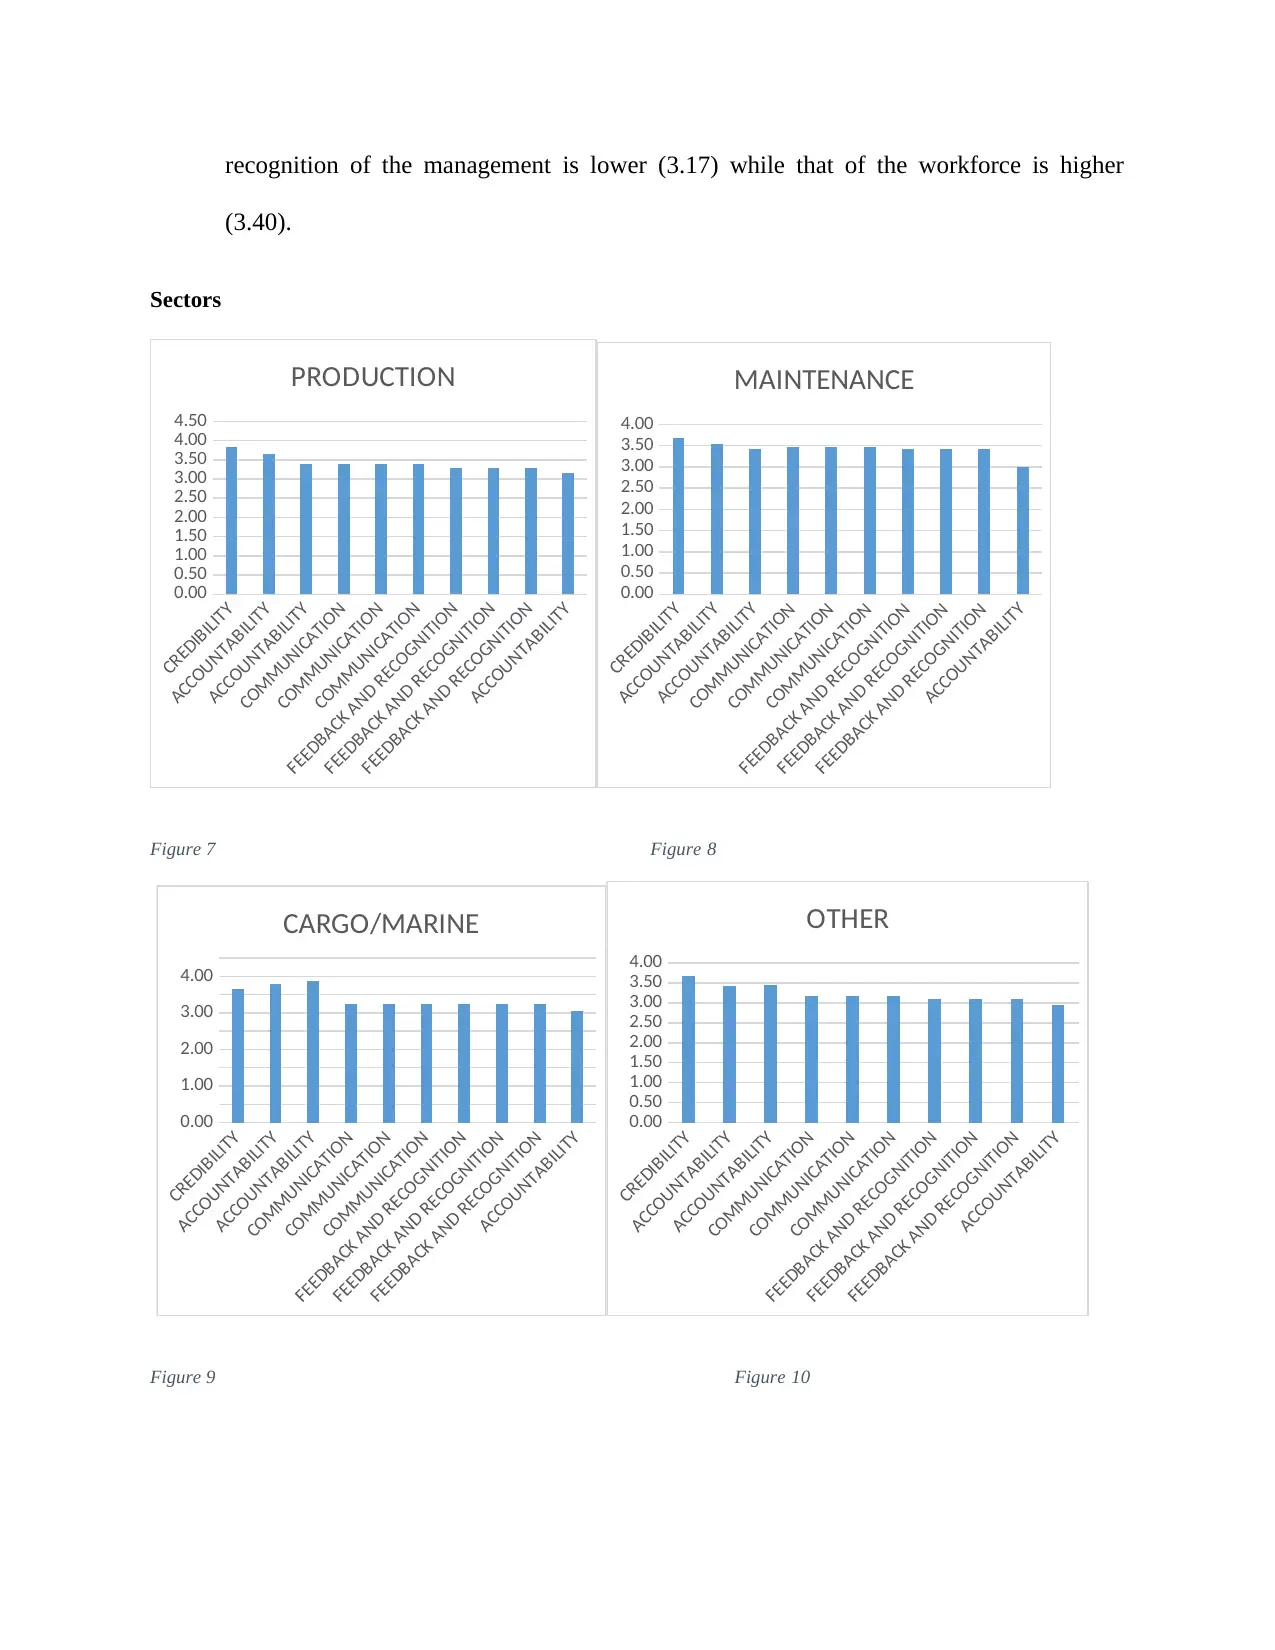
Sectors
CREDIBILITY
ACCOUNTABILITY
ACCOUNTABILITY
COMMUNICATION
COMMUNICATION
COMMUNICATION
FEEDBACK AND RECOGNITION
FEEDBACK AND RECOGNITION
FEEDBACK AND RECOGNITION
ACCOUNTABILITY
0.00
0.50
1.00
1.50
2.00
2.50
3.00
3.50
4.00
4.50
PRODUCTION
CREDIBILITY
ACCOUNTABILITY
ACCOUNTABILITY
COMMUNICATION
COMMUNICATION
COMMUNICATION
FEEDBACK AND RECOGNITION
FEEDBACK AND RECOGNITION
FEEDBACK AND RECOGNITION
ACCOUNTABILITY
0.00
0.50
1.00
1.50
2.00
2.50
3.00
3.50
4.00
MAINTENANCE
Figure 7 Figure 8
CREDIBILITY
ACCOUNTABILITY
ACCOUNTABILITY
COMMUNICATION
COMMUNICATION
COMMUNICATION
FEEDBACK AND RECOGNITION
FEEDBACK AND RECOGNITION
FEEDBACK AND RECOGNITION
ACCOUNTABILITY
0.00
1.00
2.00
3.00
4.00
CARGO/MARINE
CREDIBILITY
ACCOUNTABILITY
ACCOUNTABILITY
COMMUNICATION
COMMUNICATION
COMMUNICATION
FEEDBACK AND RECOGNITION
FEEDBACK AND RECOGNITION
FEEDBACK AND RECOGNITION
ACCOUNTABILITY
0.00
0.50
1.00
1.50
2.00
2.50
3.00
3.50
4.00
OTHER
Figure 9 Figure 10
(3.40).
Sectors
CREDIBILITY
ACCOUNTABILITY
ACCOUNTABILITY
COMMUNICATION
COMMUNICATION
COMMUNICATION
FEEDBACK AND RECOGNITION
FEEDBACK AND RECOGNITION
FEEDBACK AND RECOGNITION
ACCOUNTABILITY
0.00
0.50
1.00
1.50
2.00
2.50
3.00
3.50
4.00
4.50
PRODUCTION
CREDIBILITY
ACCOUNTABILITY
ACCOUNTABILITY
COMMUNICATION
COMMUNICATION
COMMUNICATION
FEEDBACK AND RECOGNITION
FEEDBACK AND RECOGNITION
FEEDBACK AND RECOGNITION
ACCOUNTABILITY
0.00
0.50
1.00
1.50
2.00
2.50
3.00
3.50
4.00
MAINTENANCE
Figure 7 Figure 8
CREDIBILITY
ACCOUNTABILITY
ACCOUNTABILITY
COMMUNICATION
COMMUNICATION
COMMUNICATION
FEEDBACK AND RECOGNITION
FEEDBACK AND RECOGNITION
FEEDBACK AND RECOGNITION
ACCOUNTABILITY
0.00
1.00
2.00
3.00
4.00
CARGO/MARINE
CREDIBILITY
ACCOUNTABILITY
ACCOUNTABILITY
COMMUNICATION
COMMUNICATION
COMMUNICATION
FEEDBACK AND RECOGNITION
FEEDBACK AND RECOGNITION
FEEDBACK AND RECOGNITION
ACCOUNTABILITY
0.00
0.50
1.00
1.50
2.00
2.50
3.00
3.50
4.00
OTHER
Figure 9 Figure 10
⊘ This is a preview!⊘
Do you want full access?
Subscribe today to unlock all pages.
Trusted by 1+ million students worldwide
Workers in the production have the highest credibility (3.83) while those in the Marine
and Cargo sector have the highest accountability (3.80). In addition, workers in the maintenance
have the highest communication score of 3.46.
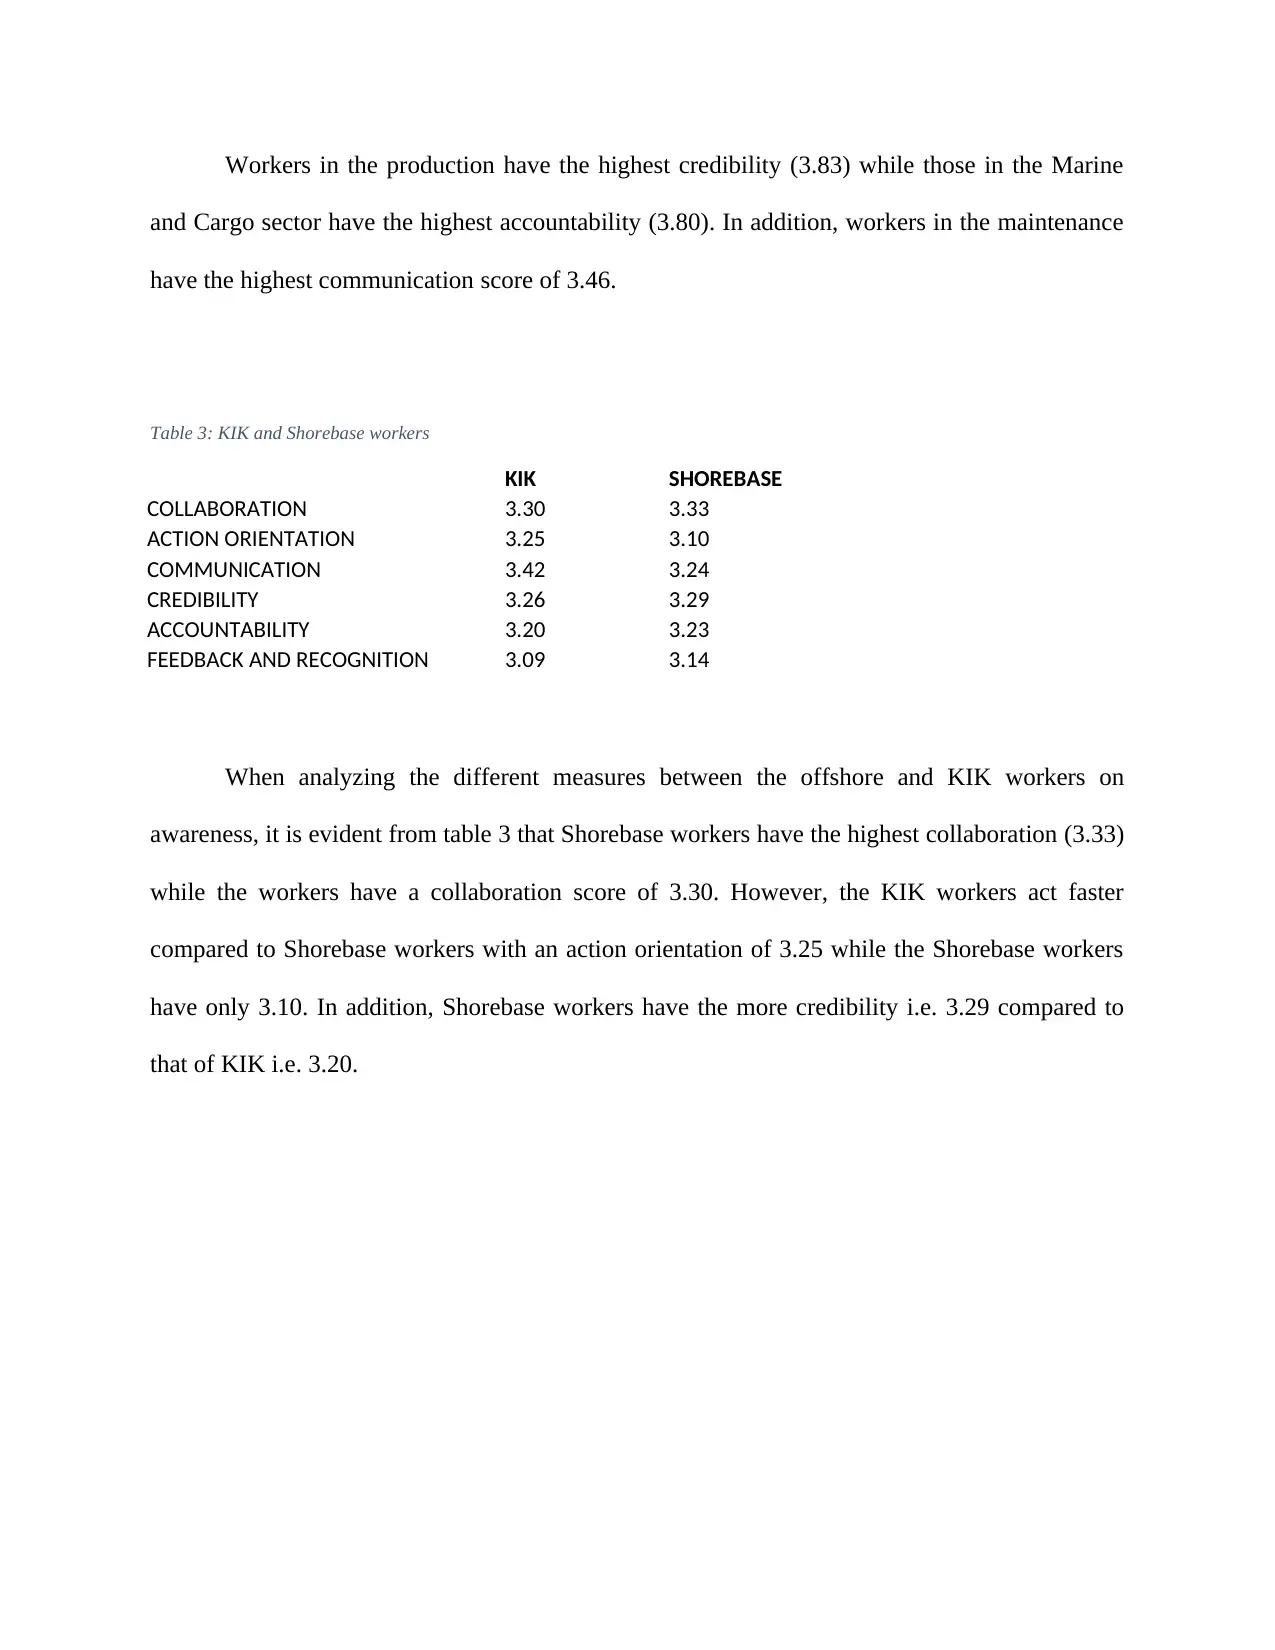
Table 3: KIK and Shorebase workers
KIK SHOREBASE
COLLABORATION 3.30 3.33
ACTION ORIENTATION 3.25 3.10
COMMUNICATION 3.42 3.24
CREDIBILITY 3.26 3.29
ACCOUNTABILITY 3.20 3.23
FEEDBACK AND RECOGNITION 3.09 3.14
When analyzing the different measures between the offshore and KIK workers on
awareness, it is evident from table 3 that Shorebase workers have the highest collaboration (3.33)
while the workers have a collaboration score of 3.30. However, the KIK workers act faster
compared to Shorebase workers with an action orientation of 3.25 while the Shorebase workers
have only 3.10. In addition, Shorebase workers have the more credibility i.e. 3.29 compared to
that of KIK i.e. 3.20.
and Cargo sector have the highest accountability (3.80). In addition, workers in the maintenance
have the highest communication score of 3.46.
Table 3: KIK and Shorebase workers
KIK SHOREBASE
COLLABORATION 3.30 3.33
ACTION ORIENTATION 3.25 3.10
COMMUNICATION 3.42 3.24
CREDIBILITY 3.26 3.29
ACCOUNTABILITY 3.20 3.23
FEEDBACK AND RECOGNITION 3.09 3.14
When analyzing the different measures between the offshore and KIK workers on
awareness, it is evident from table 3 that Shorebase workers have the highest collaboration (3.33)
while the workers have a collaboration score of 3.30. However, the KIK workers act faster
compared to Shorebase workers with an action orientation of 3.25 while the Shorebase workers
have only 3.10. In addition, Shorebase workers have the more credibility i.e. 3.29 compared to
that of KIK i.e. 3.20.
Paraphrase This Document
Need a fresh take? Get an instant paraphrase of this document with our AI Paraphraser
COLLABORATION
ACTION ORIENTATION
COMMUNICATION
CREDIBILITY
ACCOUNTABILITY
FEEDBACK AND RECOGNITION
2.90
3.10
3.30
3.50
KIK and Shorebase comparison
KIK SHOREBASE
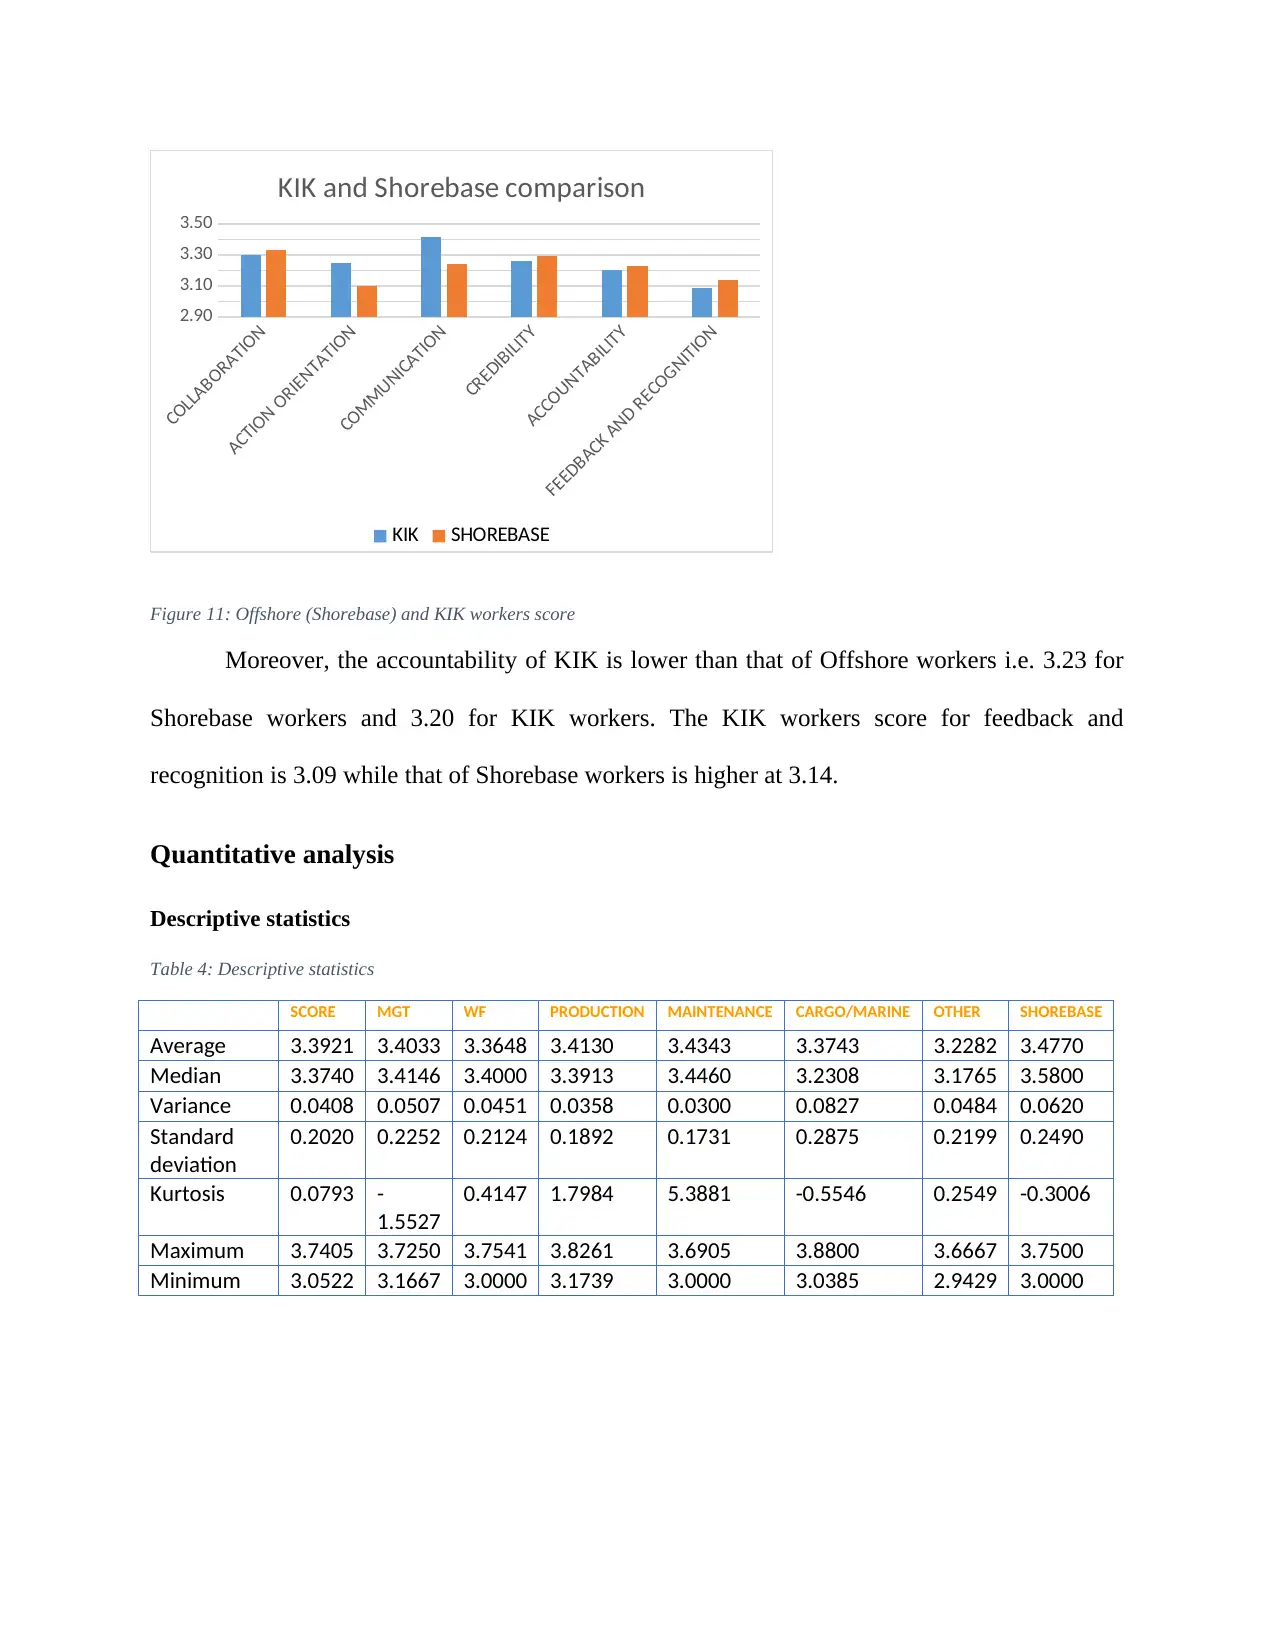
Figure 11: Offshore (Shorebase) and KIK workers score
Moreover, the accountability of KIK is lower than that of Offshore workers i.e. 3.23 for
Shorebase workers and 3.20 for KIK workers. The KIK workers score for feedback and
recognition is 3.09 while that of Shorebase workers is higher at 3.14.
Quantitative analysis
Descriptive statistics
Table 4: Descriptive statistics
SCORE MGT WF PRODUCTION MAINTENANCE CARGO/MARINE OTHER SHOREBASE
Average 3.3921 3.4033 3.3648 3.4130 3.4343 3.3743 3.2282 3.4770
Median 3.3740 3.4146 3.4000 3.3913 3.4460 3.2308 3.1765 3.5800
Variance 0.0408 0.0507 0.0451 0.0358 0.0300 0.0827 0.0484 0.0620
Standard
deviation
0.2020 0.2252 0.2124 0.1892 0.1731 0.2875 0.2199 0.2490
Kurtosis 0.0793 -
1.5527
0.4147 1.7984 5.3881 -0.5546 0.2549 -0.3006
Maximum 3.7405 3.7250 3.7541 3.8261 3.6905 3.8800 3.6667 3.7500
Minimum 3.0522 3.1667 3.0000 3.1739 3.0000 3.0385 2.9429 3.0000
ACTION ORIENTATION
COMMUNICATION
CREDIBILITY
ACCOUNTABILITY
FEEDBACK AND RECOGNITION
2.90
3.10
3.30
3.50
KIK and Shorebase comparison
KIK SHOREBASE
Figure 11: Offshore (Shorebase) and KIK workers score
Moreover, the accountability of KIK is lower than that of Offshore workers i.e. 3.23 for
Shorebase workers and 3.20 for KIK workers. The KIK workers score for feedback and
recognition is 3.09 while that of Shorebase workers is higher at 3.14.
Quantitative analysis
Descriptive statistics
Table 4: Descriptive statistics
SCORE MGT WF PRODUCTION MAINTENANCE CARGO/MARINE OTHER SHOREBASE
Average 3.3921 3.4033 3.3648 3.4130 3.4343 3.3743 3.2282 3.4770
Median 3.3740 3.4146 3.4000 3.3913 3.4460 3.2308 3.1765 3.5800
Variance 0.0408 0.0507 0.0451 0.0358 0.0300 0.0827 0.0484 0.0620
Standard
deviation
0.2020 0.2252 0.2124 0.1892 0.1731 0.2875 0.2199 0.2490
Kurtosis 0.0793 -
1.5527
0.4147 1.7984 5.3881 -0.5546 0.2549 -0.3006
Maximum 3.7405 3.7250 3.7541 3.8261 3.6905 3.8800 3.6667 3.7500
Minimum 3.0522 3.1667 3.0000 3.1739 3.0000 3.0385 2.9429 3.0000
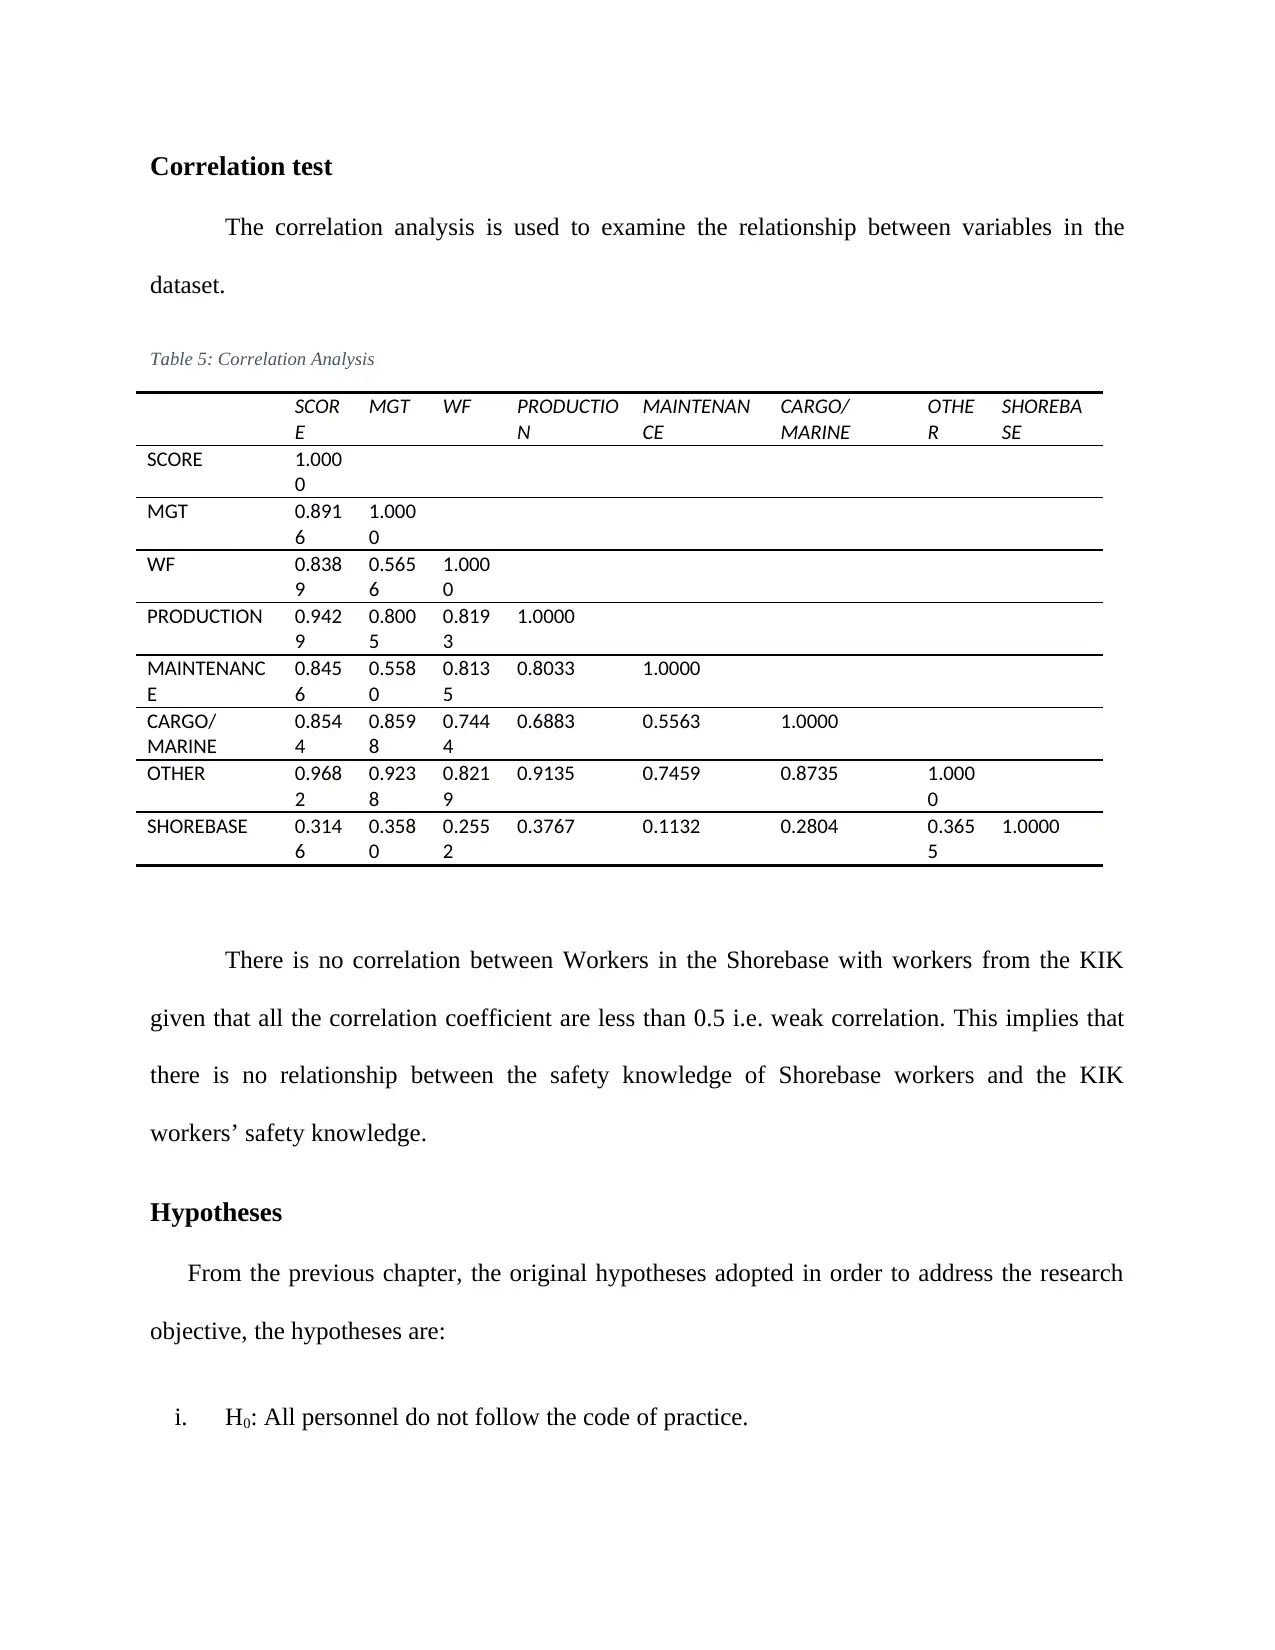
Correlation test
The correlation analysis is used to examine the relationship between variables in the
dataset.
Table 5: Correlation Analysis
SCOR
E
MGT WF PRODUCTIO
N
MAINTENAN
CE
CARGO/
MARINE
OTHE
R
SHOREBA
SE
SCORE 1.000
0
MGT 0.891
6
1.000
0
WF 0.838
9
0.565
6
1.000
0
PRODUCTION 0.942
9
0.800
5
0.819
3
1.0000
MAINTENANC
E
0.845
6
0.558
0
0.813
5
0.8033 1.0000
CARGO/
MARINE
0.854
4
0.859
8
0.744
4
0.6883 0.5563 1.0000
OTHER 0.968
2
0.923
8
0.821
9
0.9135 0.7459 0.8735 1.000
0
SHOREBASE 0.314
6
0.358
0
0.255
2
0.3767 0.1132 0.2804 0.365
5
1.0000
There is no correlation between Workers in the Shorebase with workers from the KIK
given that all the correlation coefficient are less than 0.5 i.e. weak correlation. This implies that
there is no relationship between the safety knowledge of Shorebase workers and the KIK
workers’ safety knowledge.
Hypotheses
From the previous chapter, the original hypotheses adopted in order to address the research
objective, the hypotheses are:
i. H0: All personnel do not follow the code of practice.
⊘ This is a preview!⊘
Do you want full access?
Subscribe today to unlock all pages.
Trusted by 1+ million students worldwide
H1: All personnel follow code of practice.
ii. H0: The perception of safety is unsatisfactory
H1: The perception of safety is satisfactory
iii. H0: Each personnel have diverse safety awareness and ownership
H1: All personnel have identical safety awareness and ownership
iv. H0: Shore bases do not promote safety awareness
H1: Shore bases promote safety awareness.
v. H0 Job occupation do not influence one’s safety awareness
H1 Job occupation do influence one’s safety awareness
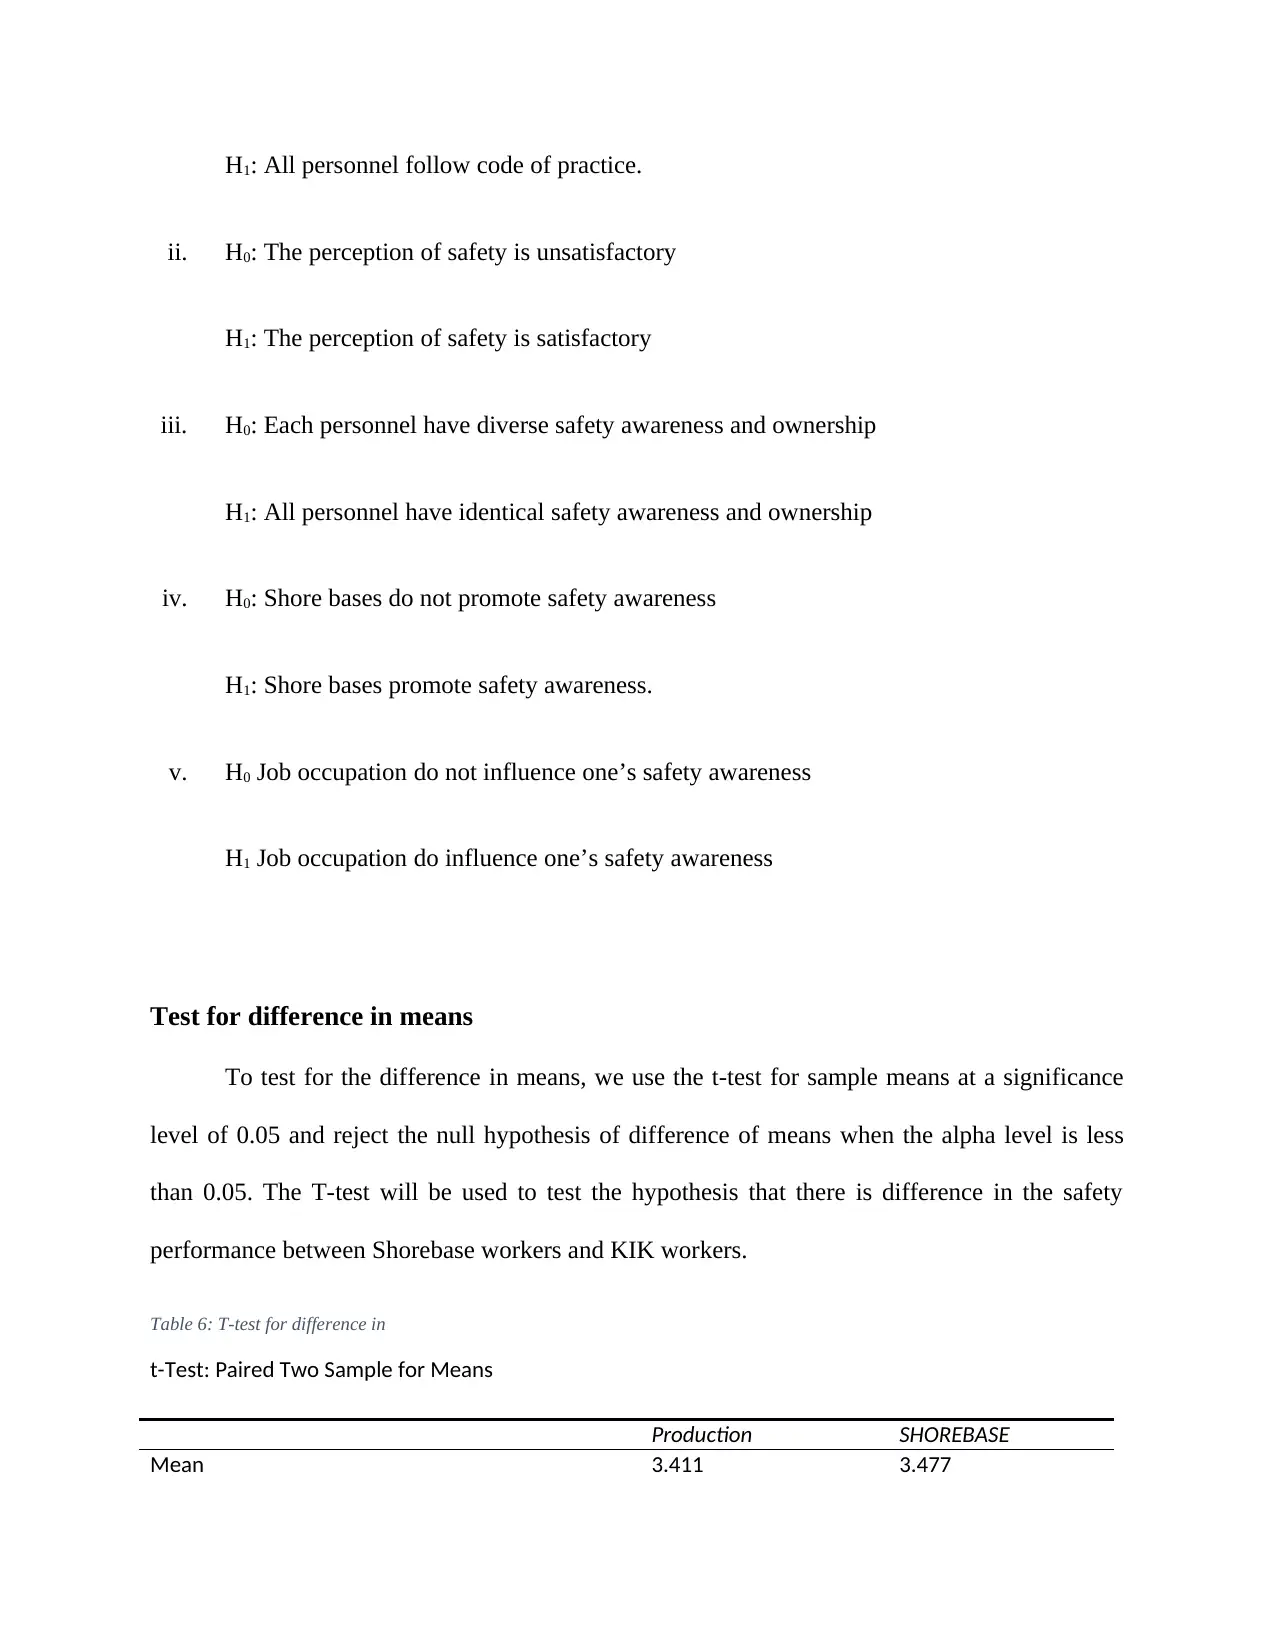
Test for difference in means
To test for the difference in means, we use the t-test for sample means at a significance
level of 0.05 and reject the null hypothesis of difference of means when the alpha level is less
than 0.05. The T-test will be used to test the hypothesis that there is difference in the safety
performance between Shorebase workers and KIK workers.
Table 6: T-test for difference in
t-Test: Paired Two Sample for Means
Production SHOREBASE
Mean 3.411 3.477
ii. H0: The perception of safety is unsatisfactory
H1: The perception of safety is satisfactory
iii. H0: Each personnel have diverse safety awareness and ownership
H1: All personnel have identical safety awareness and ownership
iv. H0: Shore bases do not promote safety awareness
H1: Shore bases promote safety awareness.
v. H0 Job occupation do not influence one’s safety awareness
H1 Job occupation do influence one’s safety awareness
Test for difference in means
To test for the difference in means, we use the t-test for sample means at a significance
level of 0.05 and reject the null hypothesis of difference of means when the alpha level is less
than 0.05. The T-test will be used to test the hypothesis that there is difference in the safety
performance between Shorebase workers and KIK workers.
Table 6: T-test for difference in
t-Test: Paired Two Sample for Means
Production SHOREBASE
Mean 3.411 3.477
Paraphrase This Document
Need a fresh take? Get an instant paraphrase of this document with our AI Paraphraser
Variance 0.03661 0.062023333
Observations 10 10
Pearson Correlation 0.377345442
Hypothesized Mean Difference 0
df 9
t Stat -0.833700839
P(T<=t) one-tail 0.213011012
t Critical one-tail 1.833112933
P(T<=t) two-tail 0.426022023
t Critical two-tail 2.262157163
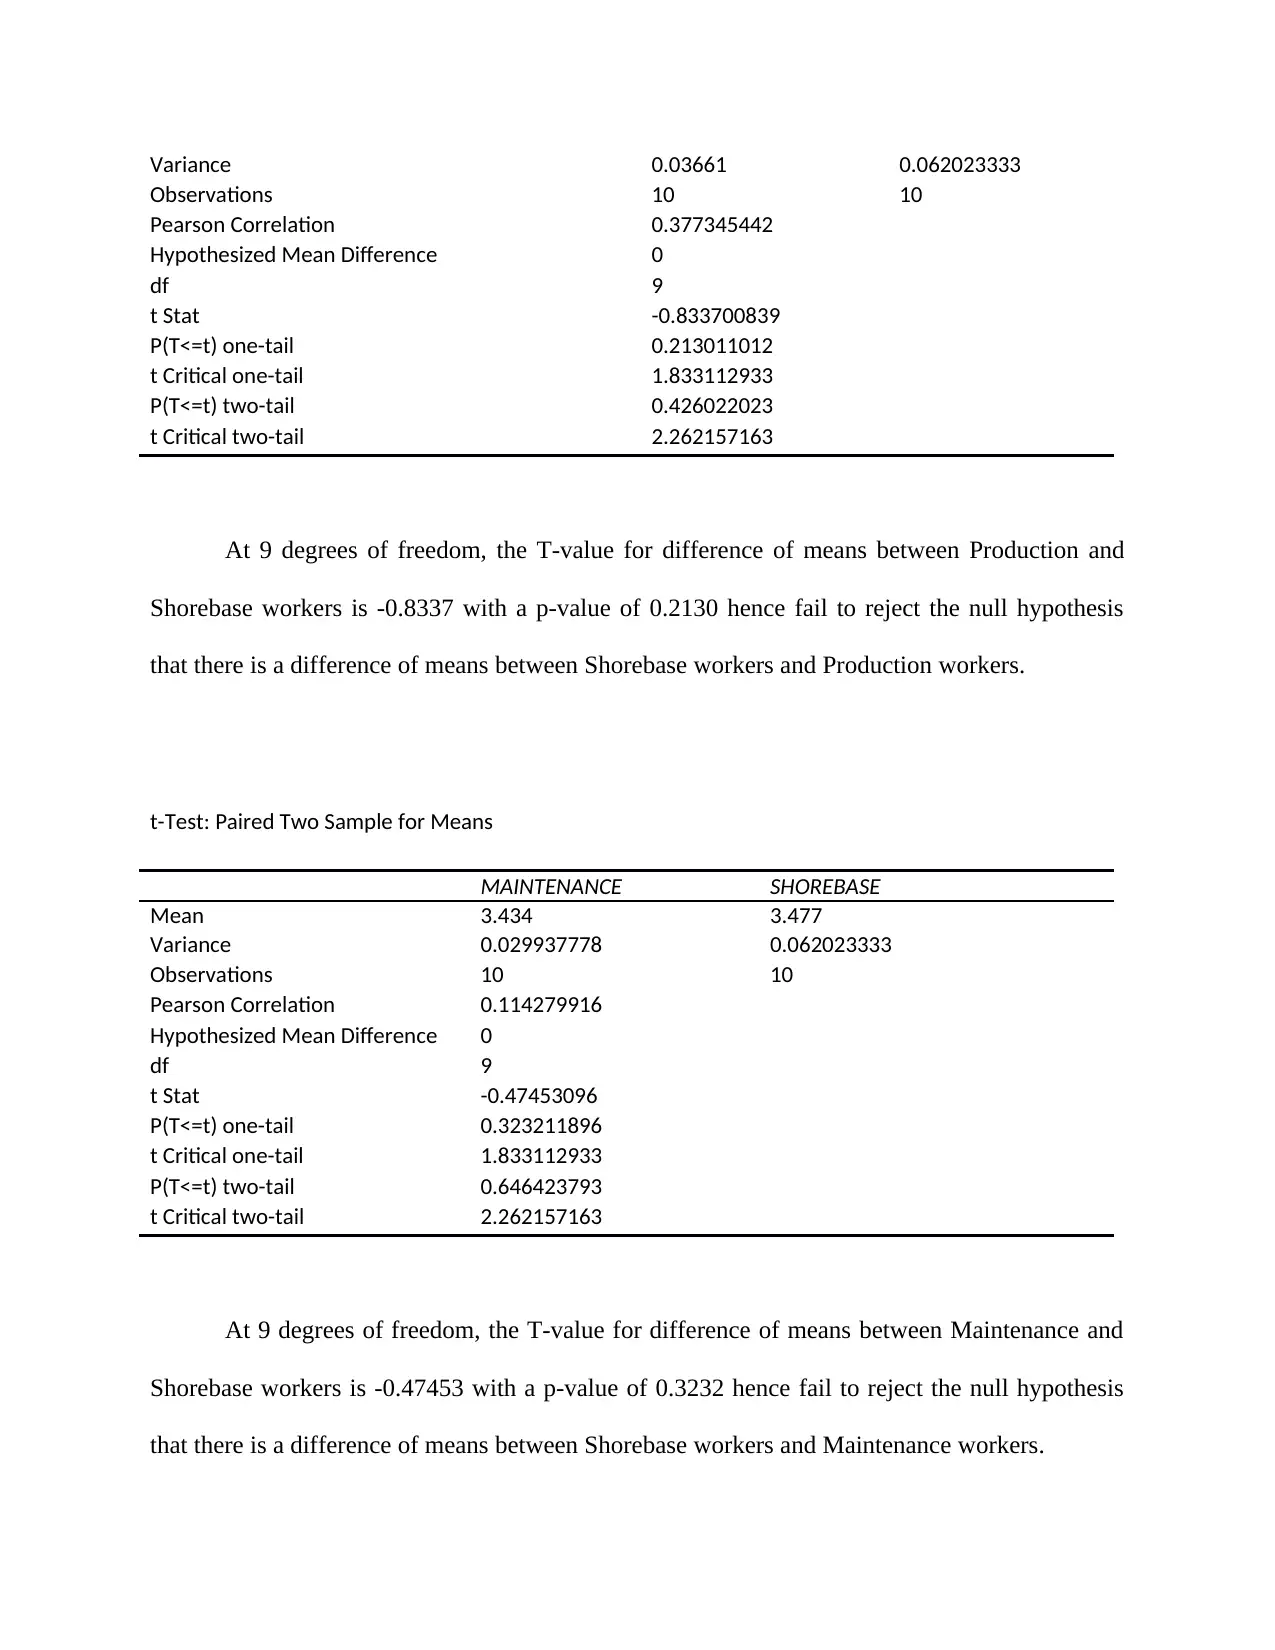
At 9 degrees of freedom, the T-value for difference of means between Production and
Shorebase workers is -0.8337 with a p-value of 0.2130 hence fail to reject the null hypothesis
that there is a difference of means between Shorebase workers and Production workers.
t-Test: Paired Two Sample for Means
MAINTENANCE SHOREBASE
Mean 3.434 3.477
Variance 0.029937778 0.062023333
Observations 10 10
Pearson Correlation 0.114279916
Hypothesized Mean Difference 0
df 9
t Stat -0.47453096
P(T<=t) one-tail 0.323211896
t Critical one-tail 1.833112933
P(T<=t) two-tail 0.646423793
t Critical two-tail 2.262157163
At 9 degrees of freedom, the T-value for difference of means between Maintenance and
Shorebase workers is -0.47453 with a p-value of 0.3232 hence fail to reject the null hypothesis
that there is a difference of means between Shorebase workers and Maintenance workers.
Observations 10 10
Pearson Correlation 0.377345442
Hypothesized Mean Difference 0
df 9
t Stat -0.833700839
P(T<=t) one-tail 0.213011012
t Critical one-tail 1.833112933
P(T<=t) two-tail 0.426022023
t Critical two-tail 2.262157163
At 9 degrees of freedom, the T-value for difference of means between Production and
Shorebase workers is -0.8337 with a p-value of 0.2130 hence fail to reject the null hypothesis
that there is a difference of means between Shorebase workers and Production workers.
t-Test: Paired Two Sample for Means
MAINTENANCE SHOREBASE
Mean 3.434 3.477
Variance 0.029937778 0.062023333
Observations 10 10
Pearson Correlation 0.114279916
Hypothesized Mean Difference 0
df 9
t Stat -0.47453096
P(T<=t) one-tail 0.323211896
t Critical one-tail 1.833112933
P(T<=t) two-tail 0.646423793
t Critical two-tail 2.262157163
At 9 degrees of freedom, the T-value for difference of means between Maintenance and
Shorebase workers is -0.47453 with a p-value of 0.3232 hence fail to reject the null hypothesis
that there is a difference of means between Shorebase workers and Maintenance workers.
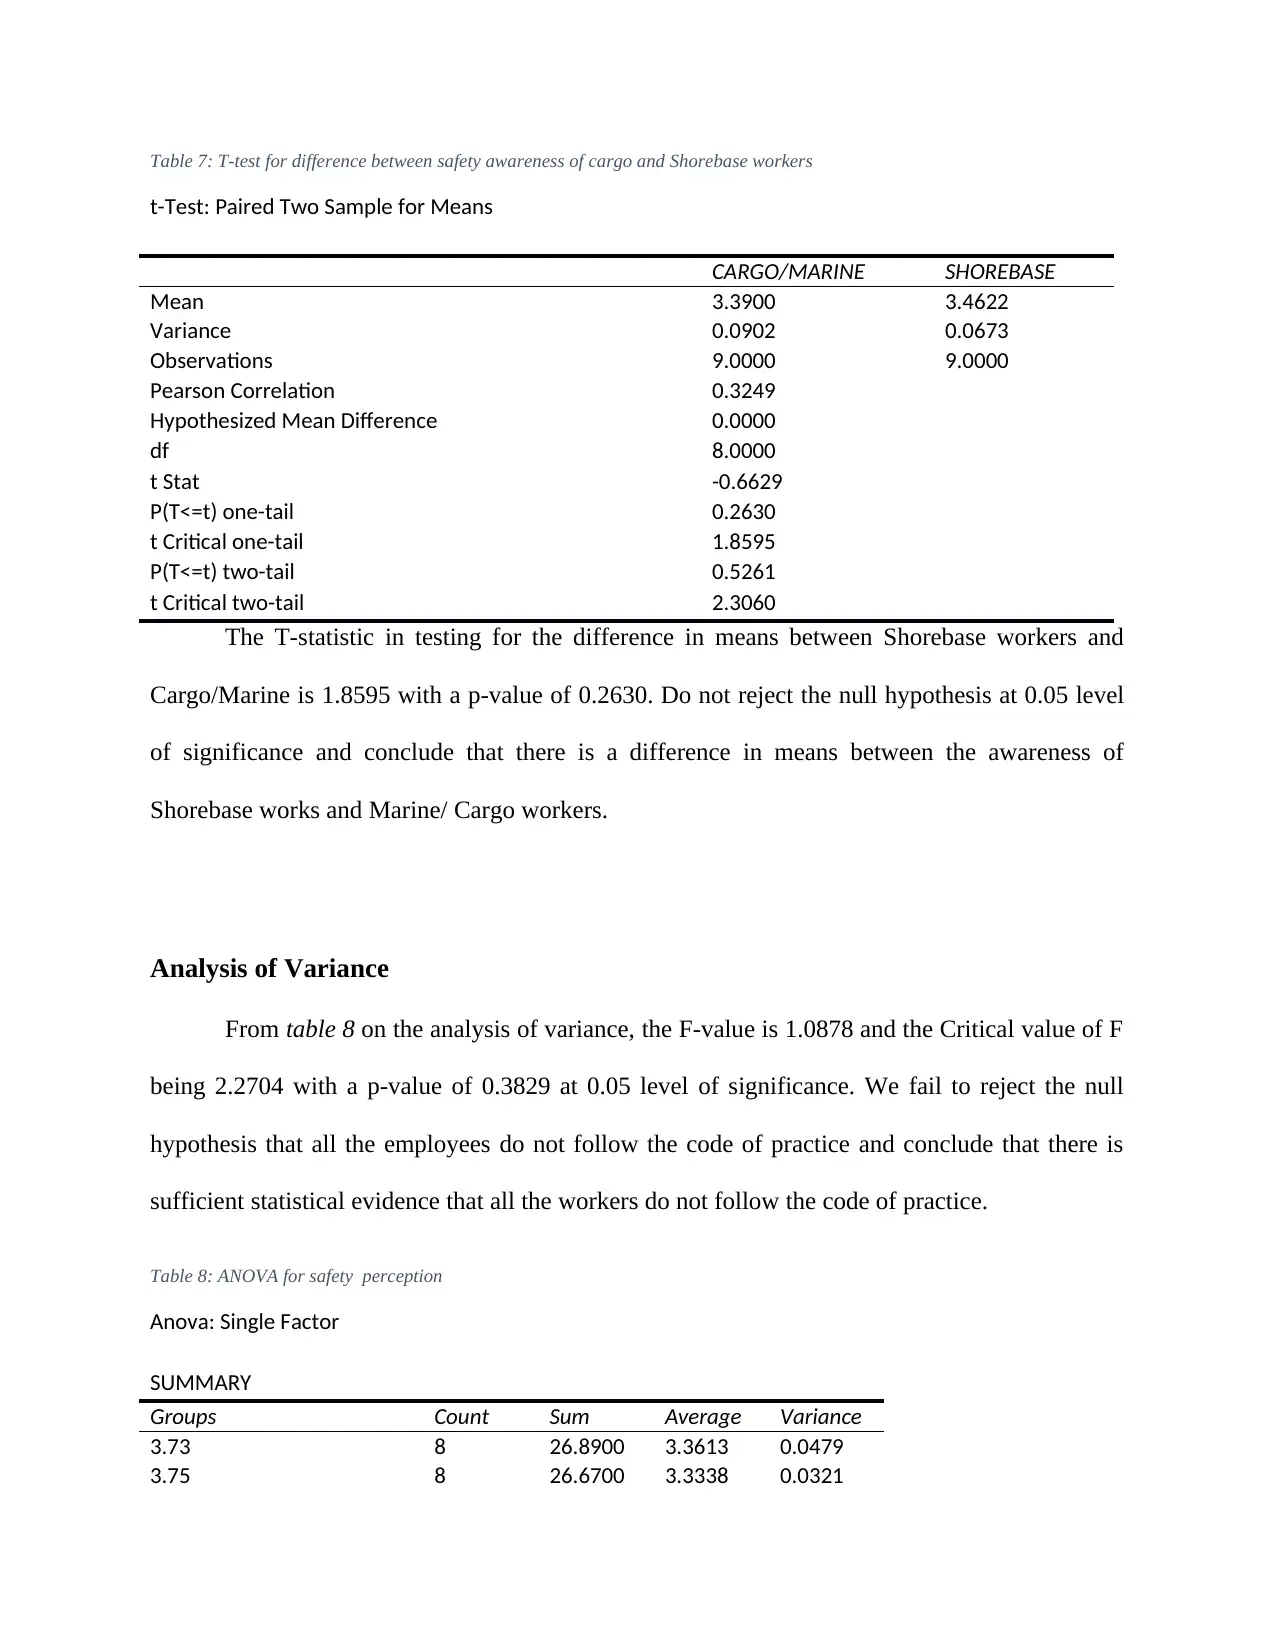
Table 7: T-test for difference between safety awareness of cargo and Shorebase workers
t-Test: Paired Two Sample for Means
CARGO/MARINE SHOREBASE
Mean 3.3900 3.4622
Variance 0.0902 0.0673
Observations 9.0000 9.0000
Pearson Correlation 0.3249
Hypothesized Mean Difference 0.0000
df 8.0000
t Stat -0.6629
P(T<=t) one-tail 0.2630
t Critical one-tail 1.8595
P(T<=t) two-tail 0.5261
t Critical two-tail 2.3060
The T-statistic in testing for the difference in means between Shorebase workers and
Cargo/Marine is 1.8595 with a p-value of 0.2630. Do not reject the null hypothesis at 0.05 level
of significance and conclude that there is a difference in means between the awareness of
Shorebase works and Marine/ Cargo workers.
Analysis of Variance
From table 8 on the analysis of variance, the F-value is 1.0878 and the Critical value of F
being 2.2704 with a p-value of 0.3829 at 0.05 level of significance. We fail to reject the null
hypothesis that all the employees do not follow the code of practice and conclude that there is
sufficient statistical evidence that all the workers do not follow the code of practice.
Table 8: ANOVA for safety perception
Anova: Single Factor
SUMMARY
Groups Count Sum Average Variance
3.73 8 26.8900 3.3613 0.0479
3.75 8 26.6700 3.3338 0.0321
⊘ This is a preview!⊘
Do you want full access?
Subscribe today to unlock all pages.
Trusted by 1+ million students worldwide
1 out of 25
Your All-in-One AI-Powered Toolkit for Academic Success.
+13062052269
info@desklib.com
Available 24*7 on WhatsApp / Email
![[object Object]](/_next/static/media/star-bottom.7253800d.svg)
Unlock your academic potential
Copyright © 2020–2026 A2Z Services. All Rights Reserved. Developed and managed by ZUCOL.