Investment Management Report: Analysis of Malaysian Companies

Verified

Added on  2023/01/07

|47
|4501
|47
Report
AI Summary
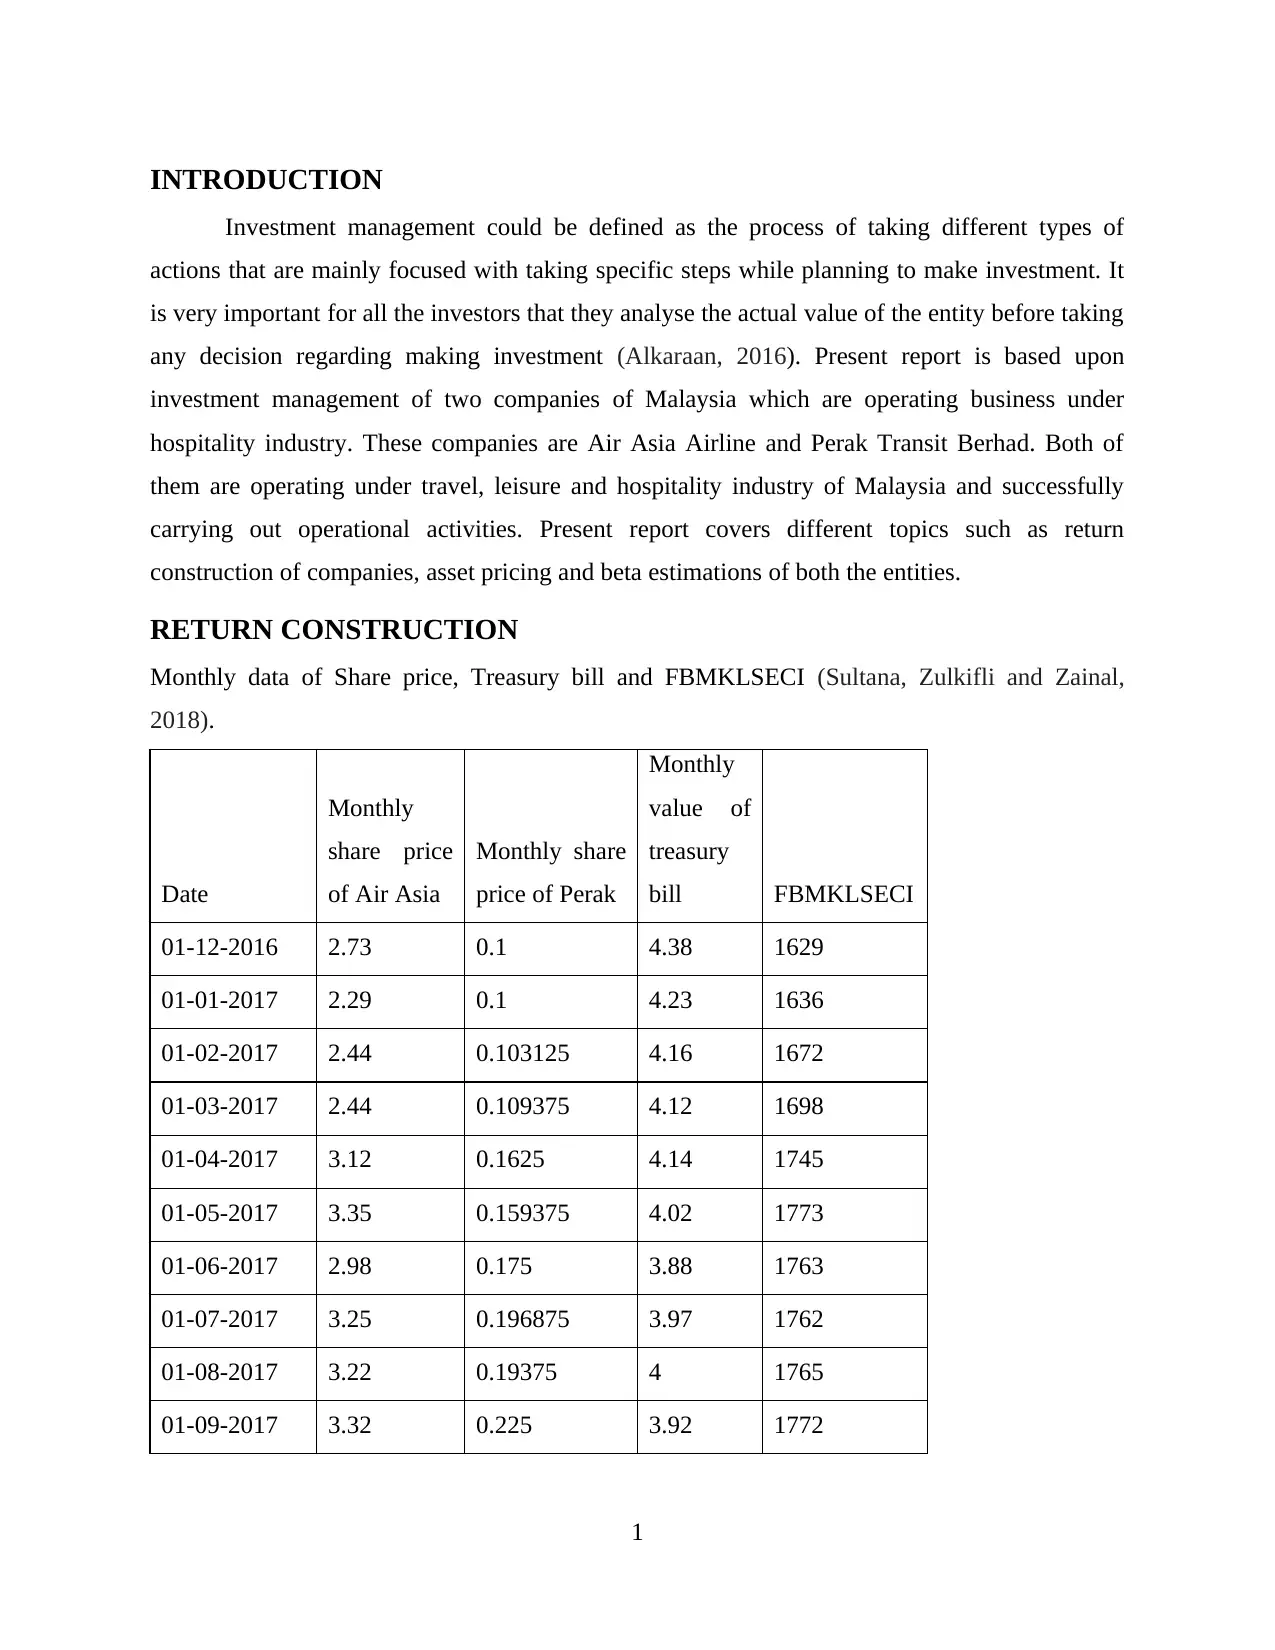
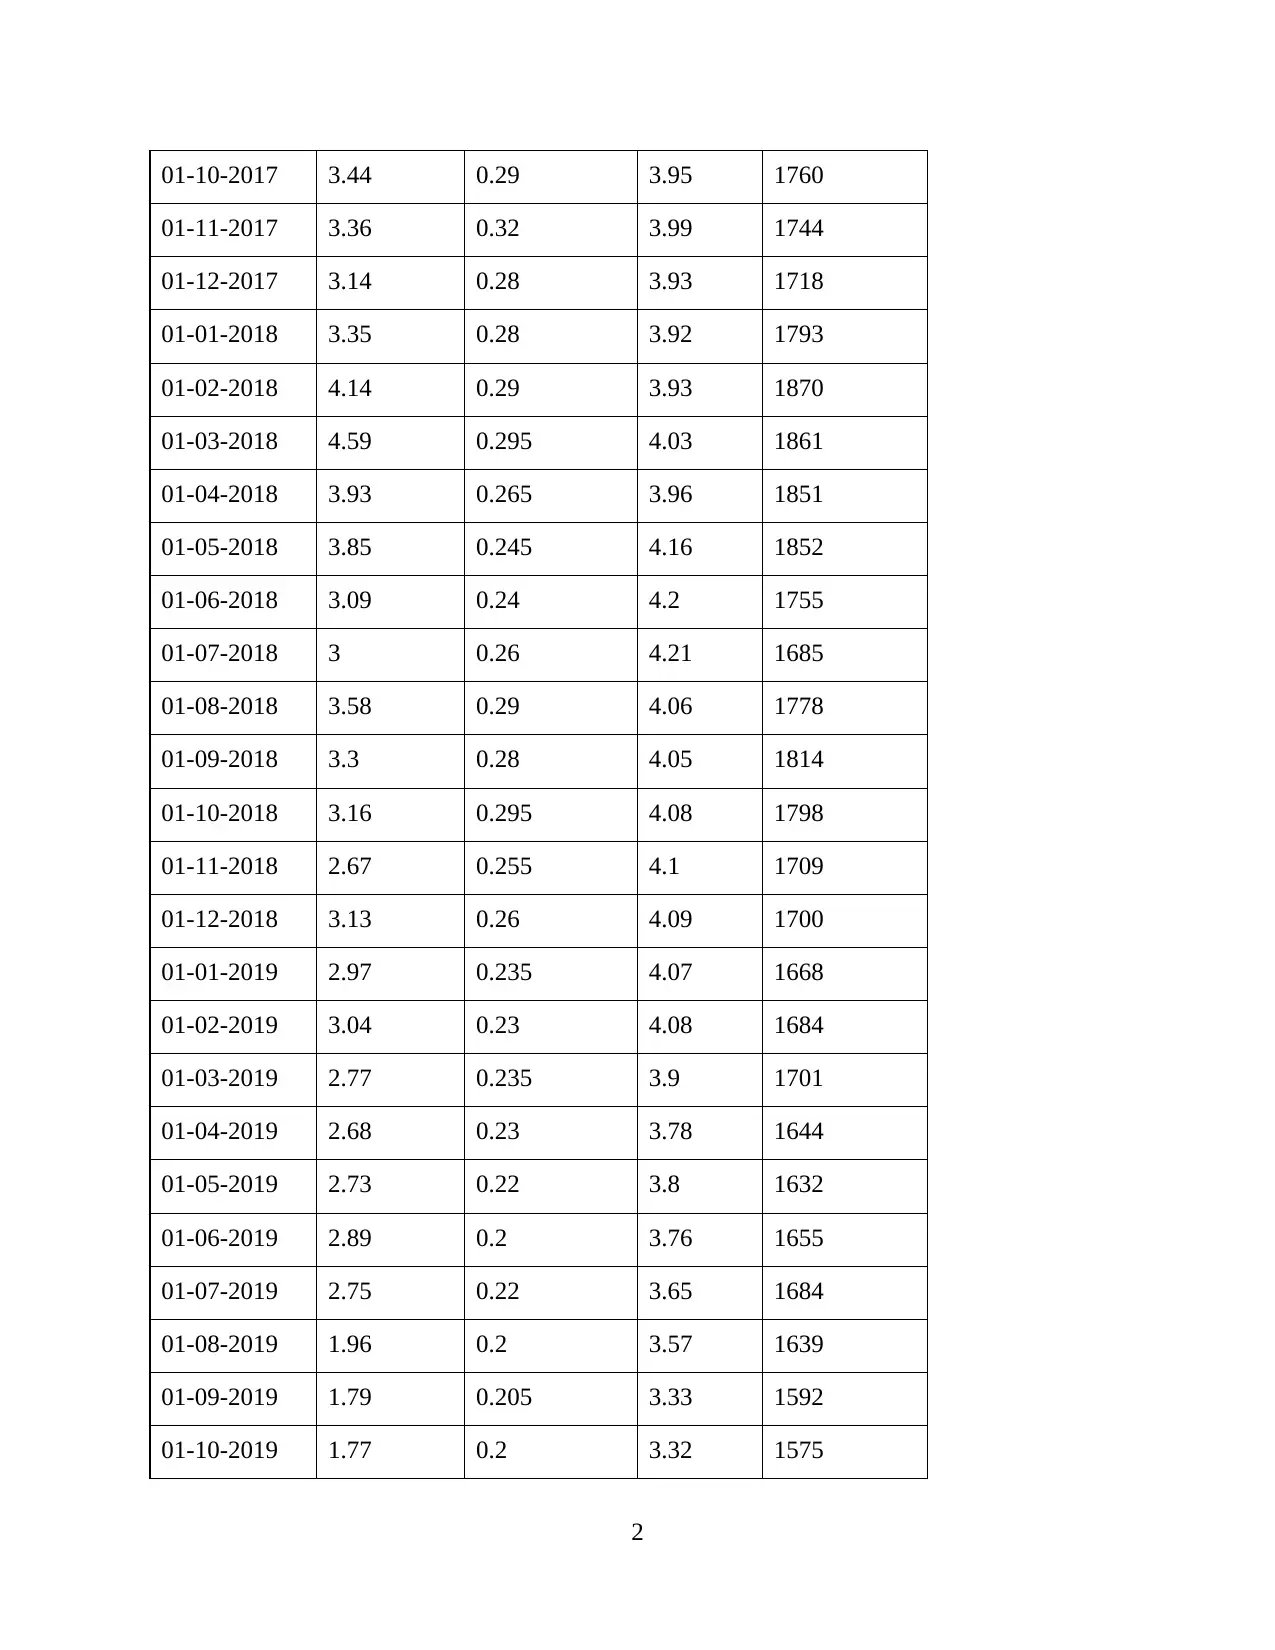
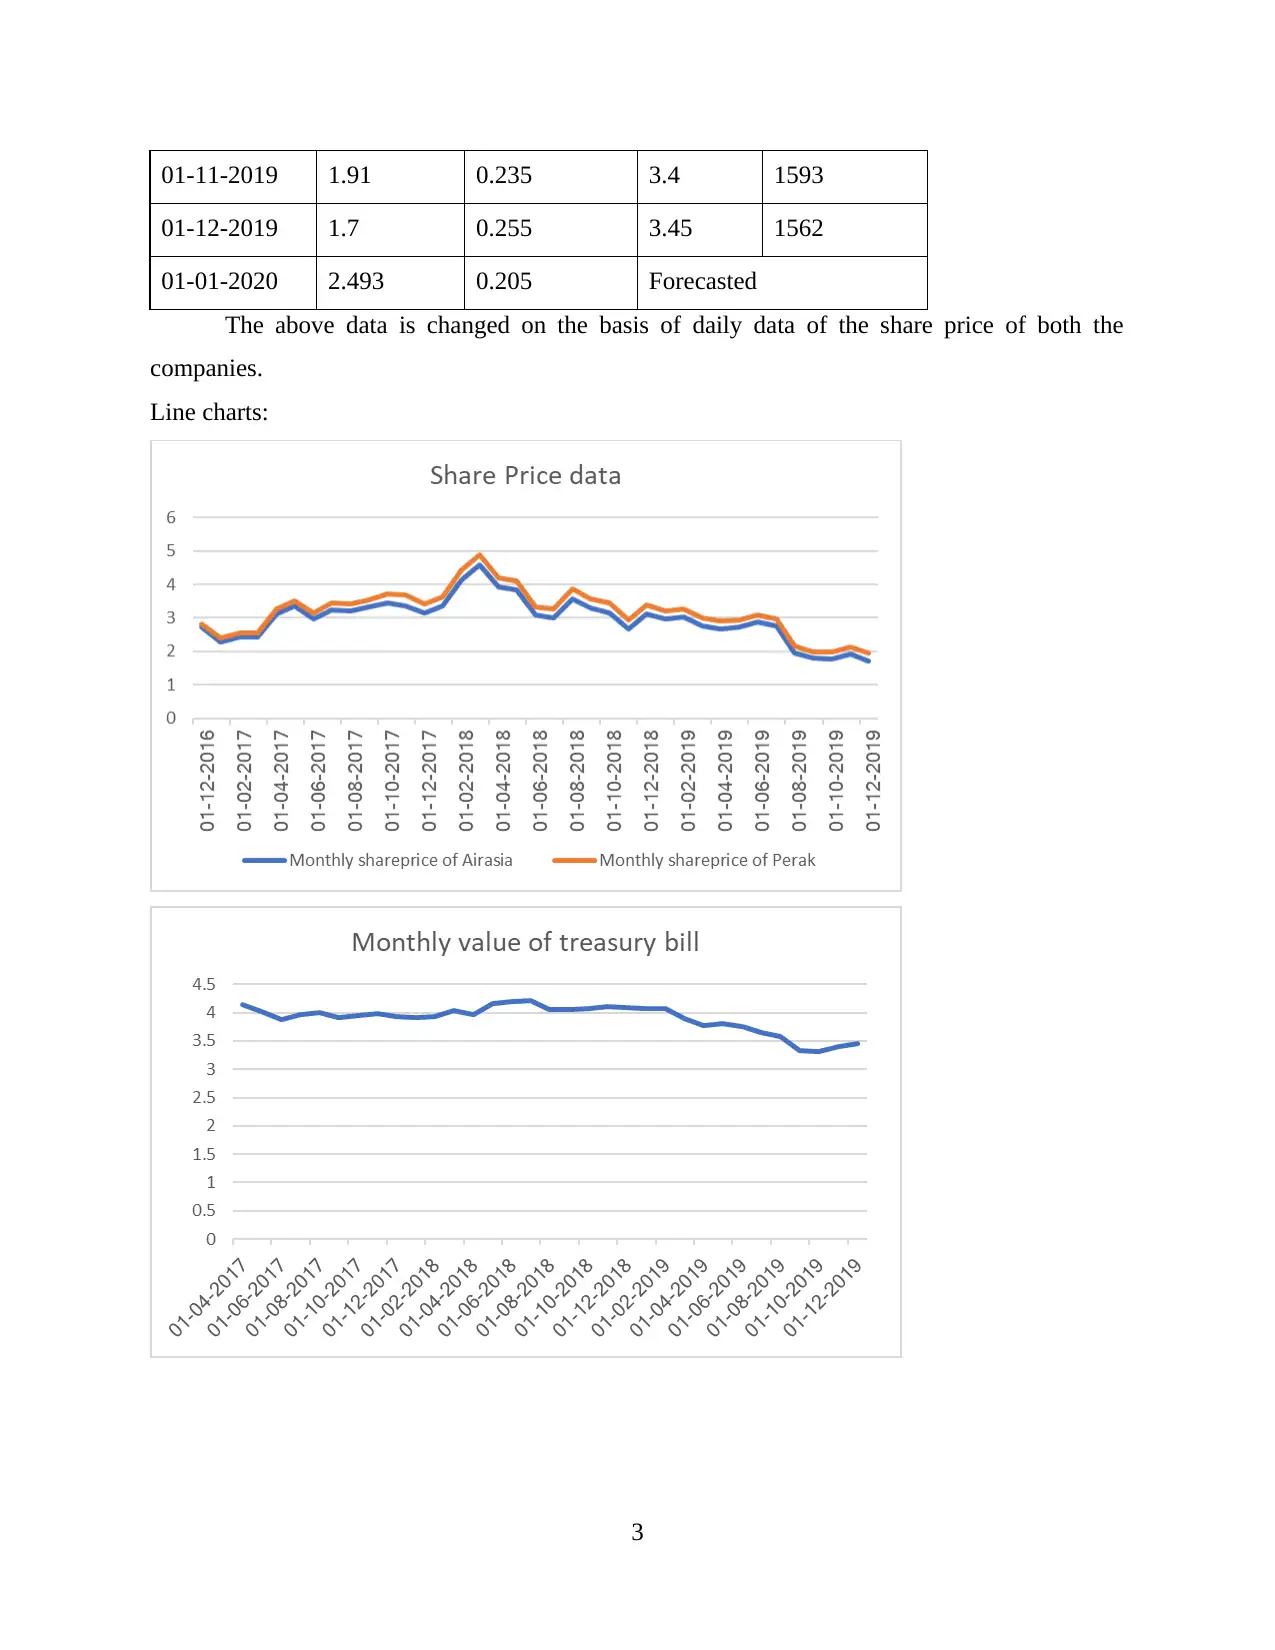
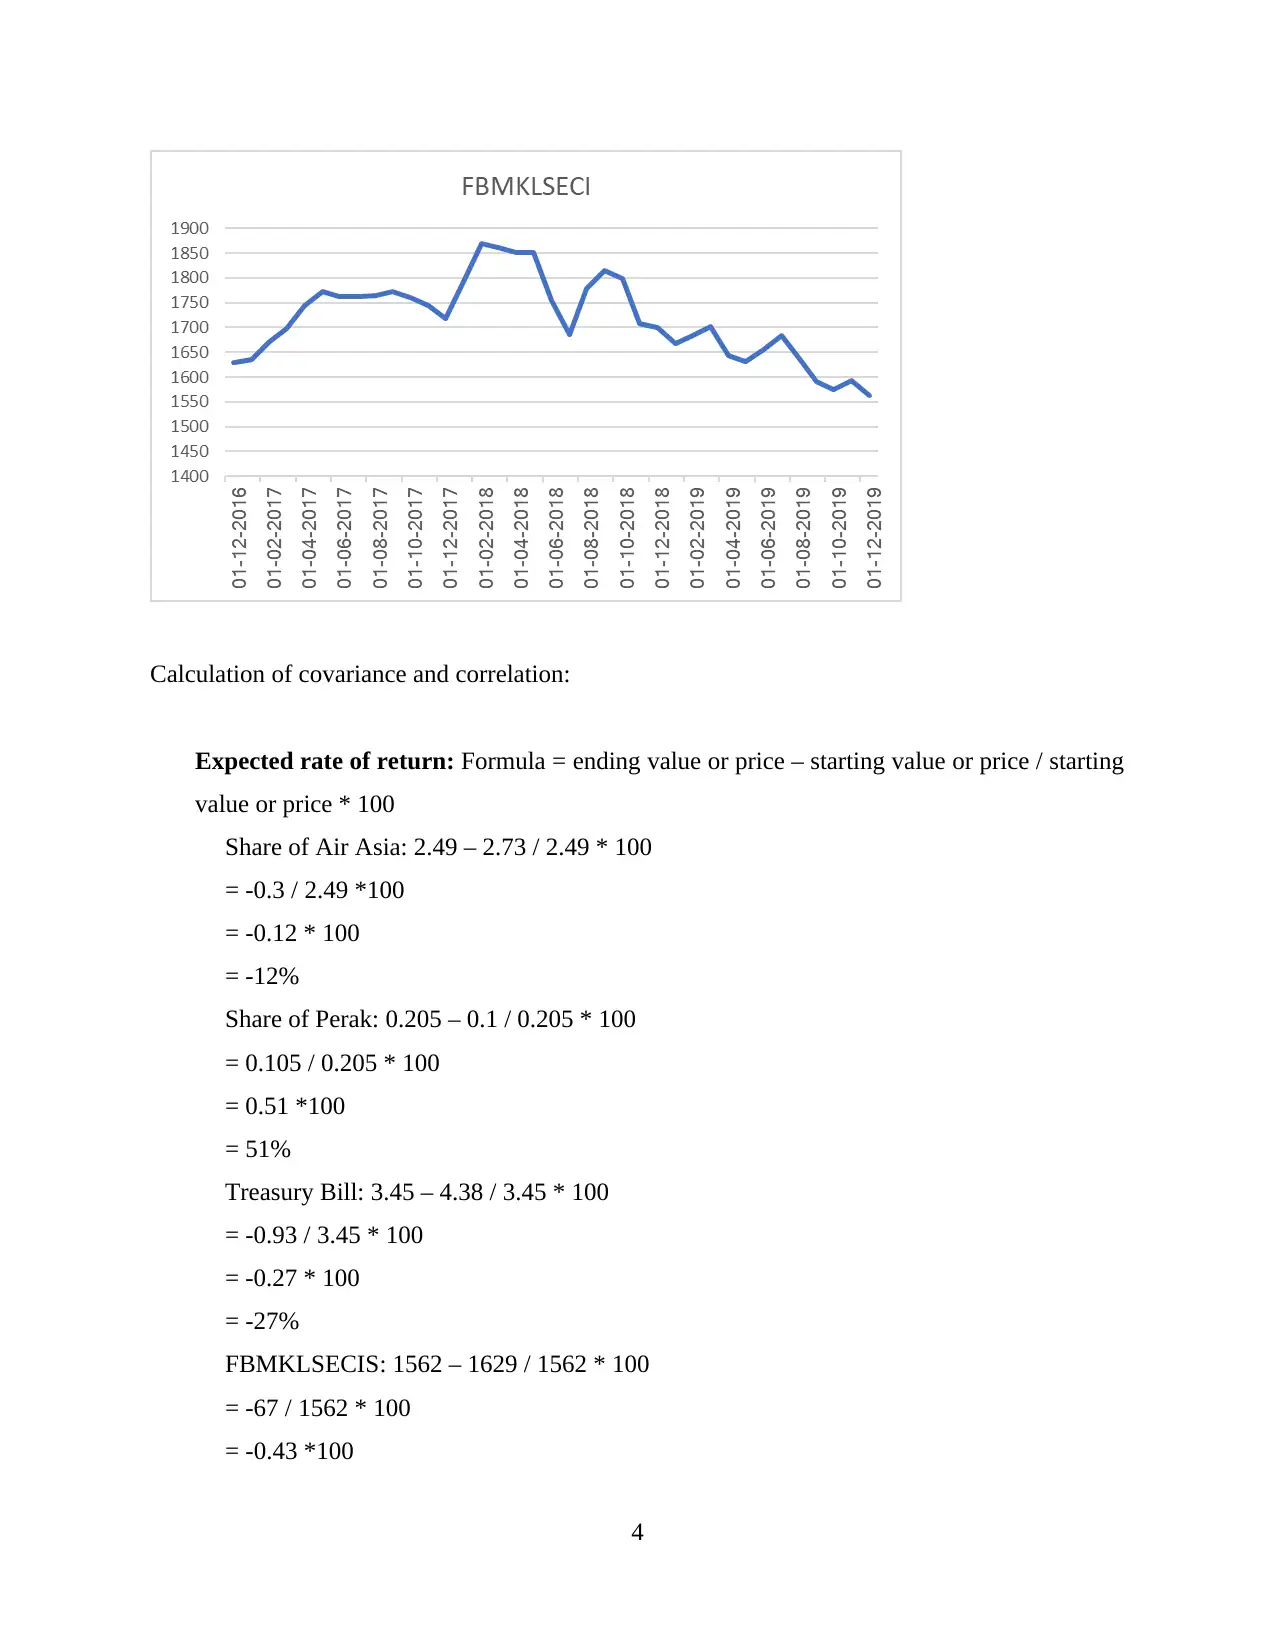
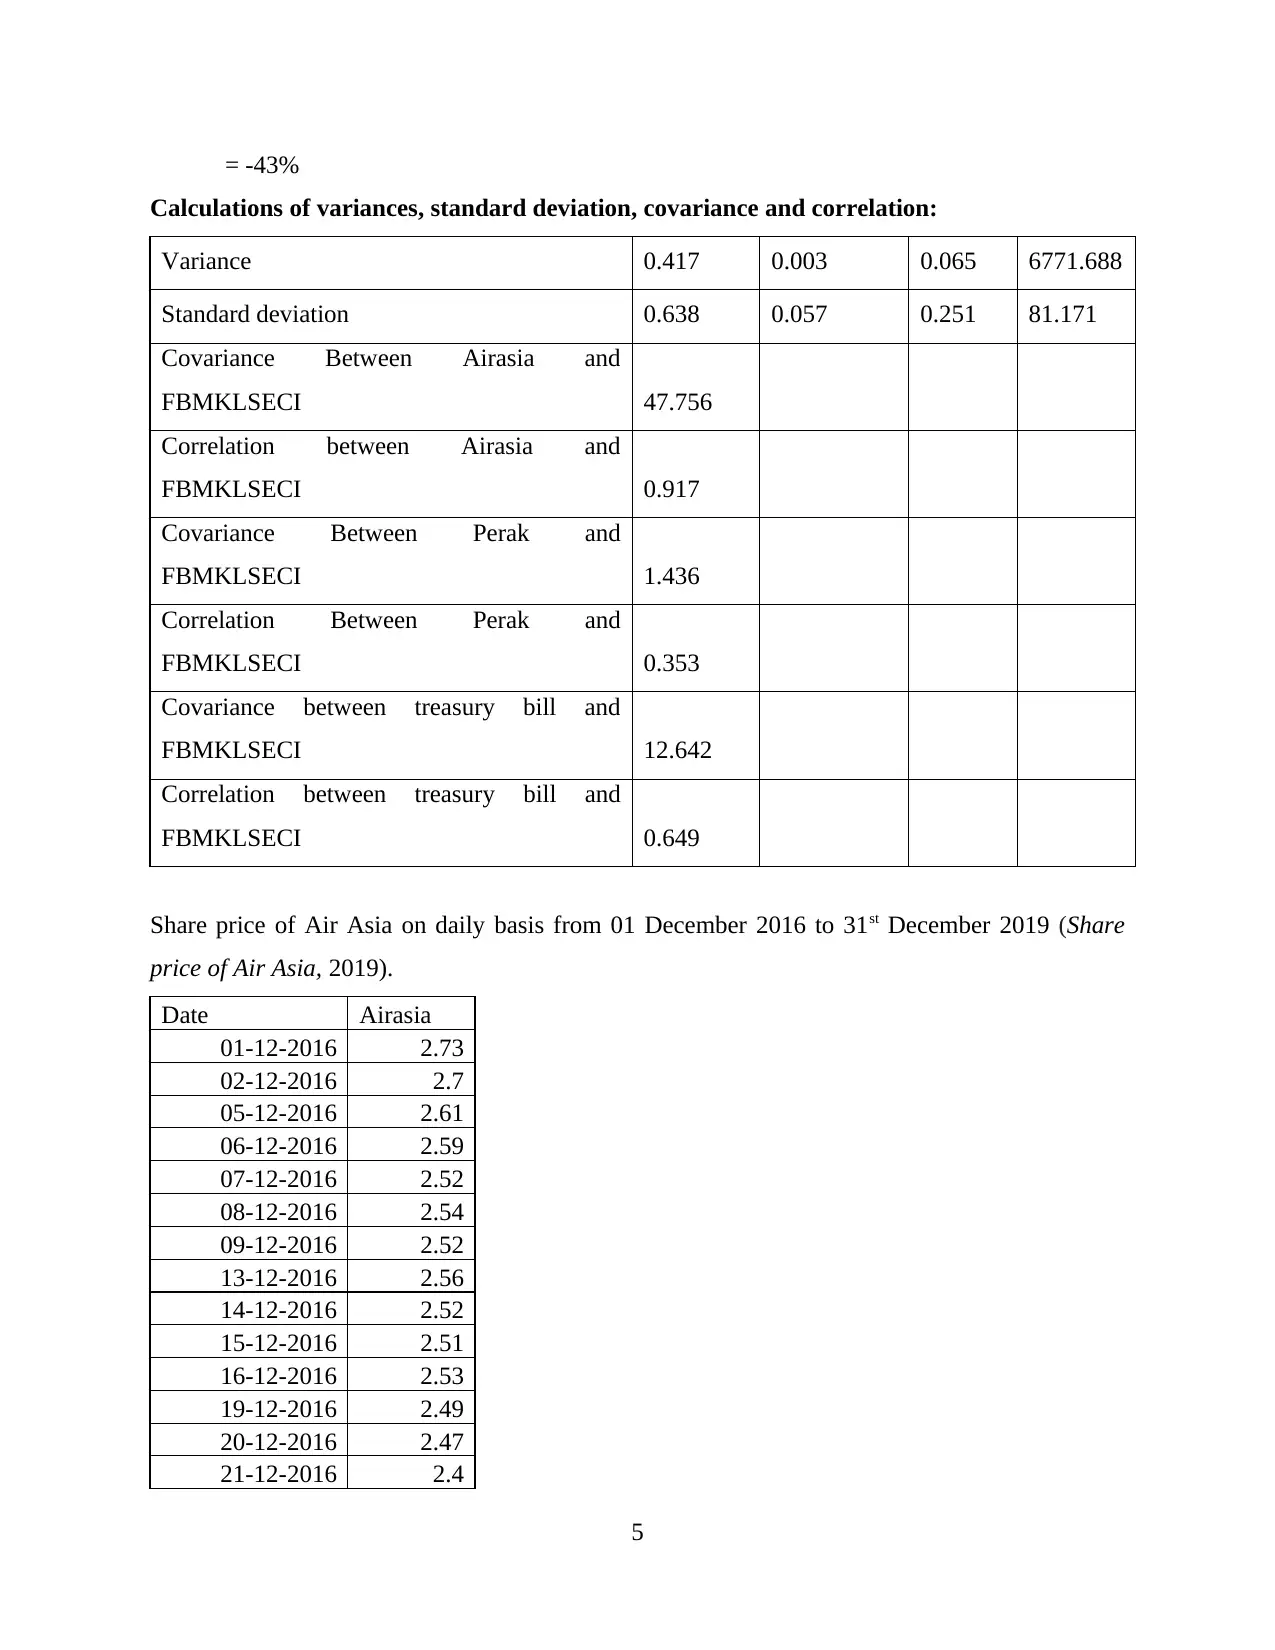
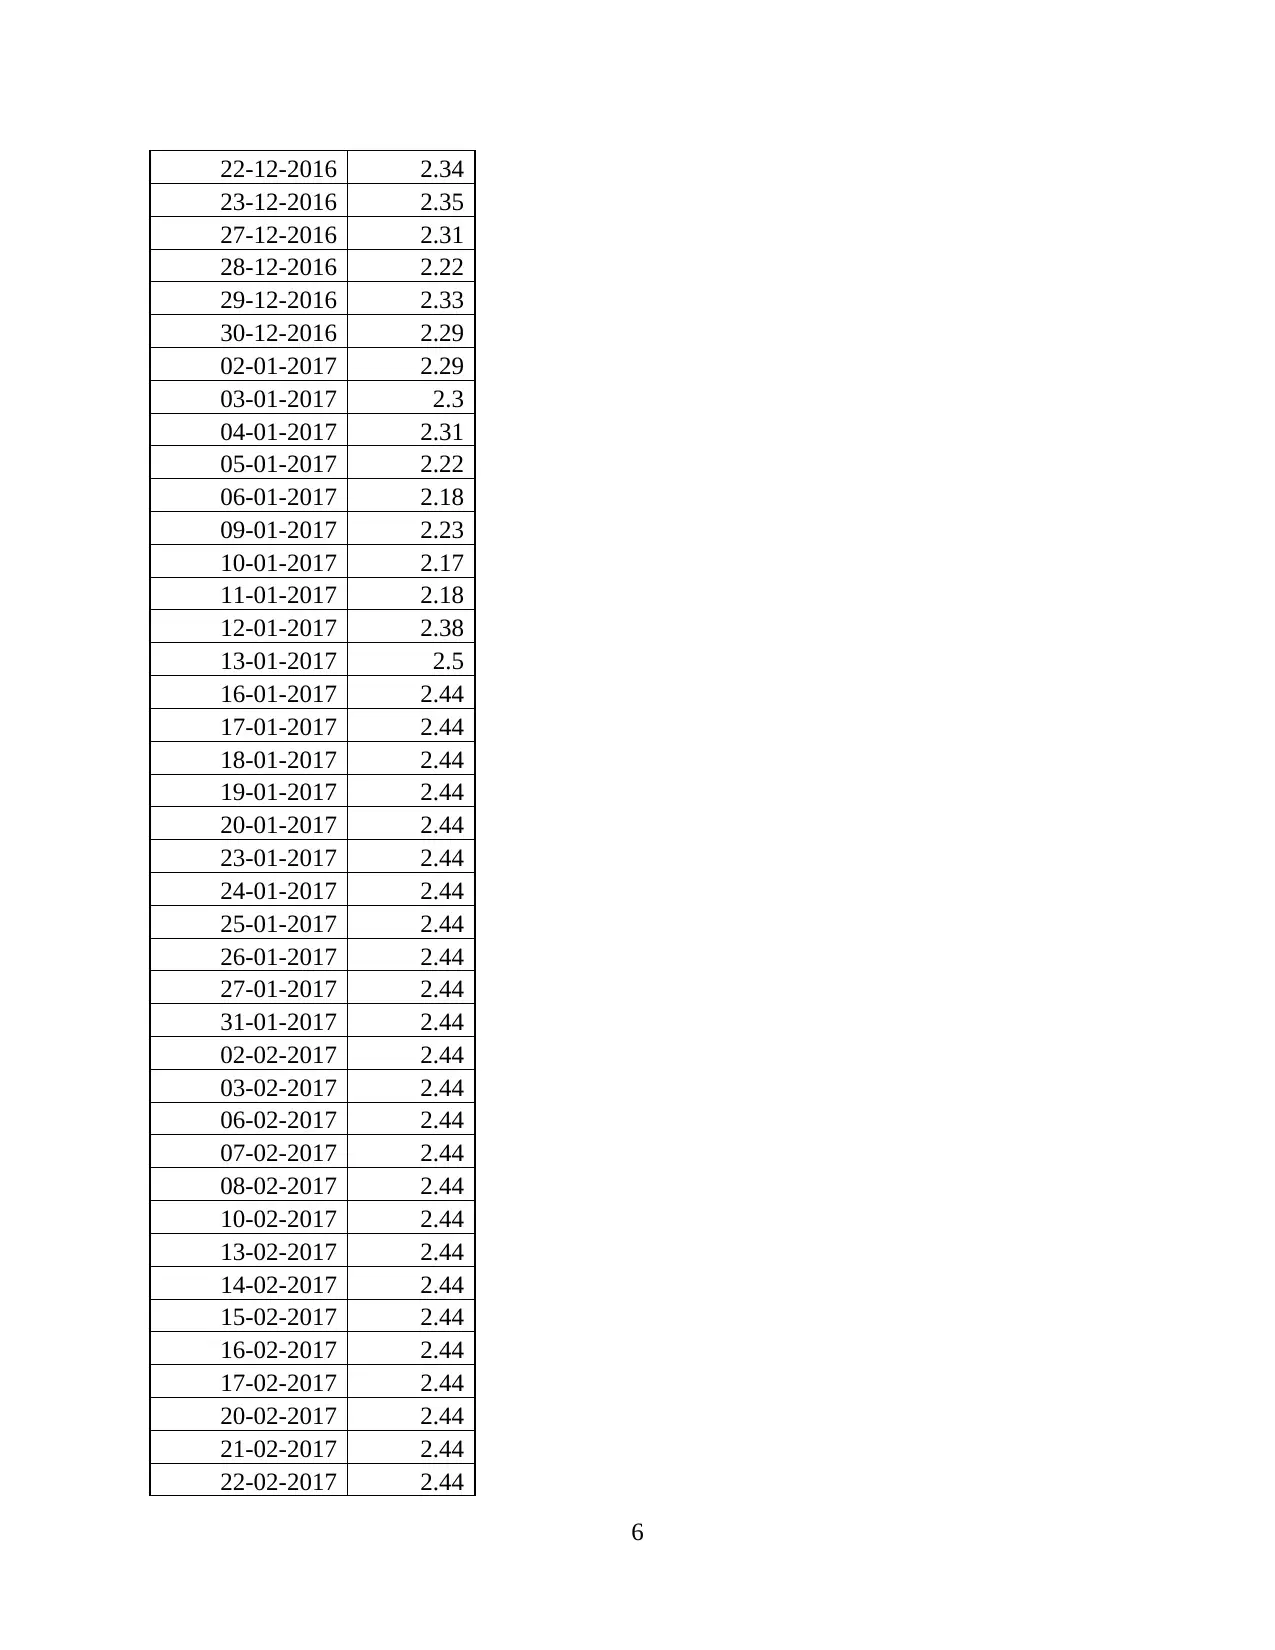
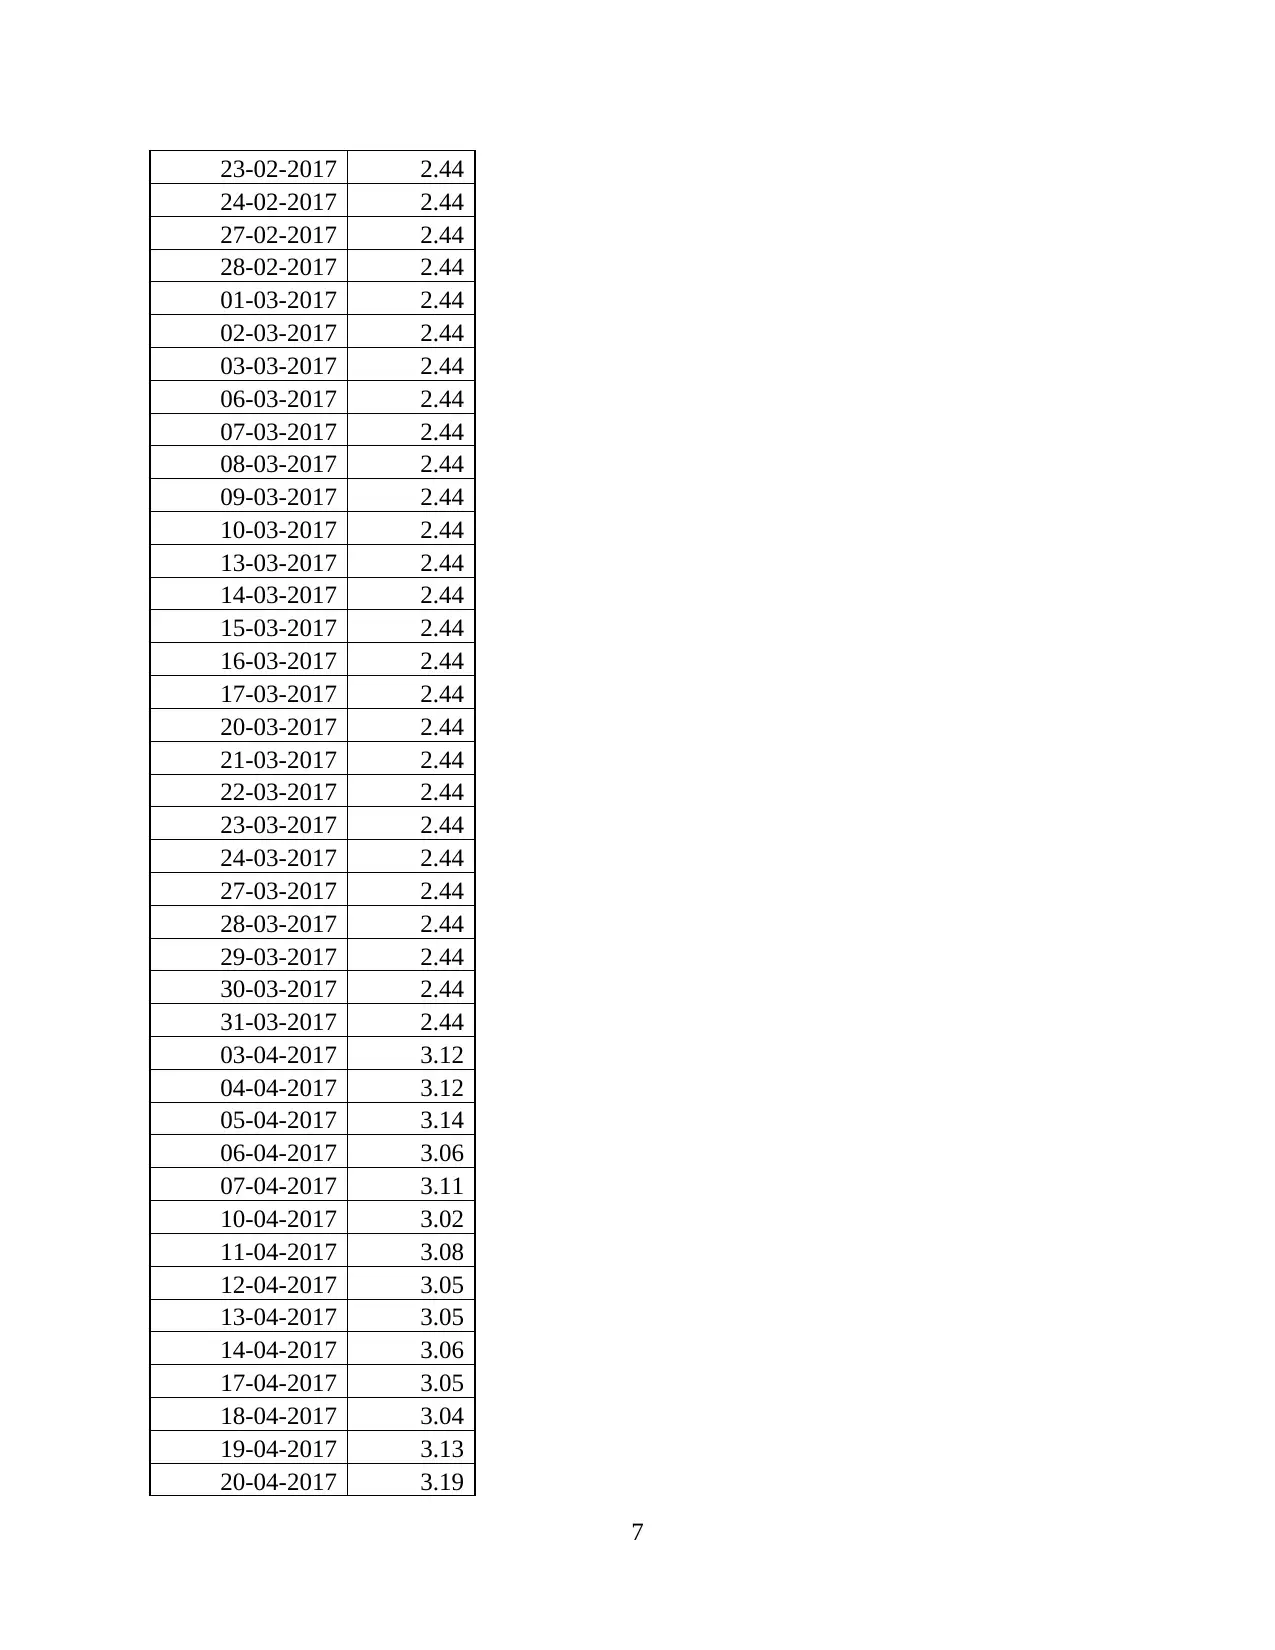
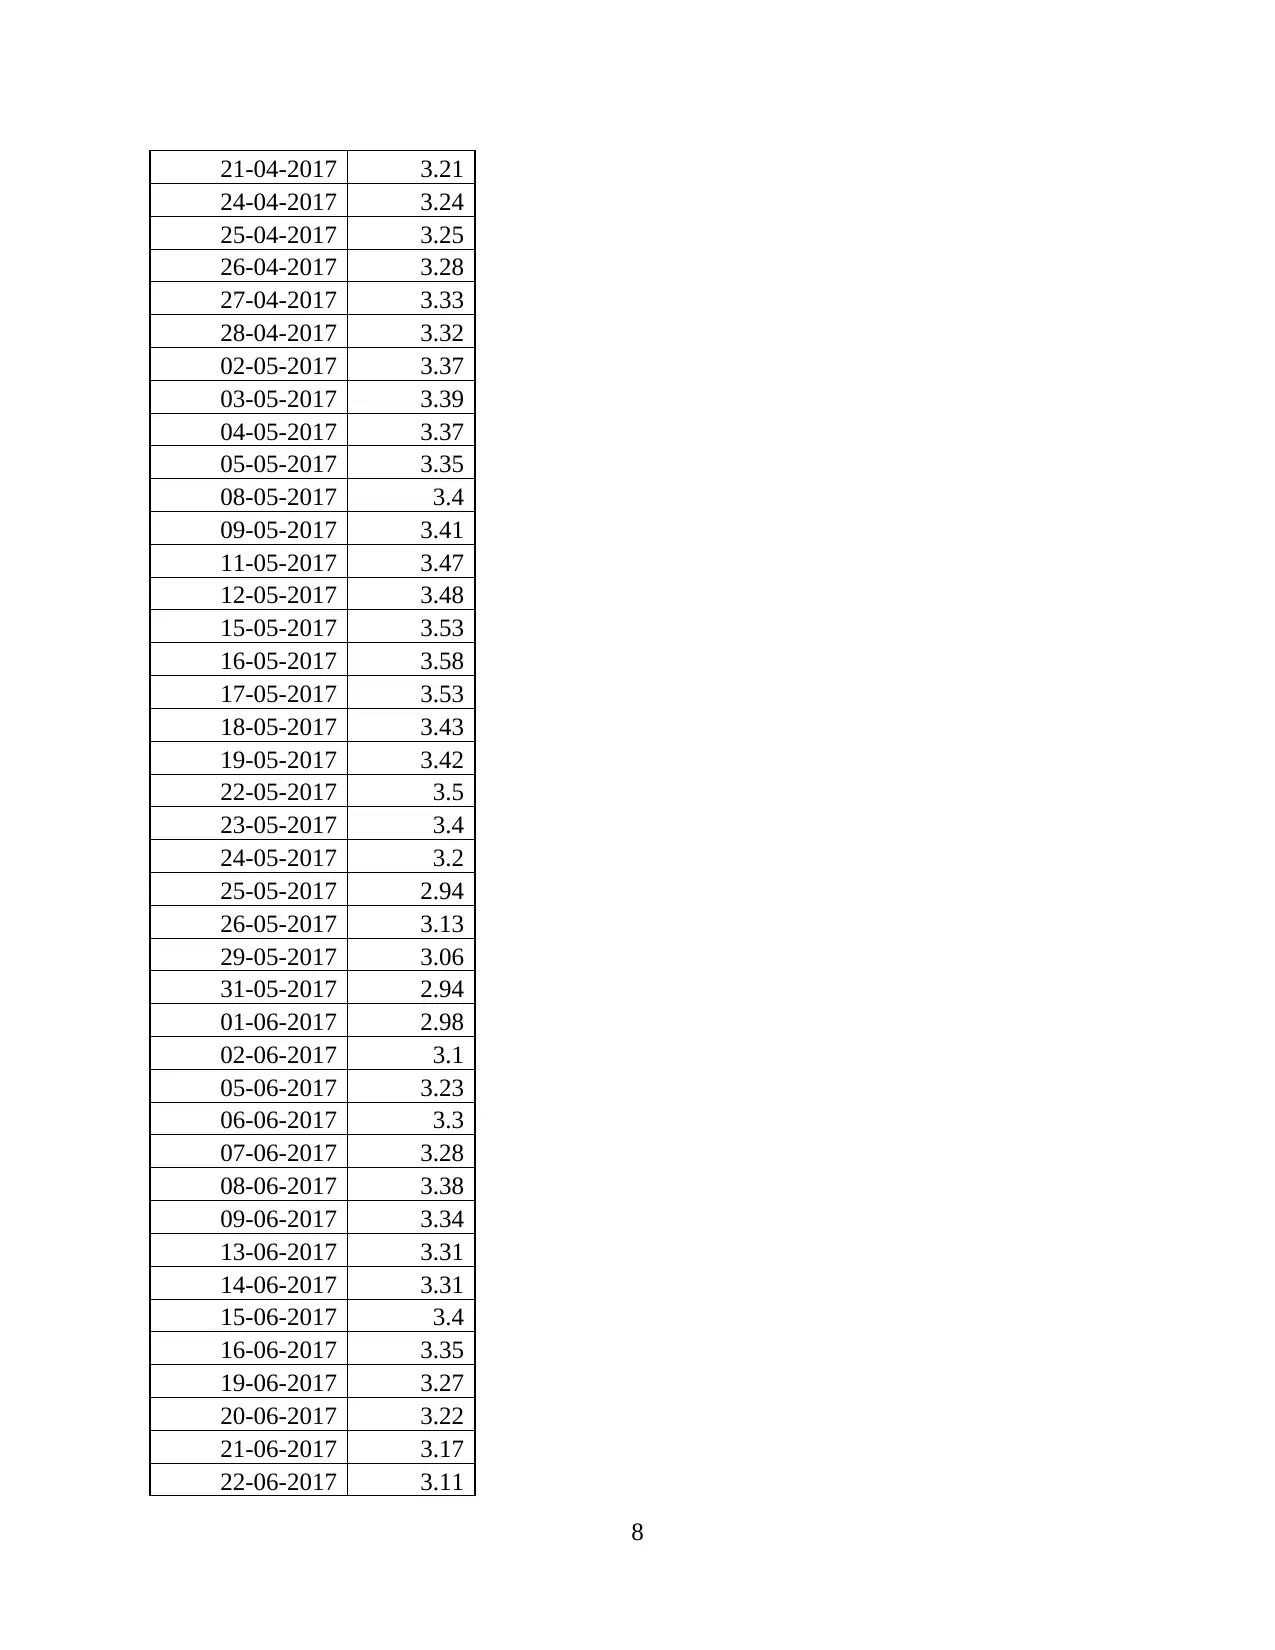
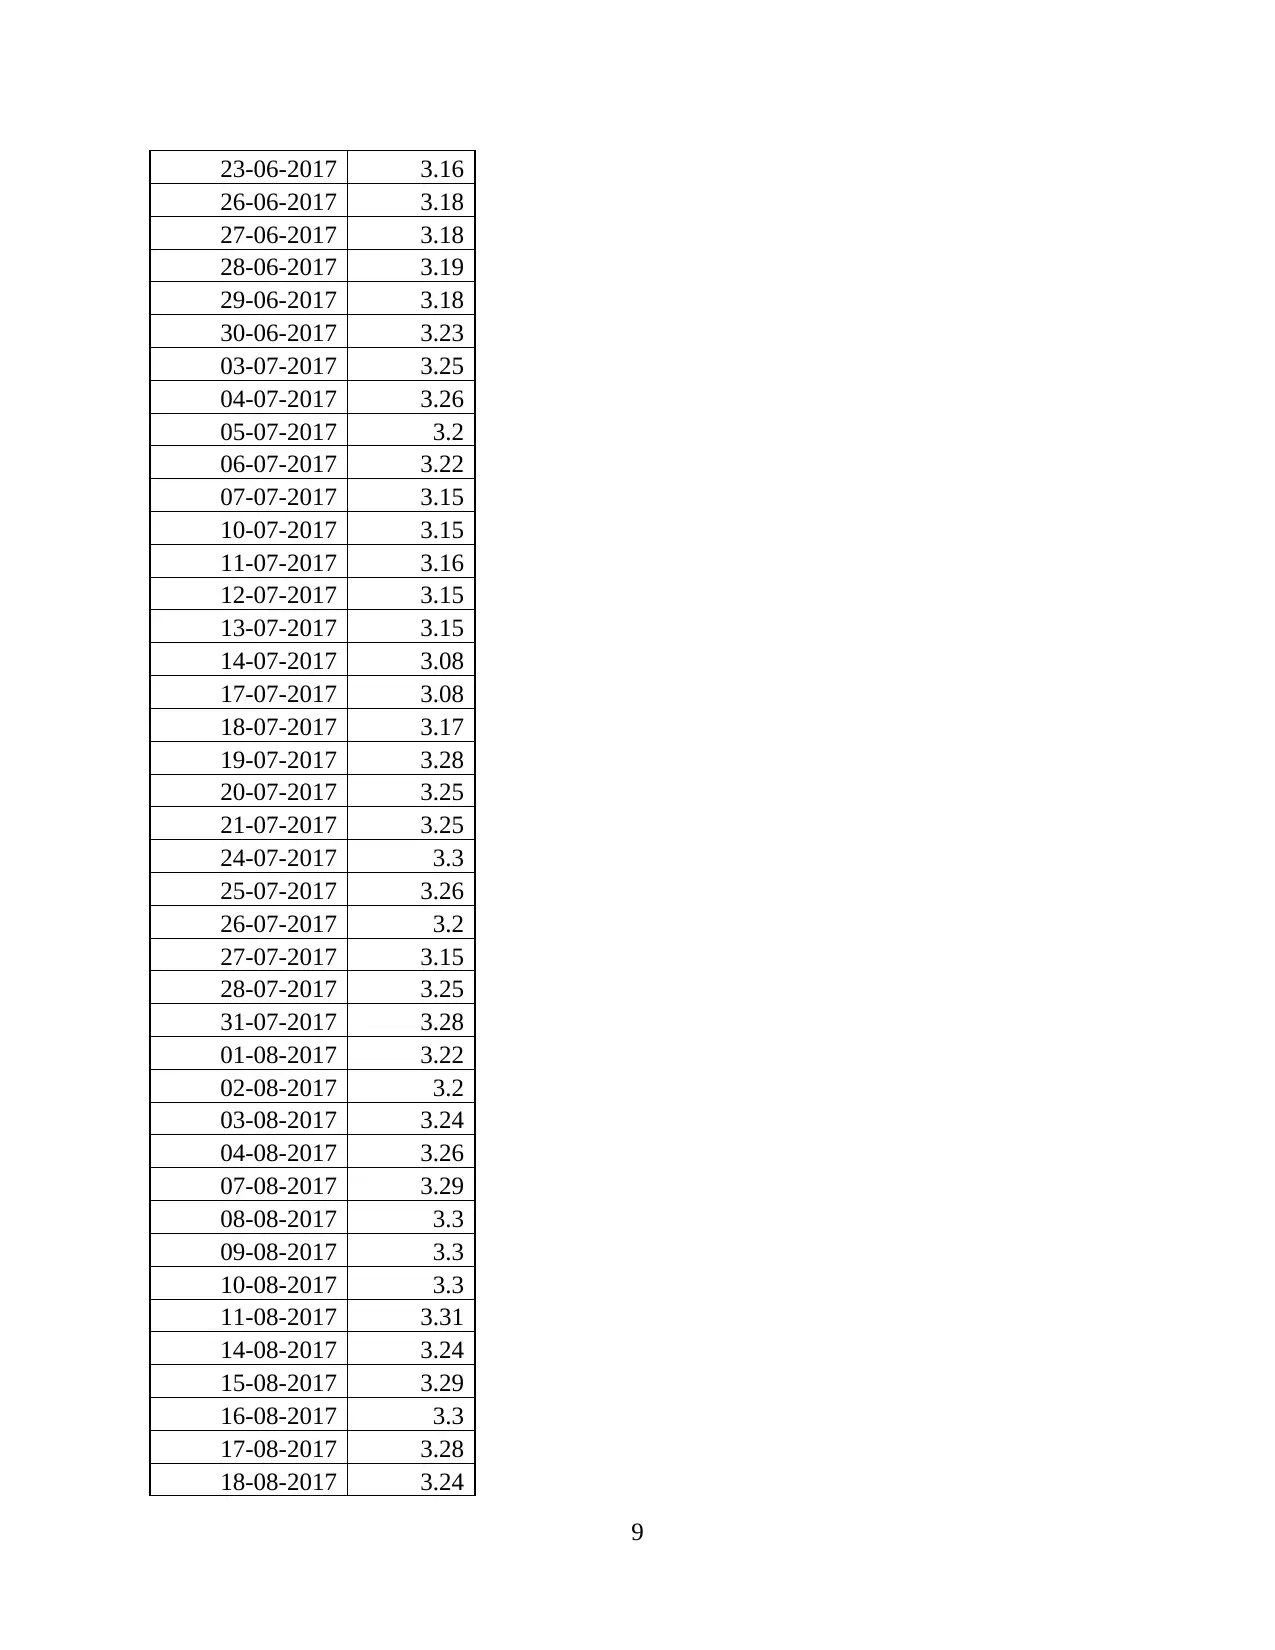
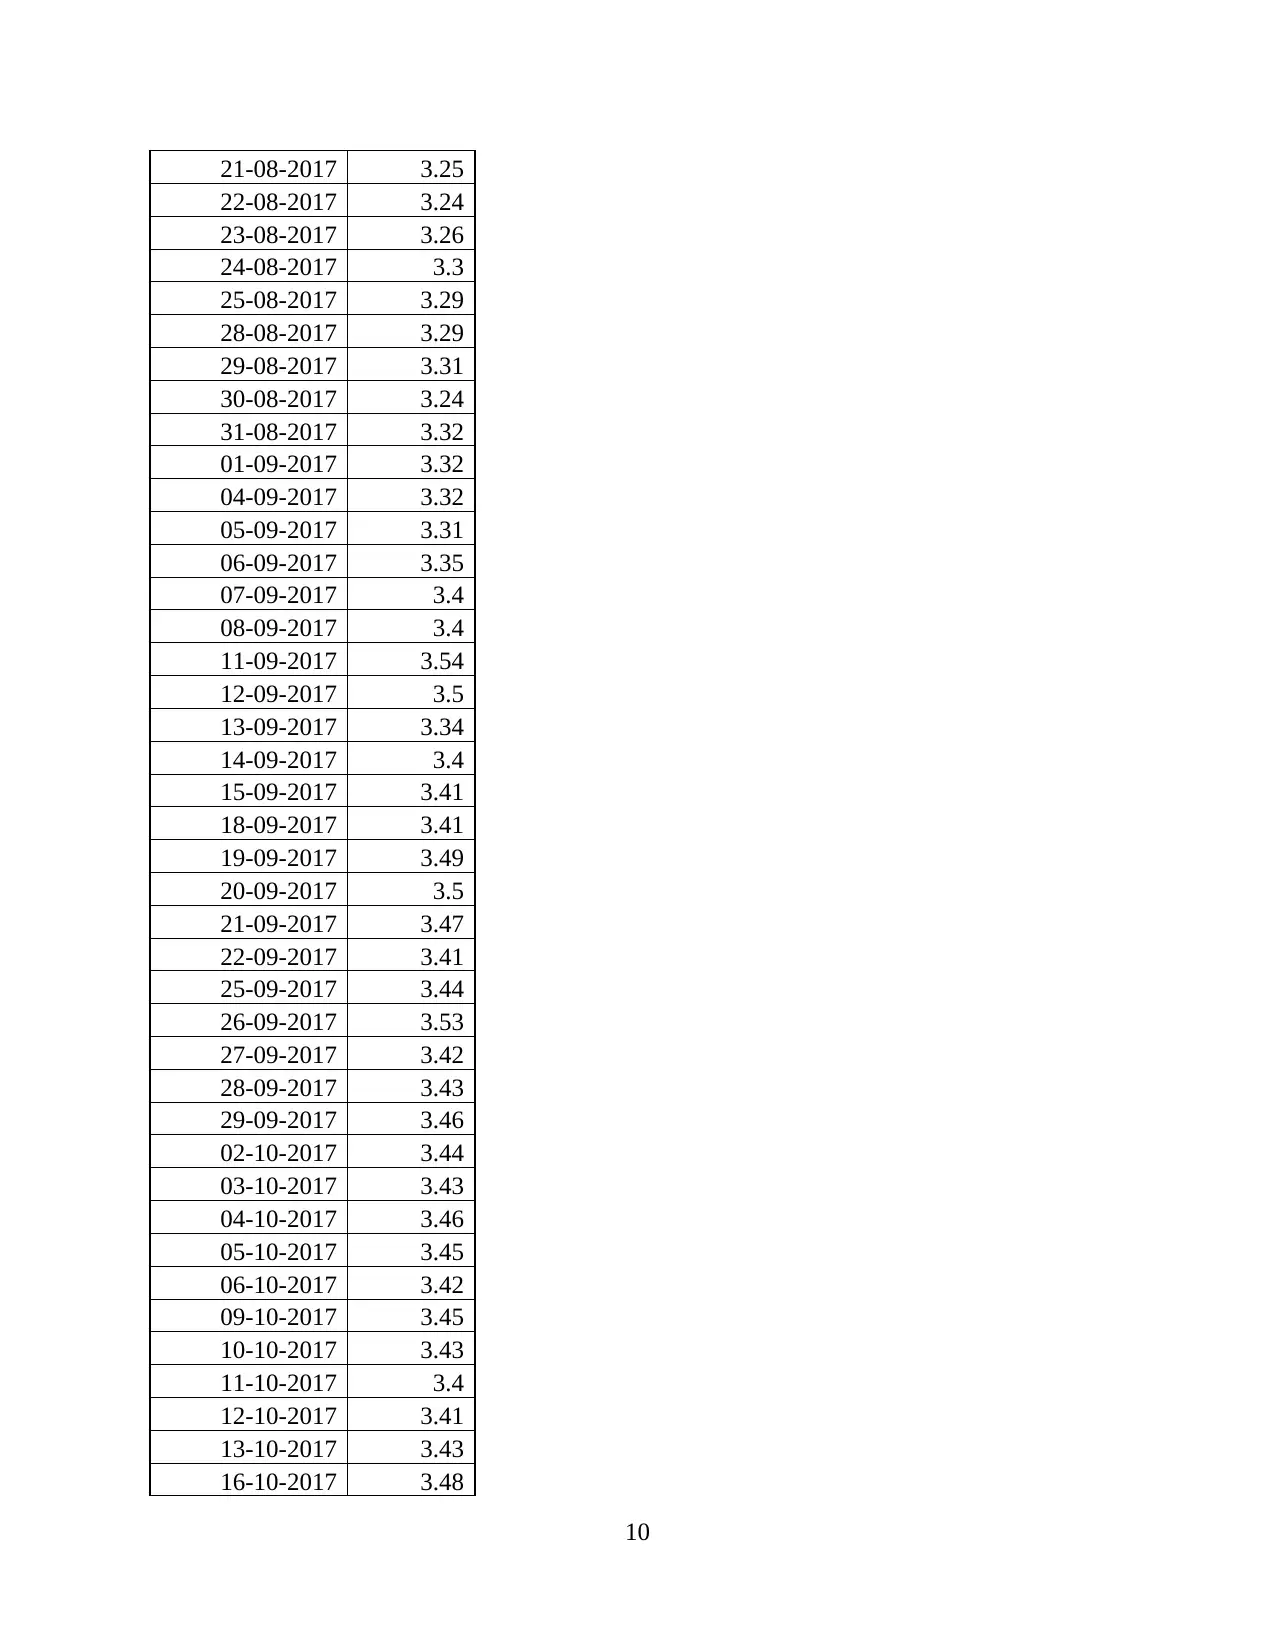
This report provides an in-depth analysis of investment management, focusing on two Malaysian companies operating in the hospitality industry: Air Asia Airline and Perak Transit Berhad. The report covers key aspects of investment management, including return construction, asset pricing, and beta estimation. It utilizes monthly share price data, treasury bill rates, and FBMKLSECI data from December 2016 to December 2019 to calculate returns, variances, standard deviations, covariances, and correlations. The analysis includes the calculation of expected rates of return for both companies, along with detailed daily share price data for Air Asia. The report also delves into the calculation of CAPM and beta estimation, providing a comprehensive overview of financial performance and investment strategies within the Malaysian hospitality sector. The data is presented in tables and includes calculations of variance, standard deviation, covariance, and correlation, providing a thorough financial analysis of the two companies.
Document Page
Investment
Management
tabler-icon-diamond-filled.svg

Paraphrase This Document

Need a fresh take? Get an instant paraphrase of this document with our AI Paraphraser
Document Page
Table of Contents
Table of Contents.............................................................................................................................2
INTRODUCTION...........................................................................................................................1
RETURN CONSTRUCTION.........................................................................................................1
ASSET PRICING..........................................................................................................................44
Calculation of CAPM................................................................................................................44
BETA ESTIMATION...................................................................................................................45
Estimation of Beta.....................................................................................................................45
CONCLUSION..............................................................................................................................46
REFERENCES..............................................................................................................................47
Document Page
INTRODUCTION
Investment management could be defined as the process of taking different types of
actions that are mainly focused with taking specific steps while planning to make investment. It
is very important for all the investors that they analyse the actual value of the entity before taking
any decision regarding making investment (Alkaraan, 2016). Present report is based upon
investment management of two companies of Malaysia which are operating business under
hospitality industry. These companies are Air Asia Airline and Perak Transit Berhad. Both of
them are operating under travel, leisure and hospitality industry of Malaysia and successfully
carrying out operational activities. Present report covers different topics such as return
construction of companies, asset pricing and beta estimations of both the entities.
RETURN CONSTRUCTION
Monthly data of Share price, Treasury bill and FBMKLSECI (Sultana, Zulkifli and Zainal,
2018).
Date
Monthly
share price
of Air Asia
Monthly share
price of Perak
Monthly
value of
treasury
bill FBMKLSECI
01-12-2016 2.73 0.1 4.38 1629
01-01-2017 2.29 0.1 4.23 1636
01-02-2017 2.44 0.103125 4.16 1672
01-03-2017 2.44 0.109375 4.12 1698
01-04-2017 3.12 0.1625 4.14 1745
01-05-2017 3.35 0.159375 4.02 1773
01-06-2017 2.98 0.175 3.88 1763
01-07-2017 3.25 0.196875 3.97 1762
01-08-2017 3.22 0.19375 4 1765
01-09-2017 3.32 0.225 3.92 1772
1
Document Page
01-10-2017 3.44 0.29 3.95 1760
01-11-2017 3.36 0.32 3.99 1744
01-12-2017 3.14 0.28 3.93 1718
01-01-2018 3.35 0.28 3.92 1793
01-02-2018 4.14 0.29 3.93 1870
01-03-2018 4.59 0.295 4.03 1861
01-04-2018 3.93 0.265 3.96 1851
01-05-2018 3.85 0.245 4.16 1852
01-06-2018 3.09 0.24 4.2 1755
01-07-2018 3 0.26 4.21 1685
01-08-2018 3.58 0.29 4.06 1778
01-09-2018 3.3 0.28 4.05 1814
01-10-2018 3.16 0.295 4.08 1798
01-11-2018 2.67 0.255 4.1 1709
01-12-2018 3.13 0.26 4.09 1700
01-01-2019 2.97 0.235 4.07 1668
01-02-2019 3.04 0.23 4.08 1684
01-03-2019 2.77 0.235 3.9 1701
01-04-2019 2.68 0.23 3.78 1644
01-05-2019 2.73 0.22 3.8 1632
01-06-2019 2.89 0.2 3.76 1655
01-07-2019 2.75 0.22 3.65 1684
01-08-2019 1.96 0.2 3.57 1639
01-09-2019 1.79 0.205 3.33 1592
01-10-2019 1.77 0.2 3.32 1575
2
tabler-icon-diamond-filled.svg

Paraphrase This Document

Need a fresh take? Get an instant paraphrase of this document with our AI Paraphraser
Document Page
01-11-2019 1.91 0.235 3.4 1593
01-12-2019 1.7 0.255 3.45 1562
01-01-2020 2.493 0.205 Forecasted
The above data is changed on the basis of daily data of the share price of both the
companies.
Line charts:
3
Document Page
Calculation of covariance and correlation:
Expected rate of return: Formula = ending value or price – starting value or price / starting
value or price * 100
Share of Air Asia: 2.49 – 2.73 / 2.49 * 100
= -0.3 / 2.49 *100
= -0.12 * 100
= -12%
Share of Perak: 0.205 – 0.1 / 0.205 * 100
= 0.105 / 0.205 * 100
= 0.51 *100
= 51%
Treasury Bill: 3.45 – 4.38 / 3.45 * 100
= -0.93 / 3.45 * 100
= -0.27 * 100
= -27%
FBMKLSECIS: 1562 – 1629 / 1562 * 100
= -67 / 1562 * 100
= -0.43 *100
4
Document Page
= -43%
Calculations of variances, standard deviation, covariance and correlation:
Variance 0.417 0.003 0.065 6771.688
Standard deviation 0.638 0.057 0.251 81.171
Covariance Between Airasia and
FBMKLSECI 47.756
Correlation between Airasia and
FBMKLSECI 0.917
Covariance Between Perak and
FBMKLSECI 1.436
Correlation Between Perak and
FBMKLSECI 0.353
Covariance between treasury bill and
FBMKLSECI 12.642
Correlation between treasury bill and
FBMKLSECI 0.649
Share price of Air Asia on daily basis from 01 December 2016 to 31st December 2019 (Share
price of Air Asia, 2019).
Date Airasia
01-12-2016 2.73
02-12-2016 2.7
05-12-2016 2.61
06-12-2016 2.59
07-12-2016 2.52
08-12-2016 2.54
09-12-2016 2.52
13-12-2016 2.56
14-12-2016 2.52
15-12-2016 2.51
16-12-2016 2.53
19-12-2016 2.49
20-12-2016 2.47
21-12-2016 2.4
5
tabler-icon-diamond-filled.svg

Paraphrase This Document

Need a fresh take? Get an instant paraphrase of this document with our AI Paraphraser
Document Page
22-12-2016 2.34
23-12-2016 2.35
27-12-2016 2.31
28-12-2016 2.22
29-12-2016 2.33
30-12-2016 2.29
02-01-2017 2.29
03-01-2017 2.3
04-01-2017 2.31
05-01-2017 2.22
06-01-2017 2.18
09-01-2017 2.23
10-01-2017 2.17
11-01-2017 2.18
12-01-2017 2.38
13-01-2017 2.5
16-01-2017 2.44
17-01-2017 2.44
18-01-2017 2.44
19-01-2017 2.44
20-01-2017 2.44
23-01-2017 2.44
24-01-2017 2.44
25-01-2017 2.44
26-01-2017 2.44
27-01-2017 2.44
31-01-2017 2.44
02-02-2017 2.44
03-02-2017 2.44
06-02-2017 2.44
07-02-2017 2.44
08-02-2017 2.44
10-02-2017 2.44
13-02-2017 2.44
14-02-2017 2.44
15-02-2017 2.44
16-02-2017 2.44
17-02-2017 2.44
20-02-2017 2.44
21-02-2017 2.44
22-02-2017 2.44
6
Document Page
23-02-2017 2.44
24-02-2017 2.44
27-02-2017 2.44
28-02-2017 2.44
01-03-2017 2.44
02-03-2017 2.44
03-03-2017 2.44
06-03-2017 2.44
07-03-2017 2.44
08-03-2017 2.44
09-03-2017 2.44
10-03-2017 2.44
13-03-2017 2.44
14-03-2017 2.44
15-03-2017 2.44
16-03-2017 2.44
17-03-2017 2.44
20-03-2017 2.44
21-03-2017 2.44
22-03-2017 2.44
23-03-2017 2.44
24-03-2017 2.44
27-03-2017 2.44
28-03-2017 2.44
29-03-2017 2.44
30-03-2017 2.44
31-03-2017 2.44
03-04-2017 3.12
04-04-2017 3.12
05-04-2017 3.14
06-04-2017 3.06
07-04-2017 3.11
10-04-2017 3.02
11-04-2017 3.08
12-04-2017 3.05
13-04-2017 3.05
14-04-2017 3.06
17-04-2017 3.05
18-04-2017 3.04
19-04-2017 3.13
20-04-2017 3.19
7
Document Page
21-04-2017 3.21
24-04-2017 3.24
25-04-2017 3.25
26-04-2017 3.28
27-04-2017 3.33
28-04-2017 3.32
02-05-2017 3.37
03-05-2017 3.39
04-05-2017 3.37
05-05-2017 3.35
08-05-2017 3.4
09-05-2017 3.41
11-05-2017 3.47
12-05-2017 3.48
15-05-2017 3.53
16-05-2017 3.58
17-05-2017 3.53
18-05-2017 3.43
19-05-2017 3.42
22-05-2017 3.5
23-05-2017 3.4
24-05-2017 3.2
25-05-2017 2.94
26-05-2017 3.13
29-05-2017 3.06
31-05-2017 2.94
01-06-2017 2.98
02-06-2017 3.1
05-06-2017 3.23
06-06-2017 3.3
07-06-2017 3.28
08-06-2017 3.38
09-06-2017 3.34
13-06-2017 3.31
14-06-2017 3.31
15-06-2017 3.4
16-06-2017 3.35
19-06-2017 3.27
20-06-2017 3.22
21-06-2017 3.17
22-06-2017 3.11
8
tabler-icon-diamond-filled.svg

Paraphrase This Document

Need a fresh take? Get an instant paraphrase of this document with our AI Paraphraser
Document Page
23-06-2017 3.16
26-06-2017 3.18
27-06-2017 3.18
28-06-2017 3.19
29-06-2017 3.18
30-06-2017 3.23
03-07-2017 3.25
04-07-2017 3.26
05-07-2017 3.2
06-07-2017 3.22
07-07-2017 3.15
10-07-2017 3.15
11-07-2017 3.16
12-07-2017 3.15
13-07-2017 3.15
14-07-2017 3.08
17-07-2017 3.08
18-07-2017 3.17
19-07-2017 3.28
20-07-2017 3.25
21-07-2017 3.25
24-07-2017 3.3
25-07-2017 3.26
26-07-2017 3.2
27-07-2017 3.15
28-07-2017 3.25
31-07-2017 3.28
01-08-2017 3.22
02-08-2017 3.2
03-08-2017 3.24
04-08-2017 3.26
07-08-2017 3.29
08-08-2017 3.3
09-08-2017 3.3
10-08-2017 3.3
11-08-2017 3.31
14-08-2017 3.24
15-08-2017 3.29
16-08-2017 3.3
17-08-2017 3.28
18-08-2017 3.24
9
Document Page
21-08-2017 3.25
22-08-2017 3.24
23-08-2017 3.26
24-08-2017 3.3
25-08-2017 3.29
28-08-2017 3.29
29-08-2017 3.31
30-08-2017 3.24
31-08-2017 3.32
01-09-2017 3.32
04-09-2017 3.32
05-09-2017 3.31
06-09-2017 3.35
07-09-2017 3.4
08-09-2017 3.4
11-09-2017 3.54
12-09-2017 3.5
13-09-2017 3.34
14-09-2017 3.4
15-09-2017 3.41
18-09-2017 3.41
19-09-2017 3.49
20-09-2017 3.5
21-09-2017 3.47
22-09-2017 3.41
25-09-2017 3.44
26-09-2017 3.53
27-09-2017 3.42
28-09-2017 3.43
29-09-2017 3.46
02-10-2017 3.44
03-10-2017 3.43
04-10-2017 3.46
05-10-2017 3.45
06-10-2017 3.42
09-10-2017 3.45
10-10-2017 3.43
11-10-2017 3.4
12-10-2017 3.41
13-10-2017 3.43
16-10-2017 3.48
10
chevron_up_icon
1 out of 47
circle_padding
hide_on_mobile
zoom_out_icon
[object Object]