ACC202 Management Accounting: Group Assignment Report, Trimester 1

Verified

Added on  2023/06/11

|11
|1745
|116
Report
AI Summary
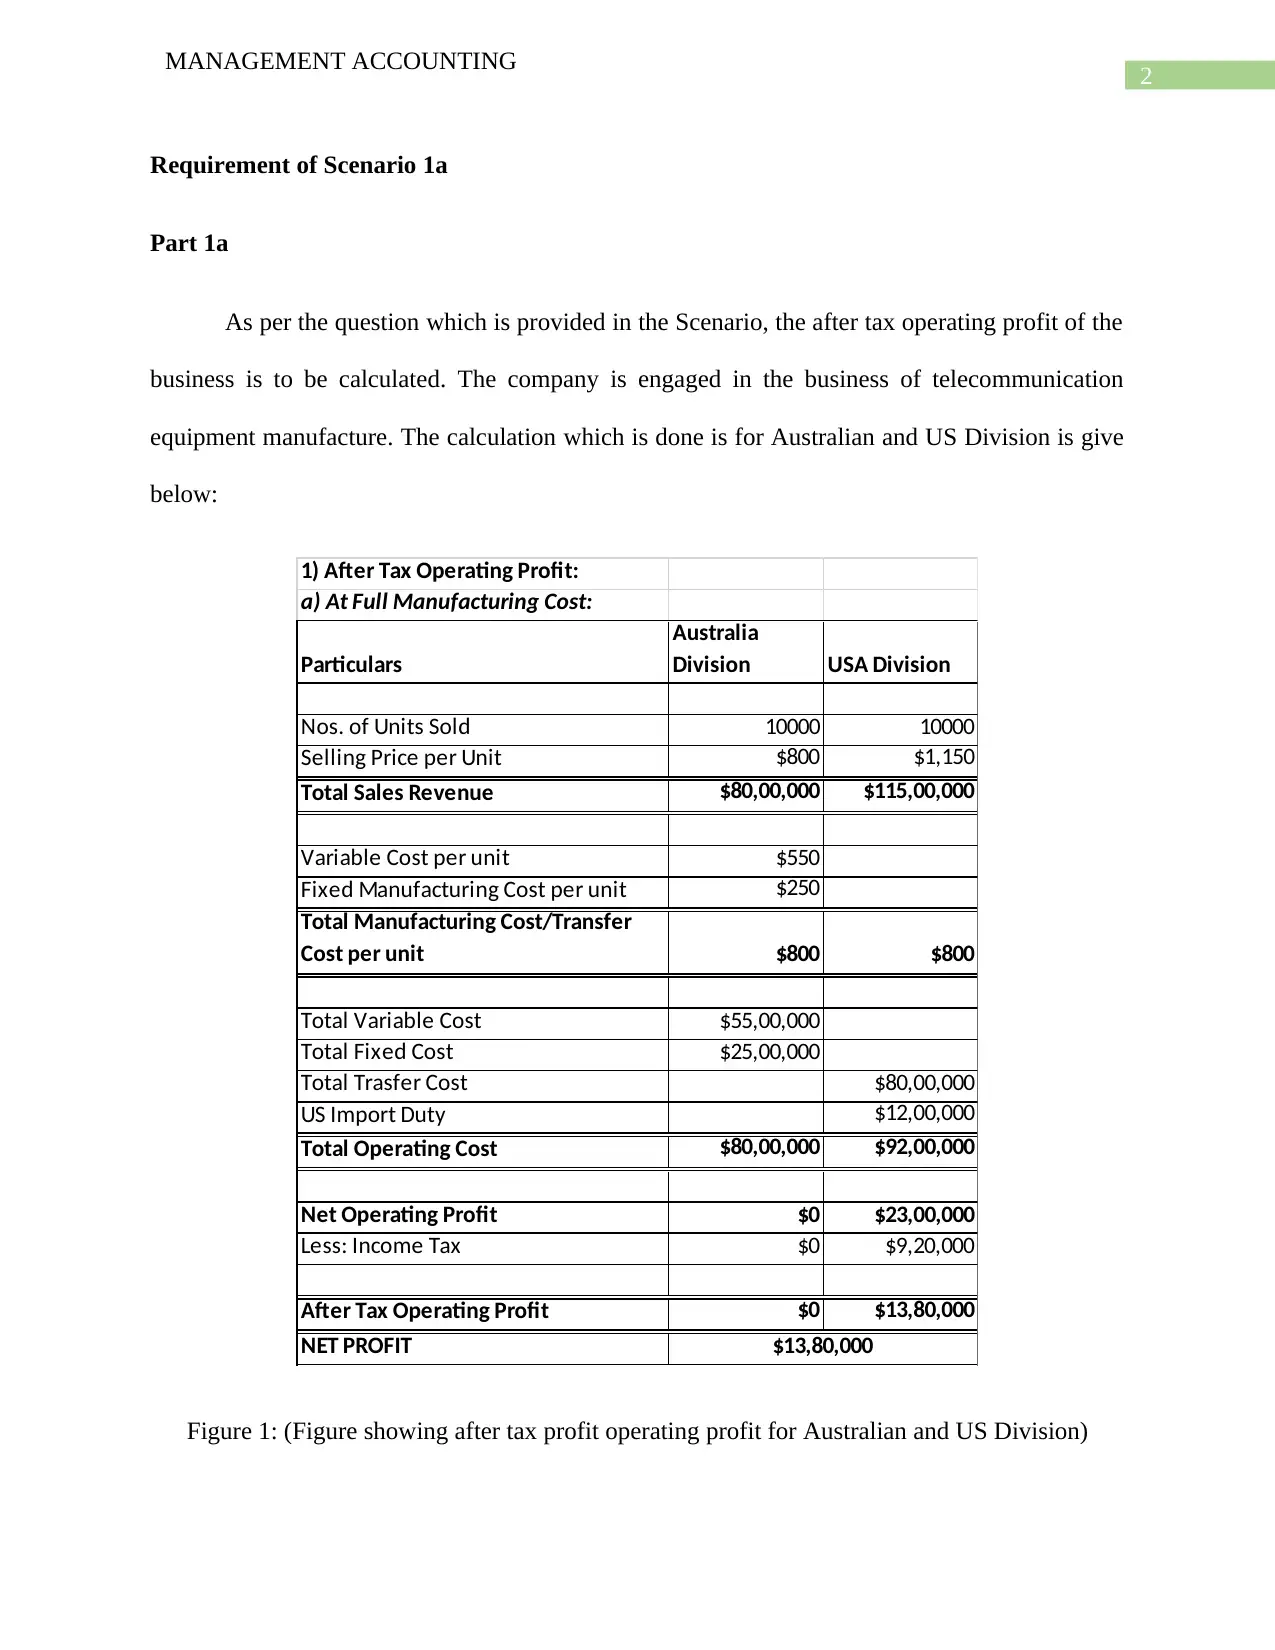
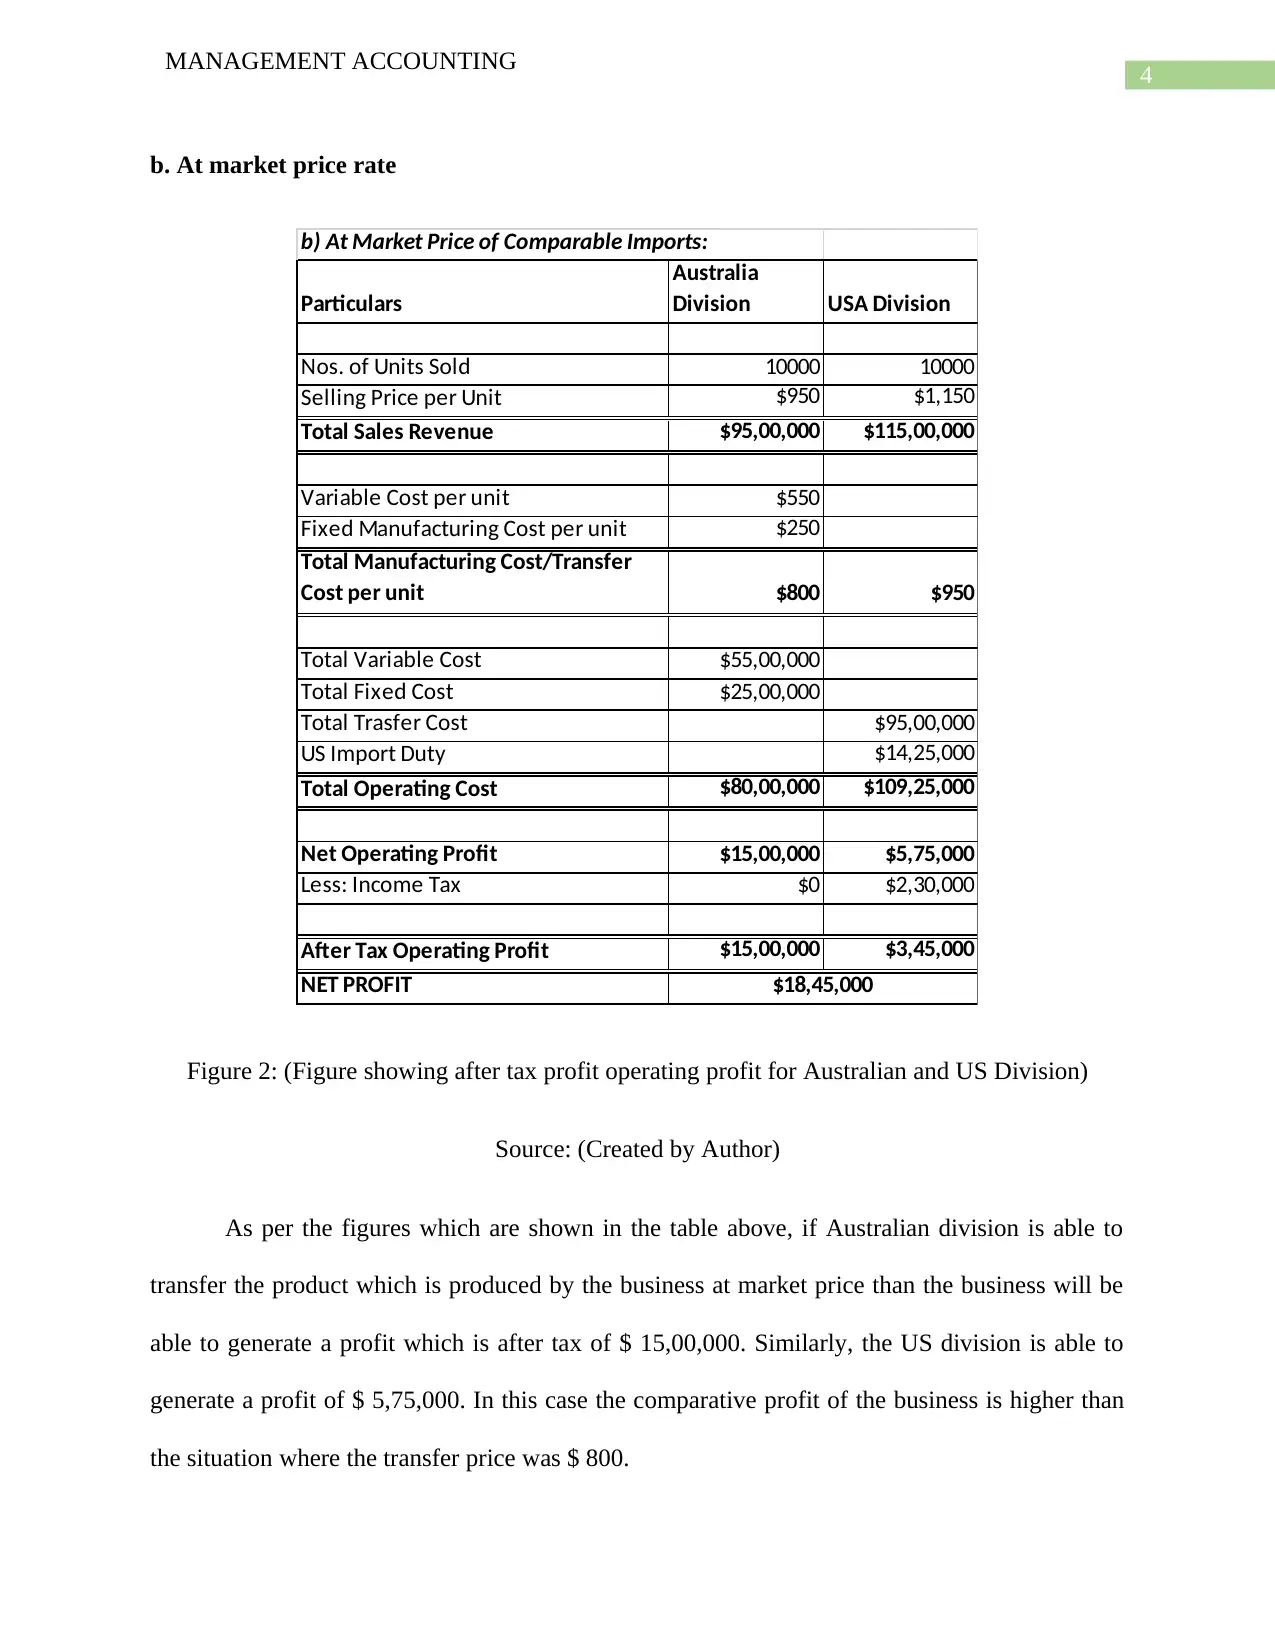
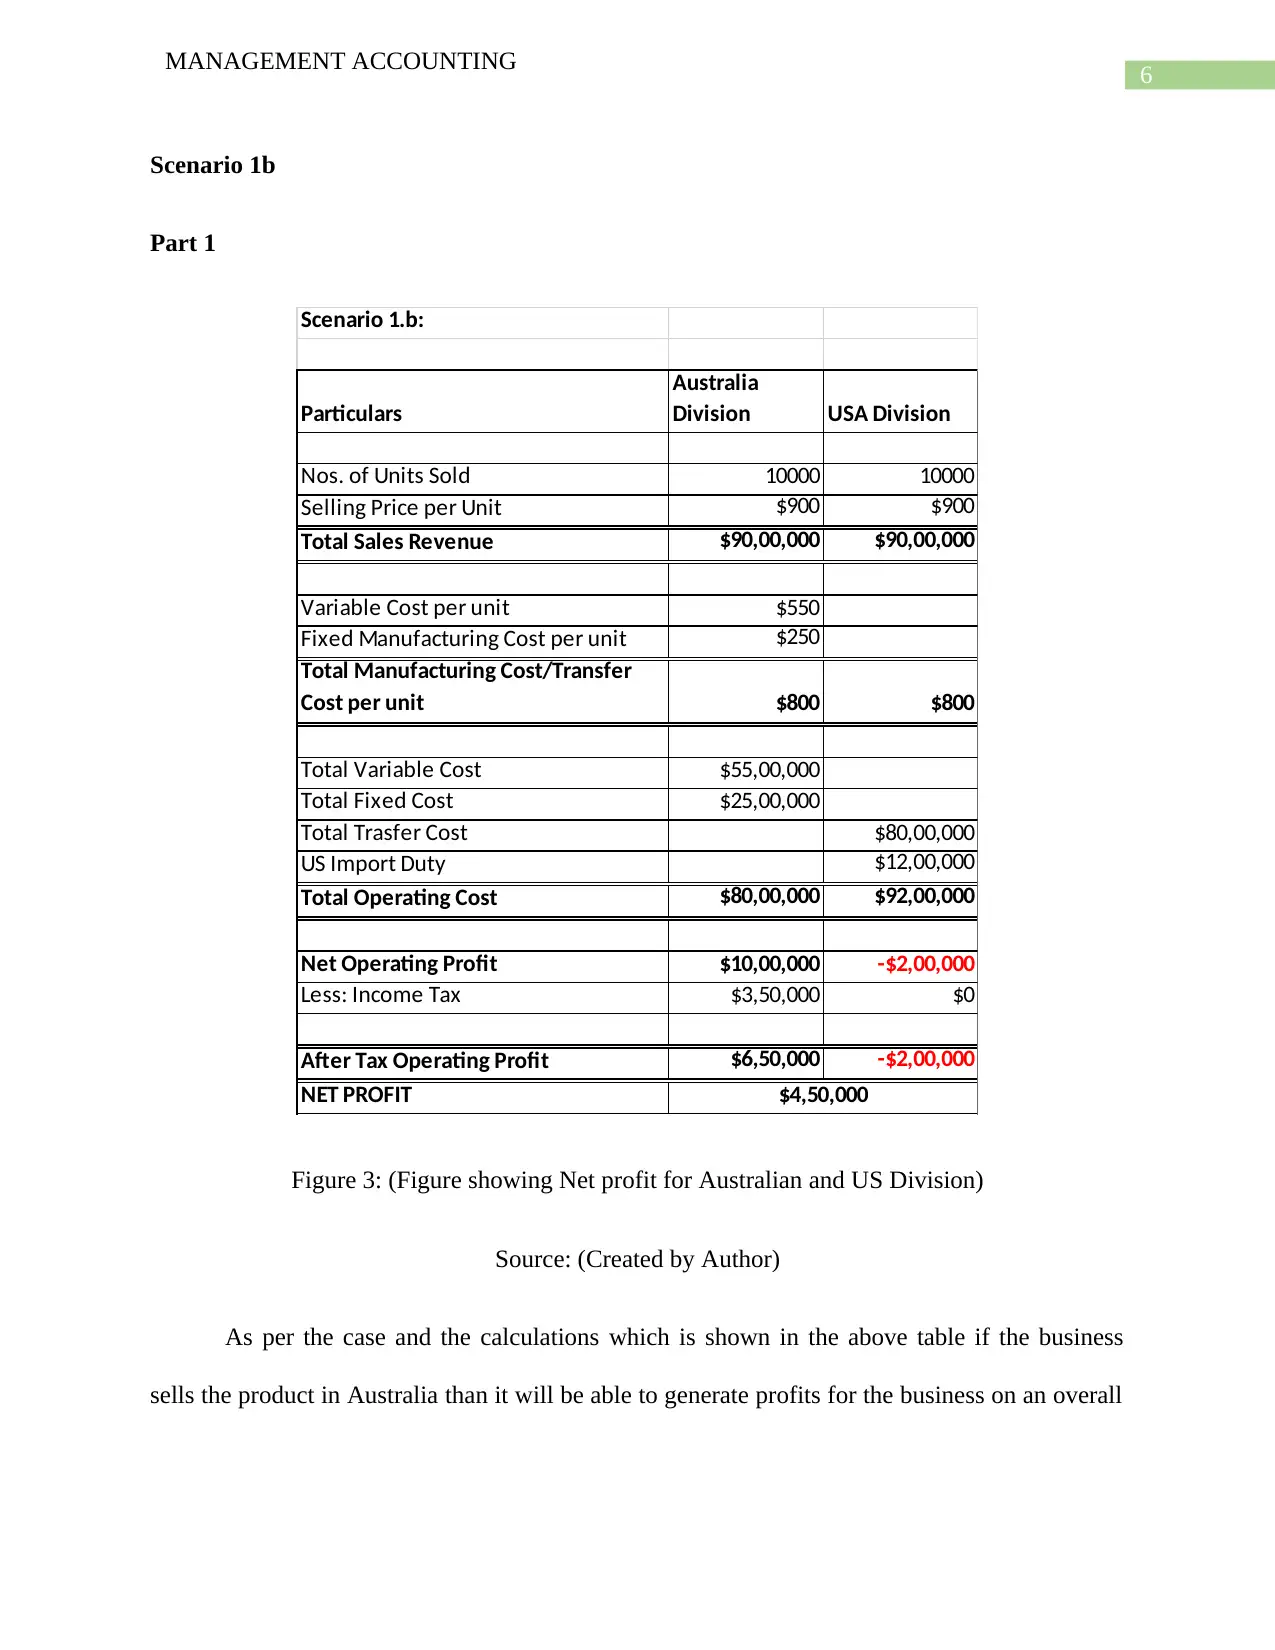
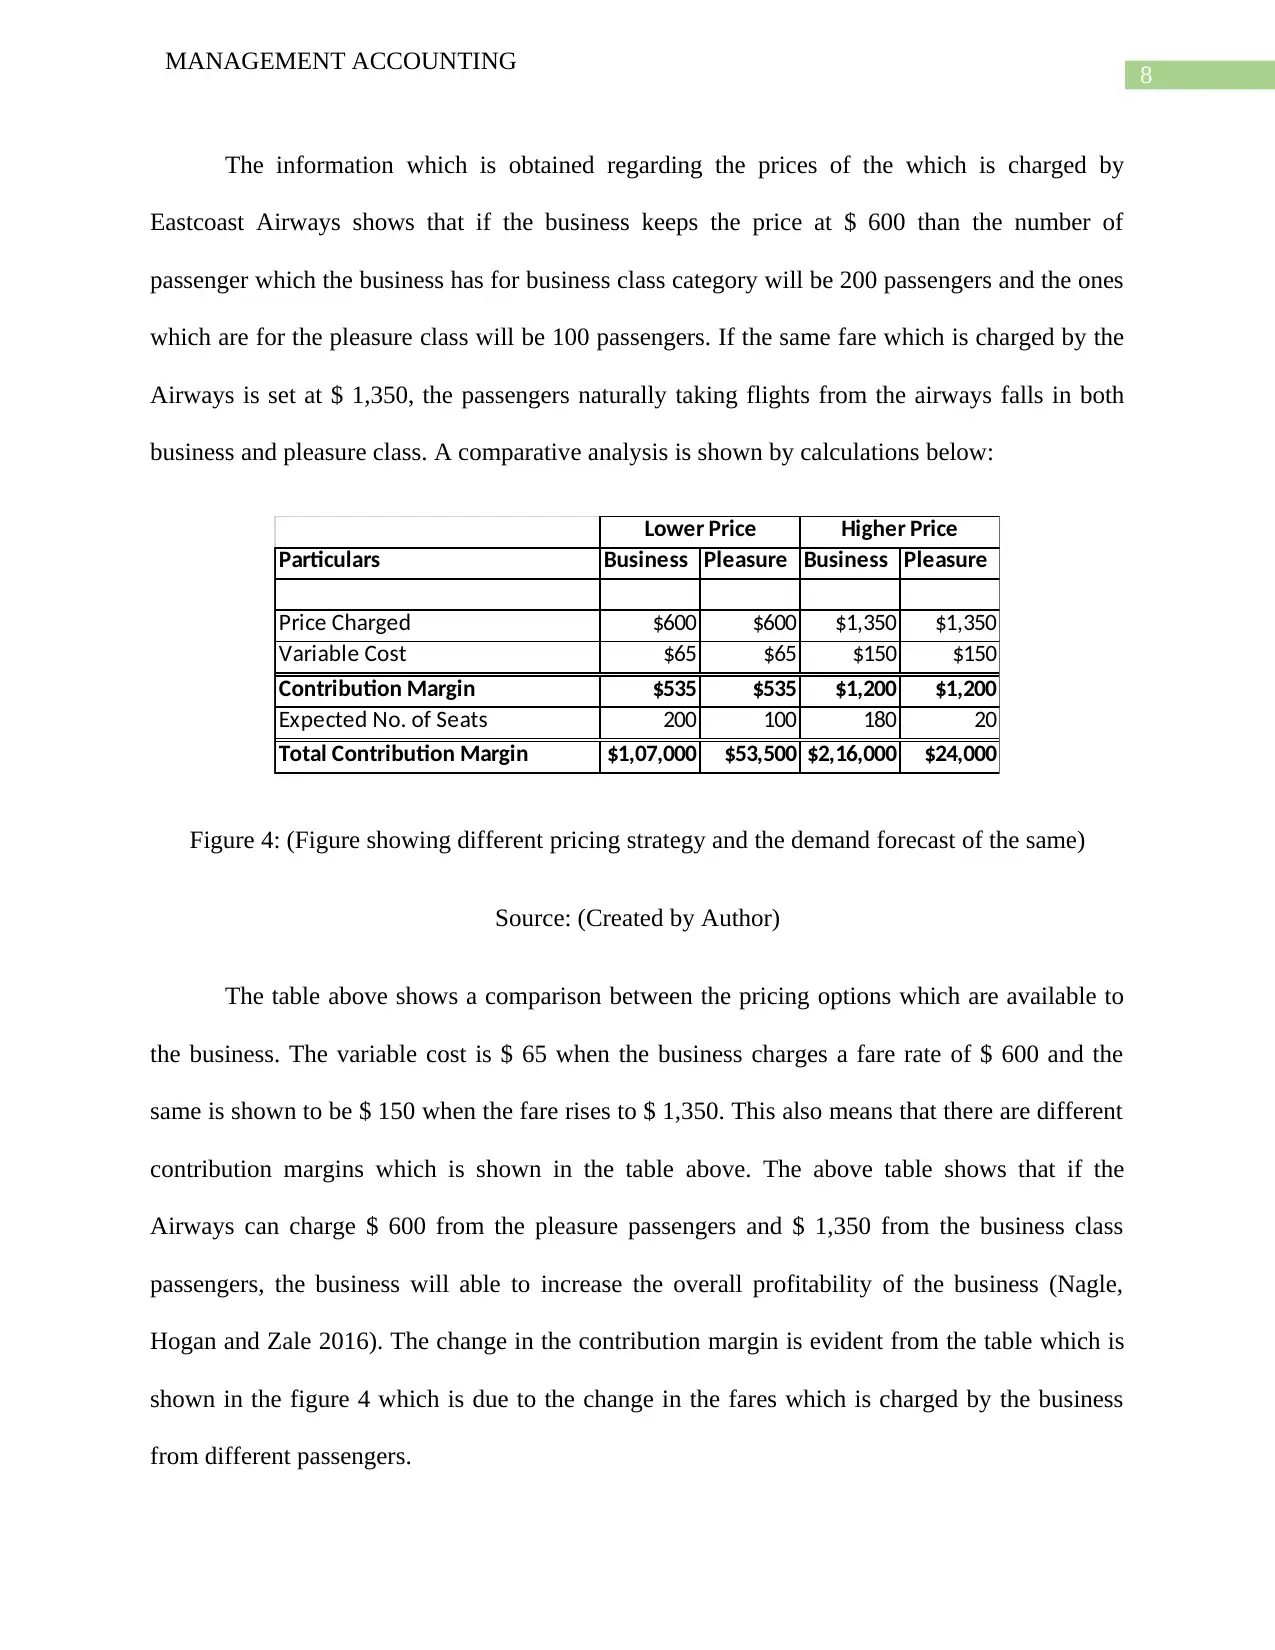
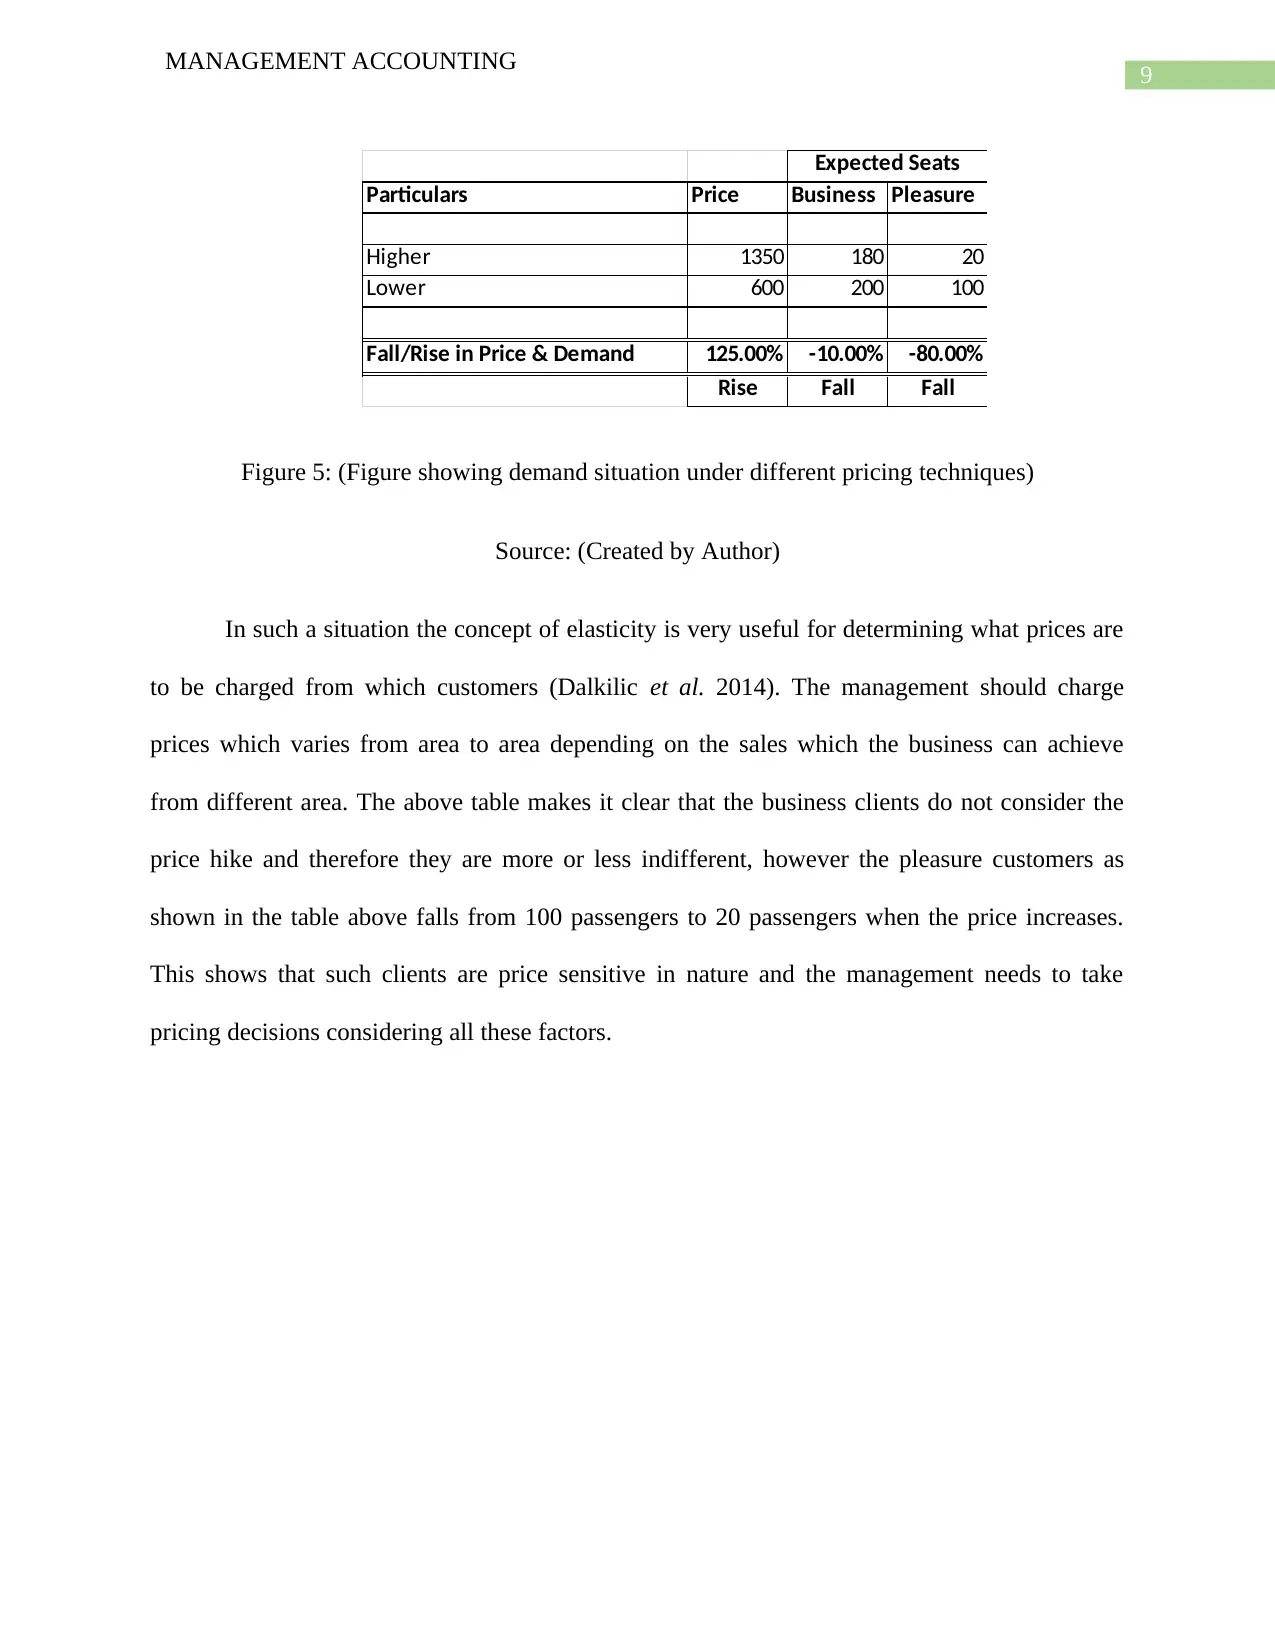
This management accounting report for ACC202 examines transfer pricing strategies, profit calculations, and pricing decisions within a business context. It analyzes scenarios involving an Australian and US division, evaluating after-tax operating profits under different transfer pricing methods, including full manufacturing cost and market price rates. The report also assesses the impact of import duties and income taxes on profitability. Furthermore, it explores airline pricing strategies, comparing the profitability of business and pleasure class fares, and applies the concept of elasticity to optimize pricing decisions. The document provides detailed calculations and recommendations for maximizing profitability in various business scenarios. Desklib offers a wealth of similar solved assignments and past papers for students.
Document Page
Running head: MANAGEMENT ACCOUNTING
Management Accounting
Name of the Student:
Name of the University:
Author’s Note:
tabler-icon-diamond-filled.svg

Secure Best Marks with AI Grader

Need help grading? Try our AI Grader for instant feedback on your assignments.
Document Page
1
MANAGEMENT ACCOUNTING
Table of Contents
Requirement of Scenario 1a.............................................................................................................2
Part 1a..........................................................................................................................................2
b. At market price rate.................................................................................................................4
Part 2............................................................................................................................................5
Scenario 1b......................................................................................................................................6
Part 1............................................................................................................................................6
Part 2............................................................................................................................................7
Part 3............................................................................................................................................7
Scenario 2........................................................................................................................................7
Reference.......................................................................................................................................10
Document Page
2
MANAGEMENT ACCOUNTING
Requirement of Scenario 1a
Part 1a
As per the question which is provided in the Scenario, the after tax operating profit of the
business is to be calculated. The company is engaged in the business of telecommunication
equipment manufacture. The calculation which is done is for Australian and US Division is give
below:
1) After Tax Operating Profit:
a) At Full Manufacturing Cost:
Particulars
Australia
Division USA Division
Nos. of Units Sold 10000 10000
Selling Price per Unit $800 $1,150
Total Sales Revenue $80,00,000 $115,00,000
Variable Cost per unit $550
Fixed Manufacturing Cost per unit $250
Total Manufacturing Cost/Transfer
Cost per unit $800 $800
Total Variable Cost $55,00,000
Total Fixed Cost $25,00,000
Total Trasfer Cost $80,00,000
US Import Duty $12,00,000
Total Operating Cost $80,00,000 $92,00,000
Net Operating Profit $0 $23,00,000
Less: Income Tax $0 $9,20,000
After Tax Operating Profit $0 $13,80,000
NET PROFIT $13,80,000
Figure 1: (Figure showing after tax profit operating profit for Australian and US Division)
Document Page
3
MANAGEMENT ACCOUNTING
Source: (Created by Author)
As per the calculations which is shown above, the business has two divisions which are
Australian Division and Us Division. As per the above computation, Australian division sells
B12 product at a transfer price which is equal to the rate of $ 800 and the same is shown to be
made up of variable and fixed expense (Rugman and Eden 2017). The Australian division is
unable to generate any profits for the period due to the costs of the business is equal to the sales
which the business is able to generate. In the case of US division, the selling price of the product
is set as $ 1,150 for which the business is able to generate profits of $ 13,80,000.
tabler-icon-diamond-filled.svg

Secure Best Marks with AI Grader

Need help grading? Try our AI Grader for instant feedback on your assignments.
Document Page
4
MANAGEMENT ACCOUNTING
b. At market price rate
b) At Market Price of Comparable Imports:
Particulars
Australia
Division USA Division
Nos. of Units Sold 10000 10000
Selling Price per Unit $950 $1,150
Total Sales Revenue $95,00,000 $115,00,000
Variable Cost per unit $550
Fixed Manufacturing Cost per unit $250
Total Manufacturing Cost/Transfer
Cost per unit $800 $950
Total Variable Cost $55,00,000
Total Fixed Cost $25,00,000
Total Trasfer Cost $95,00,000
US Import Duty $14,25,000
Total Operating Cost $80,00,000 $109,25,000
Net Operating Profit $15,00,000 $5,75,000
Less: Income Tax $0 $2,30,000
After Tax Operating Profit $15,00,000 $3,45,000
NET PROFIT $18,45,000
Figure 2: (Figure showing after tax profit operating profit for Australian and US Division)
Source: (Created by Author)
As per the figures which are shown in the table above, if Australian division is able to
transfer the product which is produced by the business at market price than the business will be
able to generate a profit which is after tax of $ 15,00,000. Similarly, the US division is able to
generate a profit of $ 5,75,000. In this case the comparative profit of the business is higher than
the situation where the transfer price was $ 800.
Document Page
5
MANAGEMENT ACCOUNTING
Part 2
As per the figures which are shown in the table above, the import duty and income tax
expenses of the business is lower when the transfer price is lower than the comparative market
rate. Hence it can clearly be justified that Derwent ltd should selected the market transfer pricing
option which is shown to be $ 1,150 as the net income tax charged and the important duty on the
goods are the lowest in this case (Cecchini, Leitch and Strobel 2013).
Document Page
6
MANAGEMENT ACCOUNTING
Scenario 1b
Part 1
Scenario 1.b:
Particulars
Australia
Division USA Division
Nos. of Units Sold 10000 10000
Selling Price per Unit $900 $900
Total Sales Revenue $90,00,000 $90,00,000
Variable Cost per unit $550
Fixed Manufacturing Cost per unit $250
Total Manufacturing Cost/Transfer
Cost per unit $800 $800
Total Variable Cost $55,00,000
Total Fixed Cost $25,00,000
Total Trasfer Cost $80,00,000
US Import Duty $12,00,000
Total Operating Cost $80,00,000 $92,00,000
Net Operating Profit $10,00,000 -$2,00,000
Less: Income Tax $3,50,000 $0
After Tax Operating Profit $6,50,000 -$2,00,000
NET PROFIT $4,50,000
Figure 3: (Figure showing Net profit for Australian and US Division)
Source: (Created by Author)
As per the case and the calculations which is shown in the above table if the business
sells the product in Australia than it will be able to generate profits for the business on an overall
tabler-icon-diamond-filled.svg

Paraphrase This Document

Need a fresh take? Get an instant paraphrase of this document with our AI Paraphraser
Document Page
7
MANAGEMENT ACCOUNTING
basis. The US division on the other hand will be incurring losses which can be mainly attributed
to the transfer cost of the division.
Part 2
The profits of the Australian division can be maximized if the departmental manager
makes the correct decision of transferring the product to the US division at a market price rate
which is shown to be $ 1,150. This decision needs to be taken by the departmental manager of
the division so that the profitability of the division can be increased.
Part 3
The transfer price which the manager of division Australia will be considering as
efficient is $ 900 as shown in figure 3 above. The business is able to generate a profit of $
6,50,000 if the business transfers the product at such a rate. The import duty and the income tax
expenses which the business incurs under this rate is shown as $ 15,50,000 which is lower than
what the business will be incurring if the transfer price was set at the price of $ 950 which will
bring about a combined expense of $ 16,55,000.
Scenario 2
To,
The Directors of Eastcoast Airways,
Date: 17/05/2018
Subject: Airline pricing strategy
Document Page
8
MANAGEMENT ACCOUNTING
The information which is obtained regarding the prices of the which is charged by
Eastcoast Airways shows that if the business keeps the price at $ 600 than the number of
passenger which the business has for business class category will be 200 passengers and the ones
which are for the pleasure class will be 100 passengers. If the same fare which is charged by the
Airways is set at $ 1,350, the passengers naturally taking flights from the airways falls in both
business and pleasure class. A comparative analysis is shown by calculations below:
Particulars Business Pleasure Business Pleasure
Price Charged $600 $600 $1,350 $1,350
Variable Cost $65 $65 $150 $150
Contribution Margin $535 $535 $1,200 $1,200
Expected No. of Seats 200 100 180 20
Total Contribution Margin $1,07,000 $53,500 $2,16,000 $24,000
Lower Price Higher Price
Figure 4: (Figure showing different pricing strategy and the demand forecast of the same)
Source: (Created by Author)
The table above shows a comparison between the pricing options which are available to
the business. The variable cost is $ 65 when the business charges a fare rate of $ 600 and the
same is shown to be $ 150 when the fare rises to $ 1,350. This also means that there are different
contribution margins which is shown in the table above. The above table shows that if the
Airways can charge $ 600 from the pleasure passengers and $ 1,350 from the business class
passengers, the business will able to increase the overall profitability of the business (Nagle,
Hogan and Zale 2016). The change in the contribution margin is evident from the table which is
shown in the figure 4 which is due to the change in the fares which is charged by the business
from different passengers.
Document Page
9
MANAGEMENT ACCOUNTING
Particulars Price Business Pleasure
Higher 1350 180 20
Lower 600 200 100
Fall/Rise in Price & Demand 125.00% -10.00% -80.00%
Rise Fall Fall
Expected Seats
Figure 5: (Figure showing demand situation under different pricing techniques)
Source: (Created by Author)
In such a situation the concept of elasticity is very useful for determining what prices are
to be charged from which customers (Dalkilic et al. 2014). The management should charge
prices which varies from area to area depending on the sales which the business can achieve
from different area. The above table makes it clear that the business clients do not consider the
price hike and therefore they are more or less indifferent, however the pleasure customers as
shown in the table above falls from 100 passengers to 20 passengers when the price increases.
This shows that such clients are price sensitive in nature and the management needs to take
pricing decisions considering all these factors.
tabler-icon-diamond-filled.svg

Secure Best Marks with AI Grader

Need help grading? Try our AI Grader for instant feedback on your assignments.
Document Page
10
MANAGEMENT ACCOUNTING
Reference
Cecchini, M., Leitch, R. and Strobel, C., 2013. Multinational transfer pricing: A transaction cost
and resource based view. Journal of Accounting Literature, 31(1), pp.31-48.
Dalkilic, O., Tadrous, J., Eryilmaz, A. and ElGamal, H., 2014. Pricing under demand flexibility
and predictability. Smart Data Pricing, pp.67-95.
Nagle, T.T., Hogan, J. and Zale, J., 2016. The Strategy and Tactics of Pricing: New
International Edition. Routledge.
Rugman, A.M. and Eden, L. eds., 2017. Multinationals and transfer pricing. Routledge.
chevron_up_icon
1 out of 11
circle_padding
hide_on_mobile
zoom_out_icon
[object Object]