ACC203 Assignment: Cost Analysis and Journal Entries for Cool Brew Ltd
VerifiedAdded on 2023/05/30
|7
|1241
|475
Homework Assignment
AI Summary
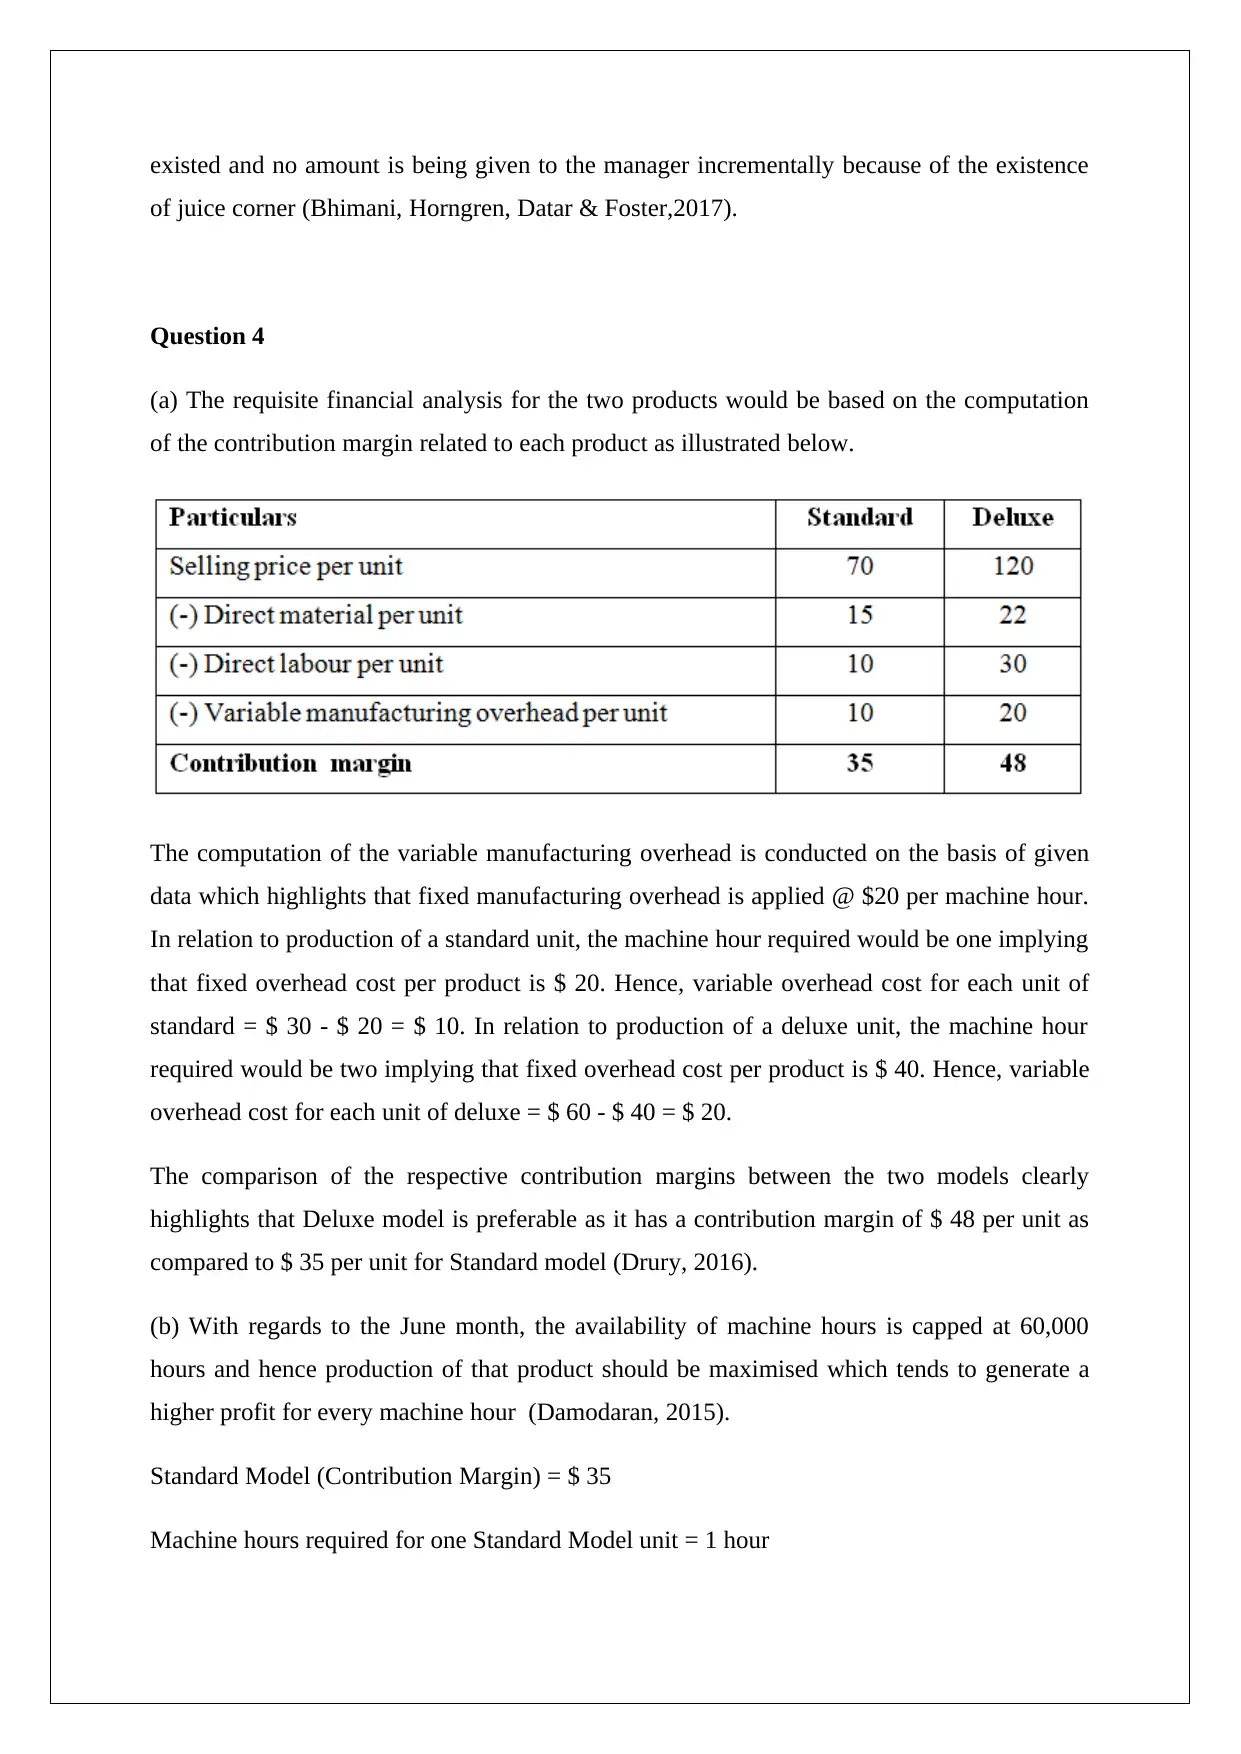
This assignment solution provides a comprehensive analysis of Cool Brew Ltd's production costs, covering key areas such as cost per bottle calculation, journal entries for production costs, and variance analysis. The solution meticulously calculates total production costs, cost per bottle, and prepares the necessary journal entries for the mixing and bottling departments. Furthermore, the solution delves into variance analysis, calculating direct material price and usage variances, direct labor rate and efficiency variances, and provides a financial analysis of a fruit juice corner scenario. The assignment also addresses product profitability, determining the optimal production mix to maximize profit given limited machine hours, comparing contribution margins and recommending production strategies based on machine hour constraints. References to relevant accounting literature are included to support the analysis.

MANAGEMENT ACCOUNTING
STUDENT ID:
[Pick the date]
STUDENT ID:
[Pick the date]
Paraphrase This Document
Need a fresh take? Get an instant paraphrase of this document with our AI Paraphraser

Question 1
a) Based on the given information, it is apparent that total cost incurred would be the sum
total of costs incurred during mixing and bottling.
Total costs incurred in mixing department (March 2013) = 113000 + 15000 + 32000 = $
160,000
Total costs incurred in bottling department (March 2013) = 17000 + 6000 + 9000 = $ 32,000
Total production costs incurred (March 2013) = 160,000 + 32,000 = $ 192,000
Total production quantity (March 2013) = 160,000 bottles
Cost per bottle for Cool Bay Draught = (192000/160000) = $ 1.2
b) The requisite journal entries are indicated below (Drury, 2016).

Question 2
The objective of this task is to compute selected variances based on the data provided.
a) The requisite formula is indicated below (Damodaran, 2015).
Direct material price variance = (Standard Unit Price – Actual Unit Price)*Actual quantity
used
As per the information provided, standard unit price = $ 7.2/kg, actual unit price = $ 7.4/kg,
actual quantity = (31080/7.4) = 4200 kg
Hence, direct material price variance = (7.2-7.4)*4200 = -$ 840
Since the actual price exceeds the budgeted price, hence the variance is unfavourable.
b) The requisite formula is indicated below (Bhimani, Horngren, Datar & Foster,2017).
Direct material usage variance – (Actual quantity – Standard quantity)*Standard Price
As per the information provided, actual quantity = (31080/7.4) = 4200 kg, standard quantity =
2000*2 = 4000 kg, standard unit price = $ 7.2/kg
Hence, direct material usage variance = (4200-4000)*7.2 = $ 1,440
Since the actual material consumed is greater than the expected material consumption, hence
the above variance is unfavourable.
c) The requisite formula is indicated below (Drury, 2016).
Direct labour rate variance = (Actual Rate – Standard Rate)*Actual Hours
As per the information provided, actual rate = $ 18.30 per hour, standard rate = $ 18 per hour,
actual hours = (118035/18.3) = 6450 hours
Hence, direct labour rate variance = (18.3-18)*6450 = $ 1,935
Since the actual labour rate exceeds the standard labour rate, hence the given variance is
unfavourable.
⊘ This is a preview!⊘
Do you want full access?
Subscribe today to unlock all pages.

Trusted by 1+ million students worldwide

d) The requisite formula is indicated below (Brealey, Myers & Allen, 2014).
Direct labour efficiency variance = (Actual hours – Standard hours)*Standard Rate
As per the information provided, actual hours = (118035/18.3) = 6450 hours, standard hours
= 2000*3.5 = 7000 hours, Standard Rate = $ 18/hour
Hence, direct labour efficiency variance = (6450-7000)*18 = -$9,900
Since the actual direct labour consumption is lesser than the budgeted labour, hence the given
variance is favourable.
Question 3
a) The financial analysis done by Sam is not correct as it has taken into consideration certain
costs which are not categorised as incremental cost and hence were spent even before the
fruit juice corner started operating. The financial analysis needs to be limited only to the costs
& benefits which have come into existence because of the juice corner operations
(Damdoaran, 2015).
b) The appropriate financial analysis for the fruit juice corner has been conducted as
highlighted below.
One of the key items that has not been considered for the above analysis is building
depreciation as there would not be any change in the same due to operations of juice counter.
Utilities have been considered since juice corner would consumer some extra utilities for its
operations. Additionally, the salary of the manager has not been included as it previously also
Paraphrase This Document
Need a fresh take? Get an instant paraphrase of this document with our AI Paraphraser

existed and no amount is being given to the manager incrementally because of the existence
of juice corner (Bhimani, Horngren, Datar & Foster,2017).
Question 4
(a) The requisite financial analysis for the two products would be based on the computation
of the contribution margin related to each product as illustrated below.
The computation of the variable manufacturing overhead is conducted on the basis of given
data which highlights that fixed manufacturing overhead is applied @ $20 per machine hour.
In relation to production of a standard unit, the machine hour required would be one implying
that fixed overhead cost per product is $ 20. Hence, variable overhead cost for each unit of
standard = $ 30 - $ 20 = $ 10. In relation to production of a deluxe unit, the machine hour
required would be two implying that fixed overhead cost per product is $ 40. Hence, variable
overhead cost for each unit of deluxe = $ 60 - $ 40 = $ 20.
The comparison of the respective contribution margins between the two models clearly
highlights that Deluxe model is preferable as it has a contribution margin of $ 48 per unit as
compared to $ 35 per unit for Standard model (Drury, 2016).
(b) With regards to the June month, the availability of machine hours is capped at 60,000
hours and hence production of that product should be maximised which tends to generate a
higher profit for every machine hour (Damodaran, 2015).
Standard Model (Contribution Margin) = $ 35
Machine hours required for one Standard Model unit = 1 hour

Standard Model (Contribution margin for each machine hour) = 35/1 = $ 35
Deluxe Model (Contribution Margin) = $ 48
Machine hours required for one Deluxe Model unit = 2 hour
Deluxe Model (Contribution margin for each machine hour) = 48/2 = $ 24
The computation above clearly reflects on the standard model being better for maximising the
profit under a condition where machine hours are limited.
Standard Model (Total Demand) = 40,000 units
Machine hours required for satisfying the complete demand of 40000 units = 40000*1 =-
40000 hours
Remaining machine hours = 60000-40000 – 20,000 hours
Deluxe Model (Units produced in June) = 20000/2 = 10,000 units
The above computation implies that for profit maximisation in June, 10000 deluxe model
units and 40000 standard model units should be produced.
⊘ This is a preview!⊘
Do you want full access?
Subscribe today to unlock all pages.

Trusted by 1+ million students worldwide

References
Bhimani, A., Horngren, C.T., Datar, S.M. & Foster, G. (2017), Management and Cost
Accounting 4th ed. Harlow: Prentice Hall/Financial Times
Brealey, R. A., Myers, S. C. & Allen, F. (2014) Principles of corporate finance, 6th ed. New
York: McGraw-Hill Publications
Damodaran, A. (2015). Applied corporate finance: A user’s manual 3rd ed. New York:
Wiley, John & Sons.
Drury, C. (2016) Cost and Management Accounting: An Introduction. 6th ed. New York:
Cengage Learning
1 out of 7
Related Documents
Your All-in-One AI-Powered Toolkit for Academic Success.
+13062052269
info@desklib.com
Available 24*7 on WhatsApp / Email
Unlock your academic potential
Copyright © 2020–2025 A2Z Services. All Rights Reserved. Developed and managed by ZUCOL.


