Management Accounting Report: Cost Analysis, Variance and Budgeting
VerifiedAdded on 2020/01/21
|18
|5478
|75
Report
AI Summary
This report provides a comprehensive analysis of management accounting techniques. It begins with a classification of costs based on their nature, including direct and indirect costs, and then delves into the calculation of unit costs. The report uses absorption costing to determine overhead absorption rates and prepares detailed cost sheets. Variance analysis is performed to compare budgeted and actual costs, identifying areas for improvement. The report also covers budgeting processes, including material purchase and production budgets, and the preparation of a cash budget. The report concludes with an analysis of variance and recommendations for corrective actions, along with an exploration of management findings in accordance with responsibility centers. The report includes detailed tables and interpretations to support the findings and recommendations. The report also includes various performance indicators to reduce cost and enhance value and quality.
MANAGEMENT
ACCOUNTING
ACCOUNTING
Paraphrase This Document
Need a fresh take? Get an instant paraphrase of this document with our AI Paraphraser
TABLE OF CONTENTS
INTRODUCTION...........................................................................................................................1
TASK 1............................................................................................................................................1
1.1 Classification of cost on the basis of nature.....................................................................1
1.2 Calculation of unit cost.....................................................................................................2
1.3 Calculation of the cost by using absorption costing technique........................................2
1.4 Calculation of overhead absorption rate using direct labor hours....................................4
TASK 2............................................................................................................................................5
2.1 Preparation of cost sheet and variance analysis...............................................................5
2.2 Various performance indicators used to identify the areas of potential improvements...6
2.3 Ways to reduce cost, enhancing value and quality...........................................................7
TASK 3............................................................................................................................................8
3.1 Nature and purpose of budgeting process........................................................................8
3.2 Appropriate budgeting method for the organization and its need....................................9
3.3 Material purchase budget and production requirement budget........................................9
3.4 preparation of cash budget..............................................................................................10
TASK 4..........................................................................................................................................11
4.1, 4.2 Variance analysis and recommendation corrective actions.....................................11
4.3 Findings of management in accordance with responsibility centers..............................13
CONCLCUSION...........................................................................................................................13
REFERENCES..............................................................................................................................14
INDEX OF TABLES
Table 1: Calculation of total cost and per unit cost for a job...........................................................2
Table 2: Calculation of overhead absorption rate using direct labor hours.....................................4
Table 3: Preparation of budgeted and actual cost (In £)..................................................................5
Table 4: Variance analysis...............................................................................................................5
Table 5: Production budget for July, August and September (In Units).........................................9
Table 6: Material purchase budget (In Kg)....................................................................................10
Table 7: preparation of Cash budget..............................................................................................10
Table 8: Calculation of budgeted cost for 4000 units....................................................................11
Table 9: Operating statement reconciling both budgeted and actual results.................................11
Table 10: Calculation of per unit variances...................................................................................12
⊘ This is a preview!⊘
Do you want full access?
Subscribe today to unlock all pages.
Trusted by 1+ million students worldwide
INTRODUCTION
Cost play an important role in growth of an organization's because it is cost by paying
which firm earn revenue. All issues related to cost are handled by using management accounting
technique. In the report all methods of management accounting are used. In the report costs are
classified and they are explained in detail in the report. Apart from this, in the report budget is
also given and necessary comments are made on same in the report. At the end of the report,
variance analysis is done and actual results are compared with the budgeted results in order to
identify variance in the company performance. After that results are also interpreted in proper
manner. At the end of the report, responsibility centers are also explained in detail in the report.
TASK 1
1.1 Classification of cost on the basis of nature
Following are the categories in which costs are classified. Elements of cost- There are three elements of cost namely material, labor and overhead
cost. Material cost refers to the cost which is incurred in purchasing raw material from
suppliers. On other hand, labor cost refers to the wages that are paid to the employees for
their involvement in production process. Overhead refers to the indirect expenses that are
incurred in relation to the production of goods and services (Kaplan and Atkinson, 2015).
All these costs are combined in order to identify per unit cost of the product. Function- Function refers to the costs that are related to various departments that are
operating in Jeffrey and sons. With expansion in activities of the departments, costs of an
organization also increase. Hence, firm is required to take some steps in order to make
sure that expenses will remain in control. Nature- On the basis of nature, cost can be divided into various parts like direct and
indirect cost. Direct cost refers to the expenses which are directly related to the
production of goods and services. Example of direct expenses is labor and material cost
(Zimmerman and Yahya-Zadeh, 2011). On the other hand, indirect expenses refer to the
expenses that are indirectly related to the production of goods. Examples of indirect cost
are carriage expenses etc.
Behavior- From the behavior point of view, cost can be divided into three parts fixed,
variable and semi variable cost. Fixed cost refers to the cost that never changes during
lifetime of the company. Plant and machinery expenses are the best example of fixed
1 | P a g e
Paraphrase This Document
Need a fresh take? Get an instant paraphrase of this document with our AI Paraphraser

cost. Whereas, variable cost refers to the cost that keeps on changing steadily with the
change in level of production (Herman, 2011). Raw material cost is an example of
indirect cost. The last category of cost is semi variable cost and it is a cost whose some
part remain fixed and some remain variable. Hence, it can be said that all costs fall in this
category.
1.2 Calculation of unit cost
Unit cost refers to per unit cost that is computed by dividing aggregate value by number
of units (Baldvinsdottir, Mitchell and Norreklit, 2010). With the change in raw material,
production and another expense per unit cost also get changed.
Table 1: Calculation of total cost and per unit cost for a job
Job cost sheet for Job no. 444
Particulars Total cost
Direct material ( 50kg*200 units* 4£ per kg) 40000
Direct Labor ( 30 hours* 9£ per hour * 200 units) 54000
Fixed production overhead (80000£/20000*(200 Units *30
hours) 24000
variable production overhead ( 6£ *6000 hours) 36000
Total cost 154000
Unit cost (154000£/200 Units) 770
Interpretation
Per unit cost of production of 200 units are 770. For computation of this value material,
labor, production overhead and variable production overhead cost are calculated. In this regard,
particular quantity is multiplied by per unit cost and in this way was per unit specific cost is
calculated. After that, all the expenses are added and divided by the number of units that Jeffery
& sons intends to produce. By doing this, per unit cost is calculated for the number of units that
firm intends to produce.
1.3 Calculation of the cost by using absorption costing technique
a) Allocation and apportion of overhead into three production departments
Primary distribution
2 | P a g e
change in level of production (Herman, 2011). Raw material cost is an example of
indirect cost. The last category of cost is semi variable cost and it is a cost whose some
part remain fixed and some remain variable. Hence, it can be said that all costs fall in this
category.
1.2 Calculation of unit cost
Unit cost refers to per unit cost that is computed by dividing aggregate value by number
of units (Baldvinsdottir, Mitchell and Norreklit, 2010). With the change in raw material,
production and another expense per unit cost also get changed.
Table 1: Calculation of total cost and per unit cost for a job
Job cost sheet for Job no. 444
Particulars Total cost
Direct material ( 50kg*200 units* 4£ per kg) 40000
Direct Labor ( 30 hours* 9£ per hour * 200 units) 54000
Fixed production overhead (80000£/20000*(200 Units *30
hours) 24000
variable production overhead ( 6£ *6000 hours) 36000
Total cost 154000
Unit cost (154000£/200 Units) 770
Interpretation
Per unit cost of production of 200 units are 770. For computation of this value material,
labor, production overhead and variable production overhead cost are calculated. In this regard,
particular quantity is multiplied by per unit cost and in this way was per unit specific cost is
calculated. After that, all the expenses are added and divided by the number of units that Jeffery
& sons intends to produce. By doing this, per unit cost is calculated for the number of units that
firm intends to produce.
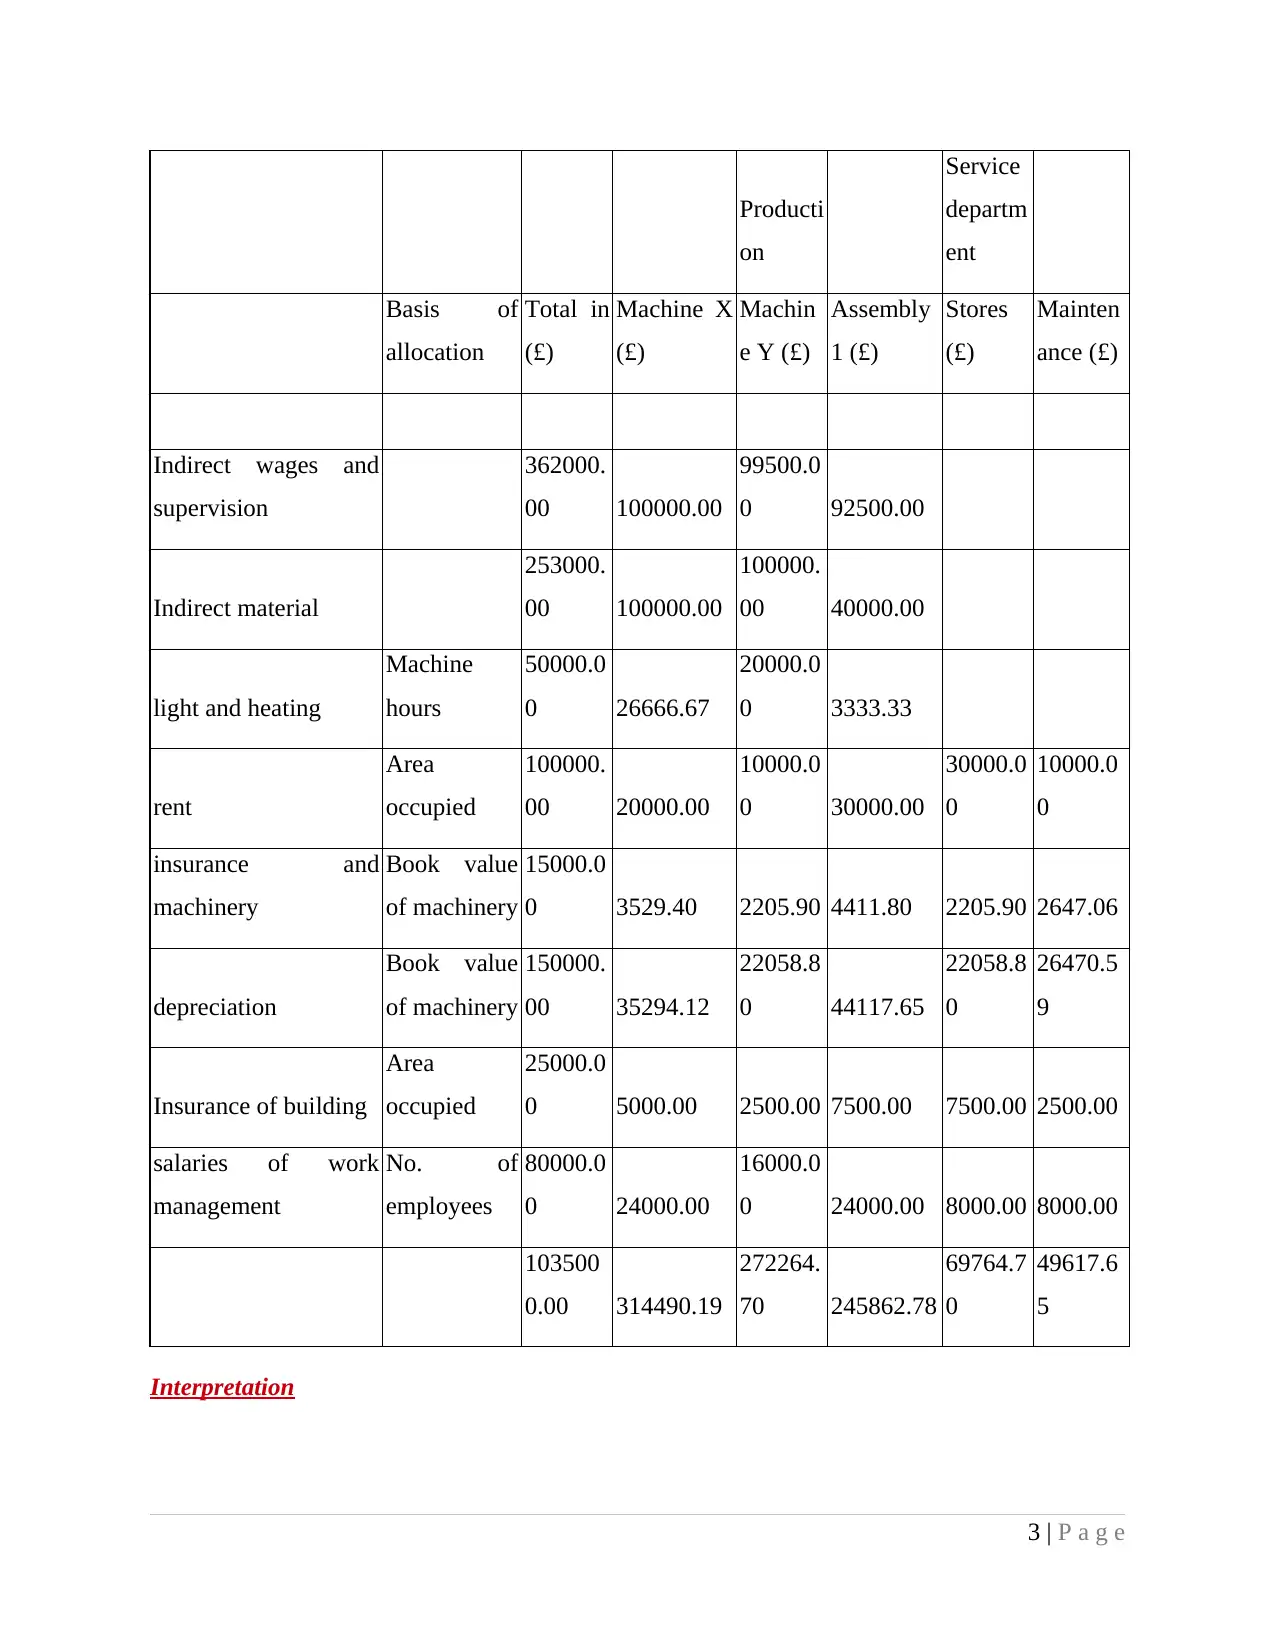
1.3 Calculation of the cost by using absorption costing technique
a) Allocation and apportion of overhead into three production departments
Primary distribution
2 | P a g e
Producti
on
Service
departm
ent
Basis of
allocation
Total in
(£)
Machine X
(£)
Machin
e Y (£)
Assembly
1 (£)
Stores
(£)
Mainten
ance (£)
Indirect wages and
supervision
362000.
00 100000.00
99500.0
0 92500.00
Indirect material
253000.
00 100000.00
100000.
00 40000.00
light and heating
Machine
hours
50000.0
0 26666.67
20000.0
0 3333.33
rent
Area
occupied
100000.
00 20000.00
10000.0
0 30000.00
30000.0
0
10000.0
0
insurance and
machinery
Book value
of machinery
15000.0
0 3529.40 2205.90 4411.80 2205.90 2647.06
depreciation
Book value
of machinery
150000.
00 35294.12
22058.8
0 44117.65
22058.8
0
26470.5
9
Insurance of building
Area
occupied
25000.0
0 5000.00 2500.00 7500.00 7500.00 2500.00
salaries of work
management
No. of
employees
80000.0
0 24000.00
16000.0
0 24000.00 8000.00 8000.00
103500
0.00 314490.19
272264.
70 245862.78
69764.7
0
49617.6
5
Interpretation
3 | P a g e
⊘ This is a preview!⊘
Do you want full access?
Subscribe today to unlock all pages.
Trusted by 1+ million students worldwide
In calculation, all costs like material, heating and supervision are divided among different
departments. The total cost of these departments is 1035000.00 which include wage, material,
heating and insurance expenses, etc. These expenses are allocated among different departments.
On that basis, cost for all departments is computed separately and the cost of machine X, Y and
assembly as well as stores is 314490, 272262, 245862 and 69764. Hence, 1035000.00 is the
summation of all these above given values.
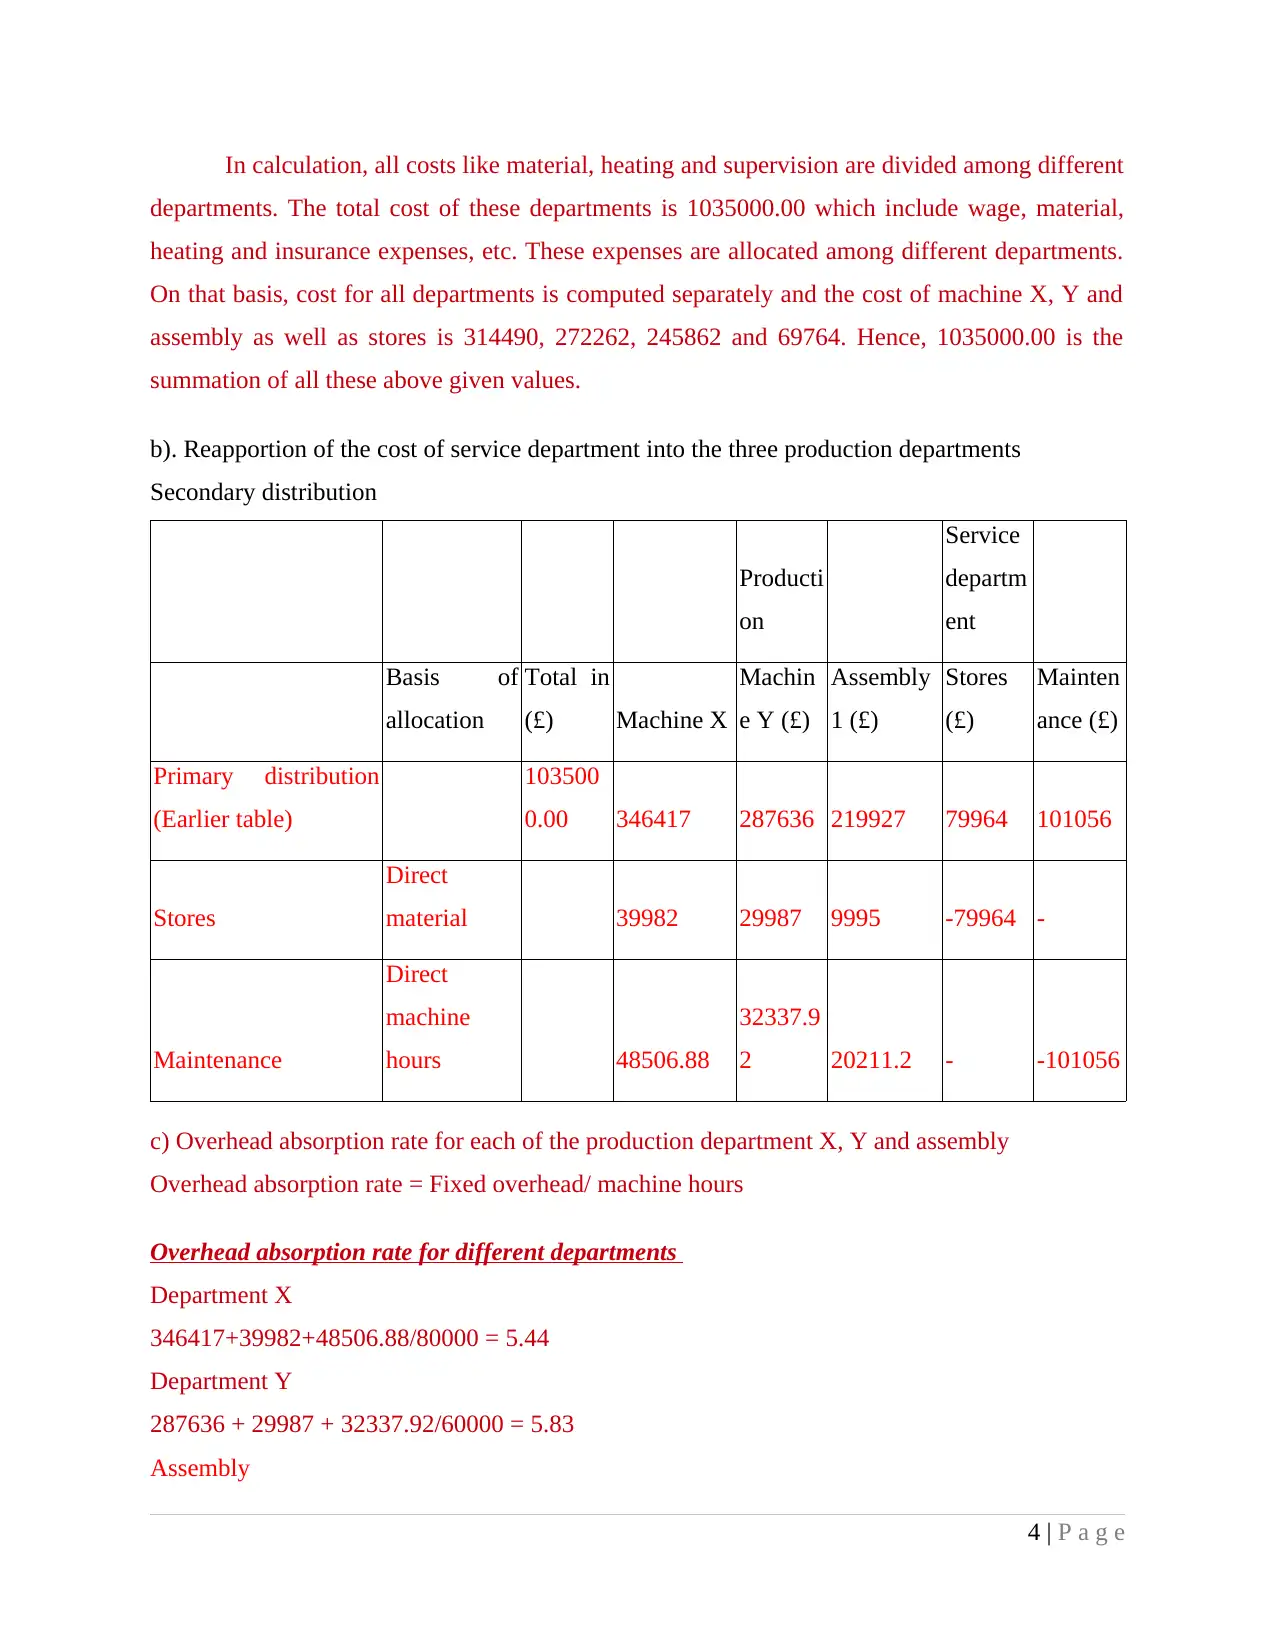
b). Reapportion of the cost of service department into the three production departments
Secondary distribution
Producti
on
Service
departm
ent
Basis of
allocation
Total in
(£) Machine X
Machin
e Y (£)
Assembly
1 (£)
Stores
(£)
Mainten
ance (£)
Primary distribution
(Earlier table)
103500
0.00 346417 287636 219927 79964 101056
Stores
Direct
material 39982 29987 9995 -79964 -
Maintenance
Direct
machine
hours 48506.88
32337.9
2 20211.2 - -101056
c) Overhead absorption rate for each of the production department X, Y and assembly
Overhead absorption rate = Fixed overhead/ machine hours
Overhead absorption rate for different departments
Department X
346417+39982+48506.88/80000 = 5.44
Department Y
287636 + 29987 + 32337.92/60000 = 5.83
Assembly
4 | P a g e
departments. The total cost of these departments is 1035000.00 which include wage, material,
heating and insurance expenses, etc. These expenses are allocated among different departments.
On that basis, cost for all departments is computed separately and the cost of machine X, Y and
assembly as well as stores is 314490, 272262, 245862 and 69764. Hence, 1035000.00 is the
summation of all these above given values.
b). Reapportion of the cost of service department into the three production departments
Secondary distribution
Producti
on
Service
departm
ent
Basis of
allocation
Total in
(£) Machine X
Machin
e Y (£)
Assembly
1 (£)
Stores
(£)
Mainten
ance (£)
Primary distribution
(Earlier table)
103500
0.00 346417 287636 219927 79964 101056
Stores
Direct
material 39982 29987 9995 -79964 -
Maintenance
Direct
machine
hours 48506.88
32337.9
2 20211.2 - -101056
c) Overhead absorption rate for each of the production department X, Y and assembly
Overhead absorption rate = Fixed overhead/ machine hours
Overhead absorption rate for different departments
Department X
346417+39982+48506.88/80000 = 5.44
Department Y
287636 + 29987 + 32337.92/60000 = 5.83
Assembly
4 | P a g e
Paraphrase This Document
Need a fresh take? Get an instant paraphrase of this document with our AI Paraphraser
219927 + 9995 + 20211.2/10000 = 25.01
Interpretation
Overhead absorption rate indicates fixed cost that is on per machine hour. This rate is
higher in case of assembly which means that more and more fixed cost is covered in the
assembly then department X and Y. Hence, it can be said that cost coverage capacity in case of
assembly is higher than department X and Y.
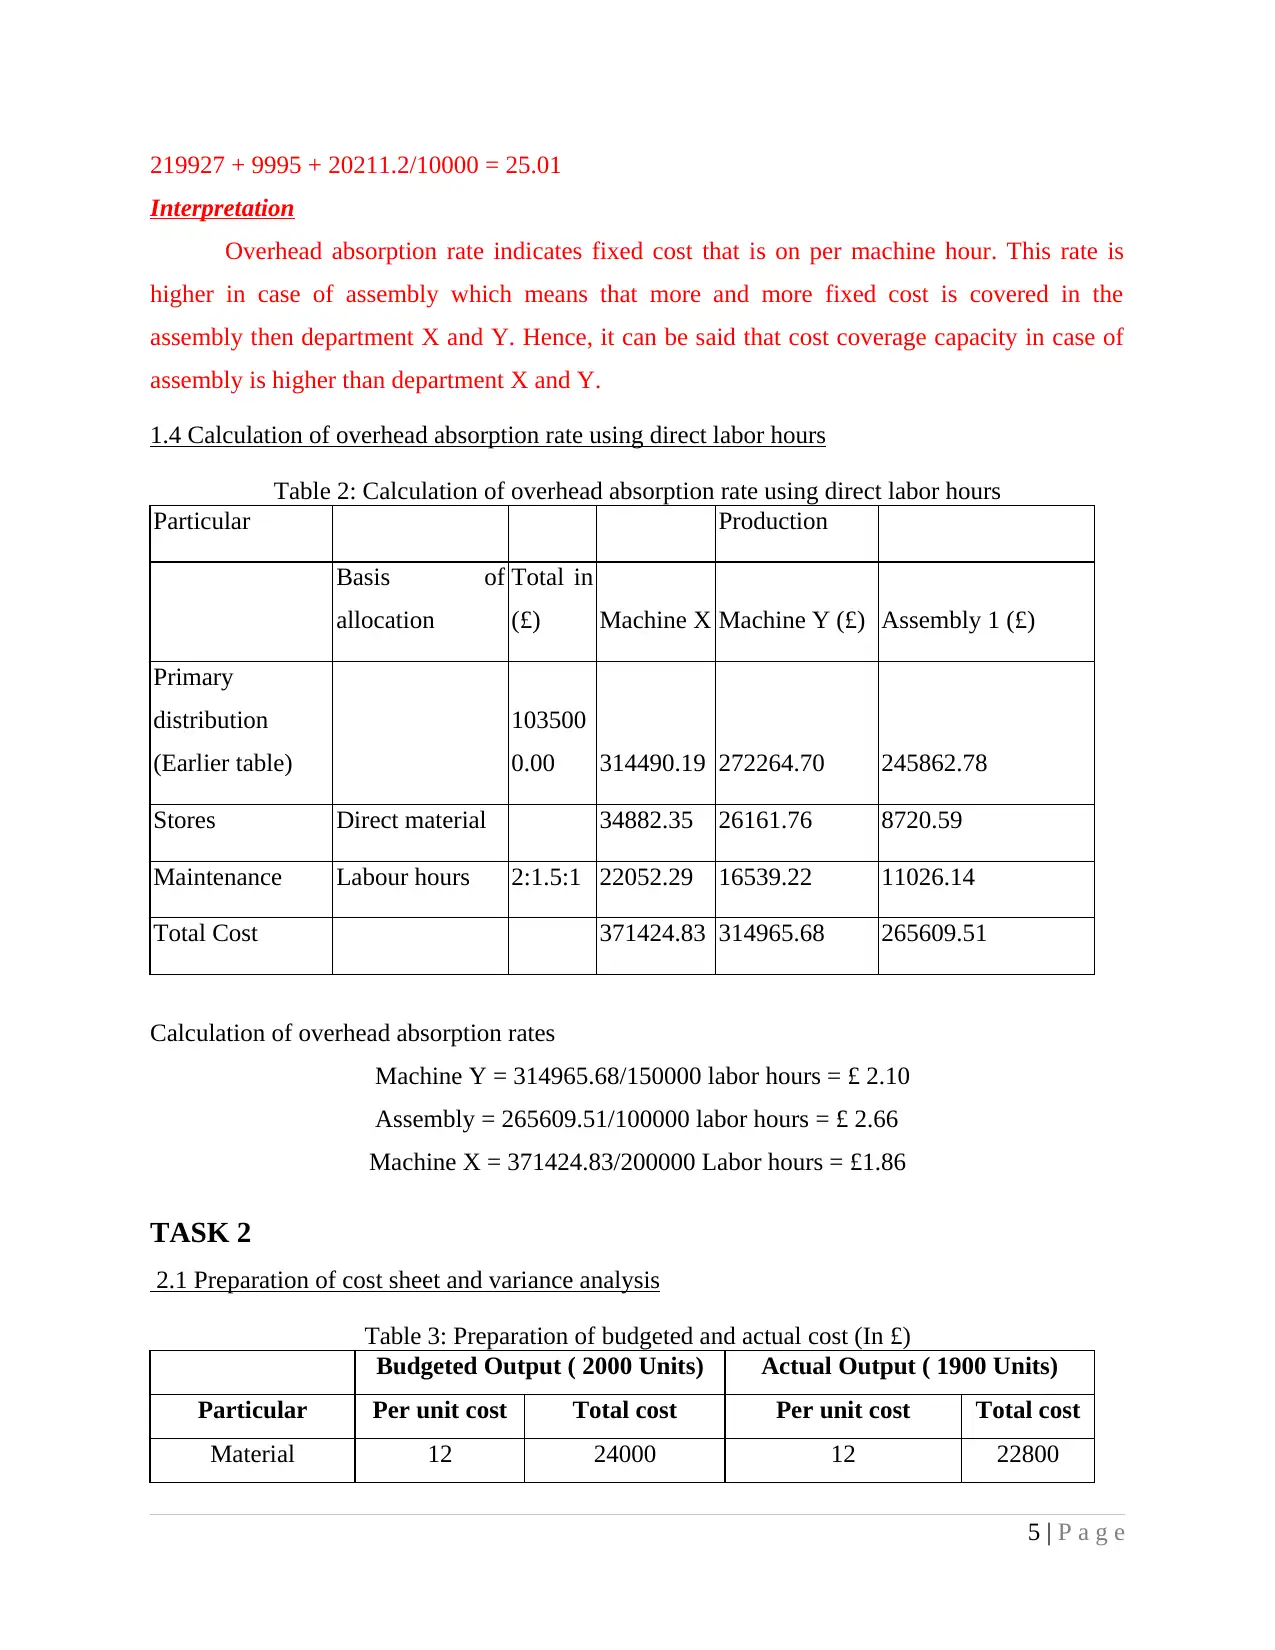
1.4 Calculation of overhead absorption rate using direct labor hours
Table 2: Calculation of overhead absorption rate using direct labor hours
Particular Production
Basis of
allocation
Total in
(£) Machine X Machine Y (£) Assembly 1 (£)
Primary
distribution
(Earlier table)
103500
0.00 314490.19 272264.70 245862.78
Stores Direct material 34882.35 26161.76 8720.59
Maintenance Labour hours 2:1.5:1 22052.29 16539.22 11026.14
Total Cost 371424.83 314965.68 265609.51
Calculation of overhead absorption rates
Machine Y = 314965.68/150000 labor hours = £ 2.10
Assembly = 265609.51/100000 labor hours = £ 2.66
Machine X = 371424.83/200000 Labor hours = £1.86
TASK 2
2.1 Preparation of cost sheet and variance analysis
Table 3: Preparation of budgeted and actual cost (In £)
Budgeted Output ( 2000 Units) Actual Output ( 1900 Units)
Particular Per unit cost Total cost Per unit cost Total cost
Material 12 24000 12 22800
5 | P a g e
Interpretation
Overhead absorption rate indicates fixed cost that is on per machine hour. This rate is
higher in case of assembly which means that more and more fixed cost is covered in the
assembly then department X and Y. Hence, it can be said that cost coverage capacity in case of
assembly is higher than department X and Y.
1.4 Calculation of overhead absorption rate using direct labor hours
Table 2: Calculation of overhead absorption rate using direct labor hours
Particular Production
Basis of
allocation
Total in
(£) Machine X Machine Y (£) Assembly 1 (£)
Primary
distribution
(Earlier table)
103500
0.00 314490.19 272264.70 245862.78
Stores Direct material 34882.35 26161.76 8720.59
Maintenance Labour hours 2:1.5:1 22052.29 16539.22 11026.14
Total Cost 371424.83 314965.68 265609.51
Calculation of overhead absorption rates
Machine Y = 314965.68/150000 labor hours = £ 2.10
Assembly = 265609.51/100000 labor hours = £ 2.66
Machine X = 371424.83/200000 Labor hours = £1.86
TASK 2
2.1 Preparation of cost sheet and variance analysis
Table 3: Preparation of budgeted and actual cost (In £)
Budgeted Output ( 2000 Units) Actual Output ( 1900 Units)
Particular Per unit cost Total cost Per unit cost Total cost
Material 12 24000 12 22800
5 | P a g e
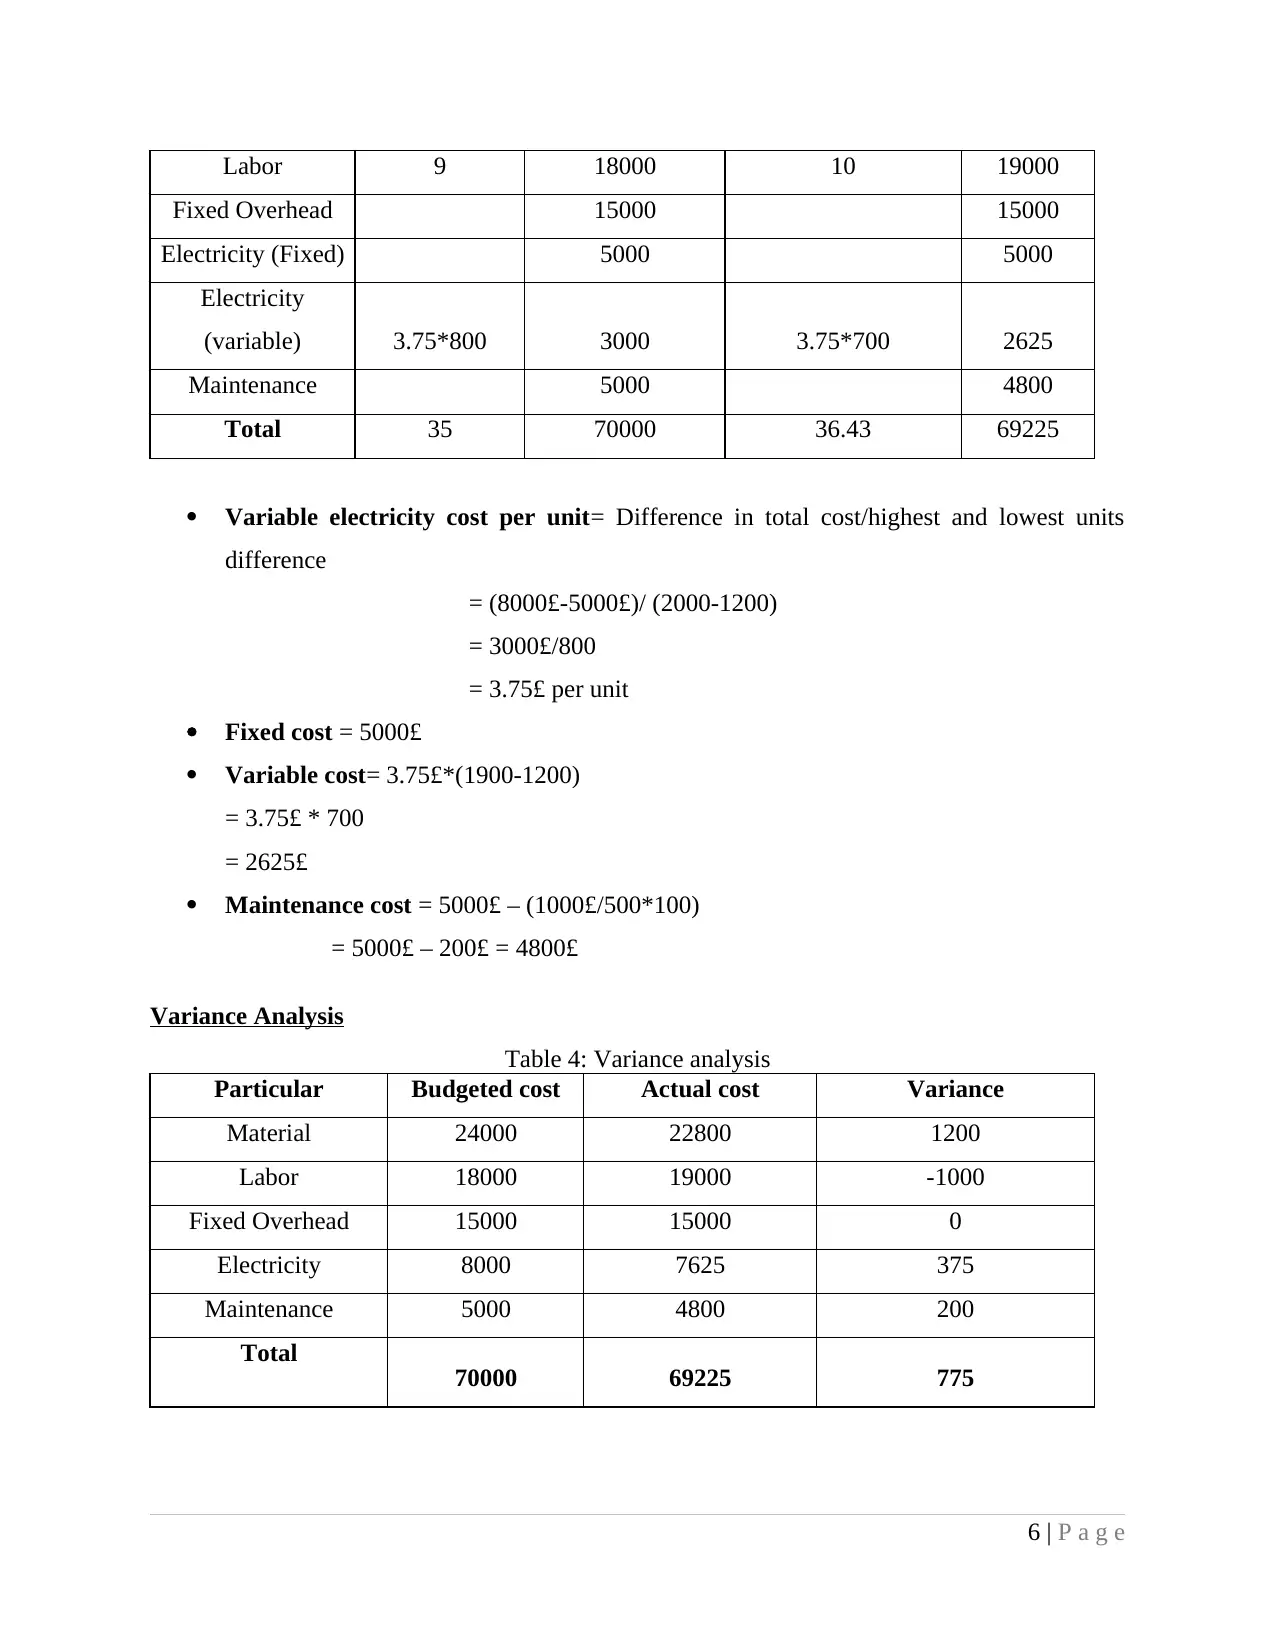
Labor 9 18000 10 19000
Fixed Overhead 15000 15000
Electricity (Fixed) 5000 5000
Electricity
(variable) 3.75*800 3000 3.75*700 2625
Maintenance 5000 4800
Total 35 70000 36.43 69225
Variable electricity cost per unit= Difference in total cost/highest and lowest units
difference
= (8000£-5000£)/ (2000-1200)
= 3000£/800
= 3.75£ per unit
Fixed cost = 5000£
Variable cost= 3.75£*(1900-1200)
= 3.75£ * 700
= 2625£
Maintenance cost = 5000£ – (1000£/500*100)
= 5000£ – 200£ = 4800£
Variance Analysis
Table 4: Variance analysis
Particular Budgeted cost Actual cost Variance
Material 24000 22800 1200
Labor 18000 19000 -1000
Fixed Overhead 15000 15000 0
Electricity 8000 7625 375
Maintenance 5000 4800 200
Total 70000 69225 775
6 | P a g e
⊘ This is a preview!⊘
Do you want full access?
Subscribe today to unlock all pages.
Trusted by 1+ million students worldwide
Interpretation
On analyzing the result it can be said that Jefferey & sons gives a good performance on
the budget. Its material, fixed overhead, electricity and maintenance expenses are below
standards and it can be said that firm gives a good performance. On other hand, negative
variance is observed in case of labors. However, it can easily be seen that firm produced less
units. Its target was to produce 2000 units but it produced 1900 units. So, it can be said that due
to production of less units cost of direct and indirect expenses is also less for the firm. But it
does not have any control on the labor expenses. This is proved from the fact that even produced
units reduces firm labor cost exceed the determined standard. This indicates that firm plan was to
produce 2000 units but due to some reasons it produced only 1900 units. Due to this reason, it
does not reduce its labor force and due to less production its labor cost crossed the determined
standard. But this also reflects that the firm was not having any control on labor cost. Hence,
Jefferey & sons is required to look at its weak point.
2.2 Various performance indicators used to identify the areas of potential improvements
In order measure the company’s performance various parameters are used. These
parameters measure firm’s performance from various sides. Some of the performance indicators
are as follows. Profit- This is an important parameter that Jefferey & sons can use in its business.
Whenever, an organization bring any sort of change in its business it affects its
performance. If performance is improved then it definitely affects the firm’s performance
in terms of revenue. Hence, profit is an important parameter that company can use to
measure its performance (Ward, 2012). In other words, it can also be said that profit is a
tool that can be used to measure the company’s performance. Sales- This is another parameter that is used to measure the organization performance. In
a life time, top management brings many changes in an organization that is directly
related to the sales of the firm. For example, firm bring any new scheme that may attract
people attention towards firm product. Then in order to measure success of its efforts, the
company will use sales as a tool to measure the success of the company (Modell, 2010).
If sales increases then it means that people are positively reacting to marketing efforts of
the firm. In this way, sales are used to identify the success or failure of potential
improvements on the firm.
7 | P a g e
Paraphrase This Document
Need a fresh take? Get an instant paraphrase of this document with our AI Paraphraser
Customer satisfaction- This is third and most reliable parameter that is used by the firms
in order to measure effectiveness of their potential improvements. This parameter is
mostly used by the service sector firms. Under this, the organization first of all brings
changes in its product (Gow, Ormazabal and Taylor, 2010). After that it collects data
from the people regarding their satisfaction level from the services. By doing this, firm
measure success of their potential improvements.
2.3 Ways to reduce cost, enhancing value and quality
There are many ways to reduce cost but before selecting any cost reduction option it is
necessary to evaluate same. In order to reduce cost Jeffery & sons needs to generate economies
of scale. By doing this it can reduce its production cost. Economies of scale can be done in
transportation of goods and supply chain management etc. By using transportation techniques
firm can identify the routes through which it can approach to destination place. The shorter route
will help in reducing transportation cost (Vaivio and Sirén, 2010). Hence, indirect cost of the
firm will get reduced. On other hand, in order to enhance product value firm can start research
and development activities and can add new features on the product. Research and development
program can also be used for process re-engineering and by doing same production process can
be simplified which will lead to reduction in production cost. Firm can also increase its product
quality in order to enhance its value (Lukka and Modell, 2010). If product quality will be
improved then more and more people would like to prefer to buy that product. This will help
firm in increasing its revenue.
TASK 3
3.1 Nature and purpose of budgeting process
Budget is a statement that is prepared in order to set target for an organization in order to
achieve specific objective. There is a specific process that is followed for a budget process and
same is described below. Determination of objectives- In this stage, objectives are determined which acts as a
standard which are used for measuring firm performance. These objectives are
determined in by using various techniques. Some companies use past data in order to
determine objectives for the business. While some companies forecast likely movement
in economic environment of a nation and on the basis of that they determine objectives
8 | P a g e
for the budget (Garrison and et.al., 2010). It depends on the firms that which method they
used for determining objectives of the budget. Measuring performance- After determination of objectives performance of the firm is
measured in monetary and non monetary terms. Like sales and profit are measured in
figures. Whereas, effectiveness of strategic change is measured in non monetary terms.
Hence, after measuring a performance evaluation process begins. Comparing actual results with the performance- In this stage actual performance is
compared with the standard in order to identify that firm is performing good or bad. If
actual results beat standards in proper manner then it is assumed that firm performs well
or vice verse. Follow up action or review- This is final stage in which top managers review entire
performance and demand recommendation from middle level of management (Grabski,
Leech and Schmidt, 2011). After that middle management communicate same to the top
management and get their approval for implementation of recommendations at the
ground level.
Nature and purpose of budget
The main purpose of the budget is to ensure that all resources will be utilized in efficient
and effective manner. In the budget standards are determined and these are related to resources
that firm used to achieve its objectives. By strictly complying with these standards managers
makes an effective use of the available resources. Motivating an employee is another main
purpose of preparing a budget (Burritt, Schaltegger and Zvezdov, 2011). By preparing a budget
targets are prepared for the employee’s. These objectives motivate employees to work hard in
order to achieve an objective. Hence, it can be said that firm has a multi dimensional purpose
behind preparing a budget.
3.2 Appropriate budgeting method for the organization and its need
Following are the techniques that are used for preparing a budget. Incremental budgeting- This is a unique type of budgeting and under this technique old
budget is reviewed and increase is made to old values by certain percentages. In this way
incremental budget is prepared by the managers. This technique is often beneficial for
those companies whose business is increasing continuously on year on year basis. For
9 | P a g e
⊘ This is a preview!⊘
Do you want full access?
Subscribe today to unlock all pages.
Trusted by 1+ million students worldwide
1 out of 18
Related Documents


Your All-in-One AI-Powered Toolkit for Academic Success.
+13062052269
info@desklib.com
Available 24*7 on WhatsApp / Email
![[object Object]](/_next/static/media/star-bottom.7253800d.svg)
Unlock your academic potential
Copyright © 2020–2026 A2Z Services. All Rights Reserved. Developed and managed by ZUCOL.