Open Polytechnic 71202 Management Accounting Assignment 1 Solution
VerifiedAdded on 2023/04/23
|19
|3305
|132
Homework Assignment
AI Summary
This document presents a comprehensive solution to Management Accounting Assignment 1, covering a range of topics. The solution begins with a detailed analysis of short answer questions, including calculations related to schedules of goods manufactured, cost of job, equivalent units, allocation of costs, and Economic Order Quantity (EOQ). The assignment then delves into activity-based costing (ABC), requiring the preparation of profit statements, allocation of overhead costs, calculation of activity rates, and a comparison of traditional and ABC methods. Furthermore, the solution includes budgeting exercises, such as sales, production, direct material purchases, and cash budgets. Finally, the assignment concludes with a standard costing section, incorporating variance analysis for direct materials, direct labor, and overheads. The solution provides all necessary calculations and interpretations to address the assignment's requirements effectively.

Management Accounting
1
1
Paraphrase This Document
Need a fresh take? Get an instant paraphrase of this document with our AI Paraphraser
Table of Contents
Table of Contents.............................................................................................................................2
QUESTION 1...................................................................................................................................4
A): Schedule of goods manufactured for the period ending 31st march 2018.............................6
B): Complete the table.................................................................................................................7
C) (i) Calculation of total cost of job X10...................................................................................7
(ii) Undervaluation and over-valuation........................................................................................8
D): (i) Schedule of Equivalent unit..............................................................................................8
(ii): Total cost of finished goods..................................................................................................8
(iii) Total cost of finished good for the month of November......................................................8
(e): Allocation of cost to support department to manufacturing line 1 and 2.............................9
(f):(i) Calculation for EOQ..........................................................................................................9
(ii): Interpretation.......................................................................................................................10
(g): Allocate the joint manufacturing cost.................................................................................10
QUESTION 2.................................................................................................................................10
(a) Preparation of profit statement...........................................................................................10
(b): Allocation of the overhead cost to each activity.................................................................11
(c): Activity rate for each activity cost pool..............................................................................11
(d): Calculate the total overhead cost.........................................................................................12
(e): Preparing a profit statement................................................................................................13
(f): Indication of the activity based costing information...........................................................13
QUESTION 3.................................................................................................................................13
(a) (I) Sales Budget for the period ending December 2019.......................................................13
(a) (ii) Production Budget for the period ending December 2019.............................................14
(a) (iii) Direct material purchases Budget for the period ending December 2019.....................14
(b): Cash Budget for the period ending December 2019...........................................................16
QUESTION 4.................................................................................................................................16
(a): Use of Historic data.............................................................................................................16
(b): Difference............................................................................................................................17
(c) (i): Direct material variance..................................................................................................17
(ii): Calculation for direct labour rate variance..........................................................................17
(iii): Variable overhead spending...............................................................................................17
(iv): Fixed overhead volume variance.......................................................................................17
REFERENCES..............................................................................................................................19
3
(iv): Fixed overhead volume variance.......................................................................................17
REFERENCES..............................................................................................................................19
3
⊘ This is a preview!⊘
Do you want full access?
Subscribe today to unlock all pages.
Trusted by 1+ million students worldwide
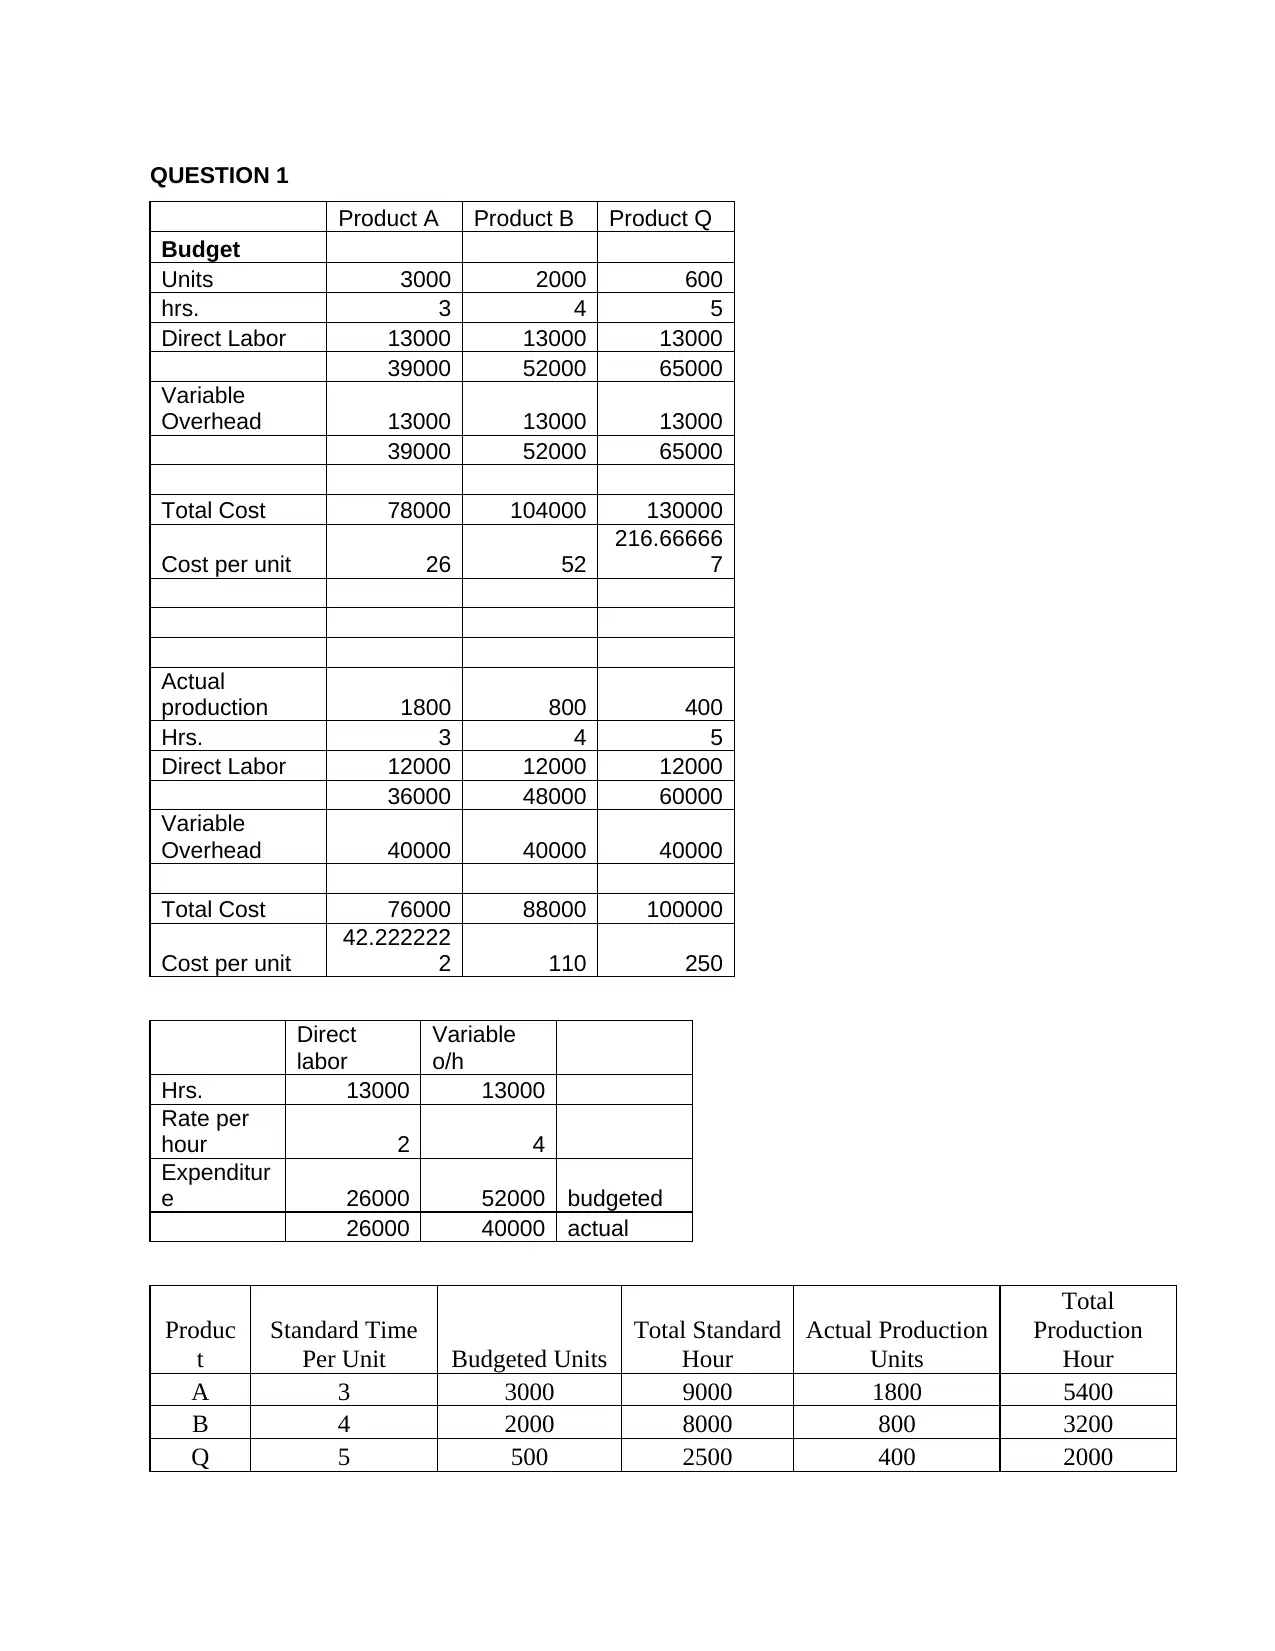
QUESTION 1
Product A Product B Product Q
Budget
Units 3000 2000 600
hrs. 3 4 5
Direct Labor 13000 13000 13000
39000 52000 65000
Variable
Overhead 13000 13000 13000
39000 52000 65000
Total Cost 78000 104000 130000
Cost per unit 26 52
216.66666
7
Actual
production 1800 800 400
Hrs. 3 4 5
Direct Labor 12000 12000 12000
36000 48000 60000
Variable
Overhead 40000 40000 40000
Total Cost 76000 88000 100000
Cost per unit
42.222222
2 110 250
Direct
labor
Variable
o/h
Hrs. 13000 13000
Rate per
hour 2 4
Expenditur
e 26000 52000 budgeted
26000 40000 actual
Produc
t
Standard Time
Per Unit Budgeted Units
Total Standard
Hour
Actual Production
Units
Total
Production
Hour
A 3 3000 9000 1800 5400
B 4 2000 8000 800 3200
Q 5 500 2500 400 2000
Paraphrase This Document
Need a fresh take? Get an instant paraphrase of this document with our AI Paraphraser
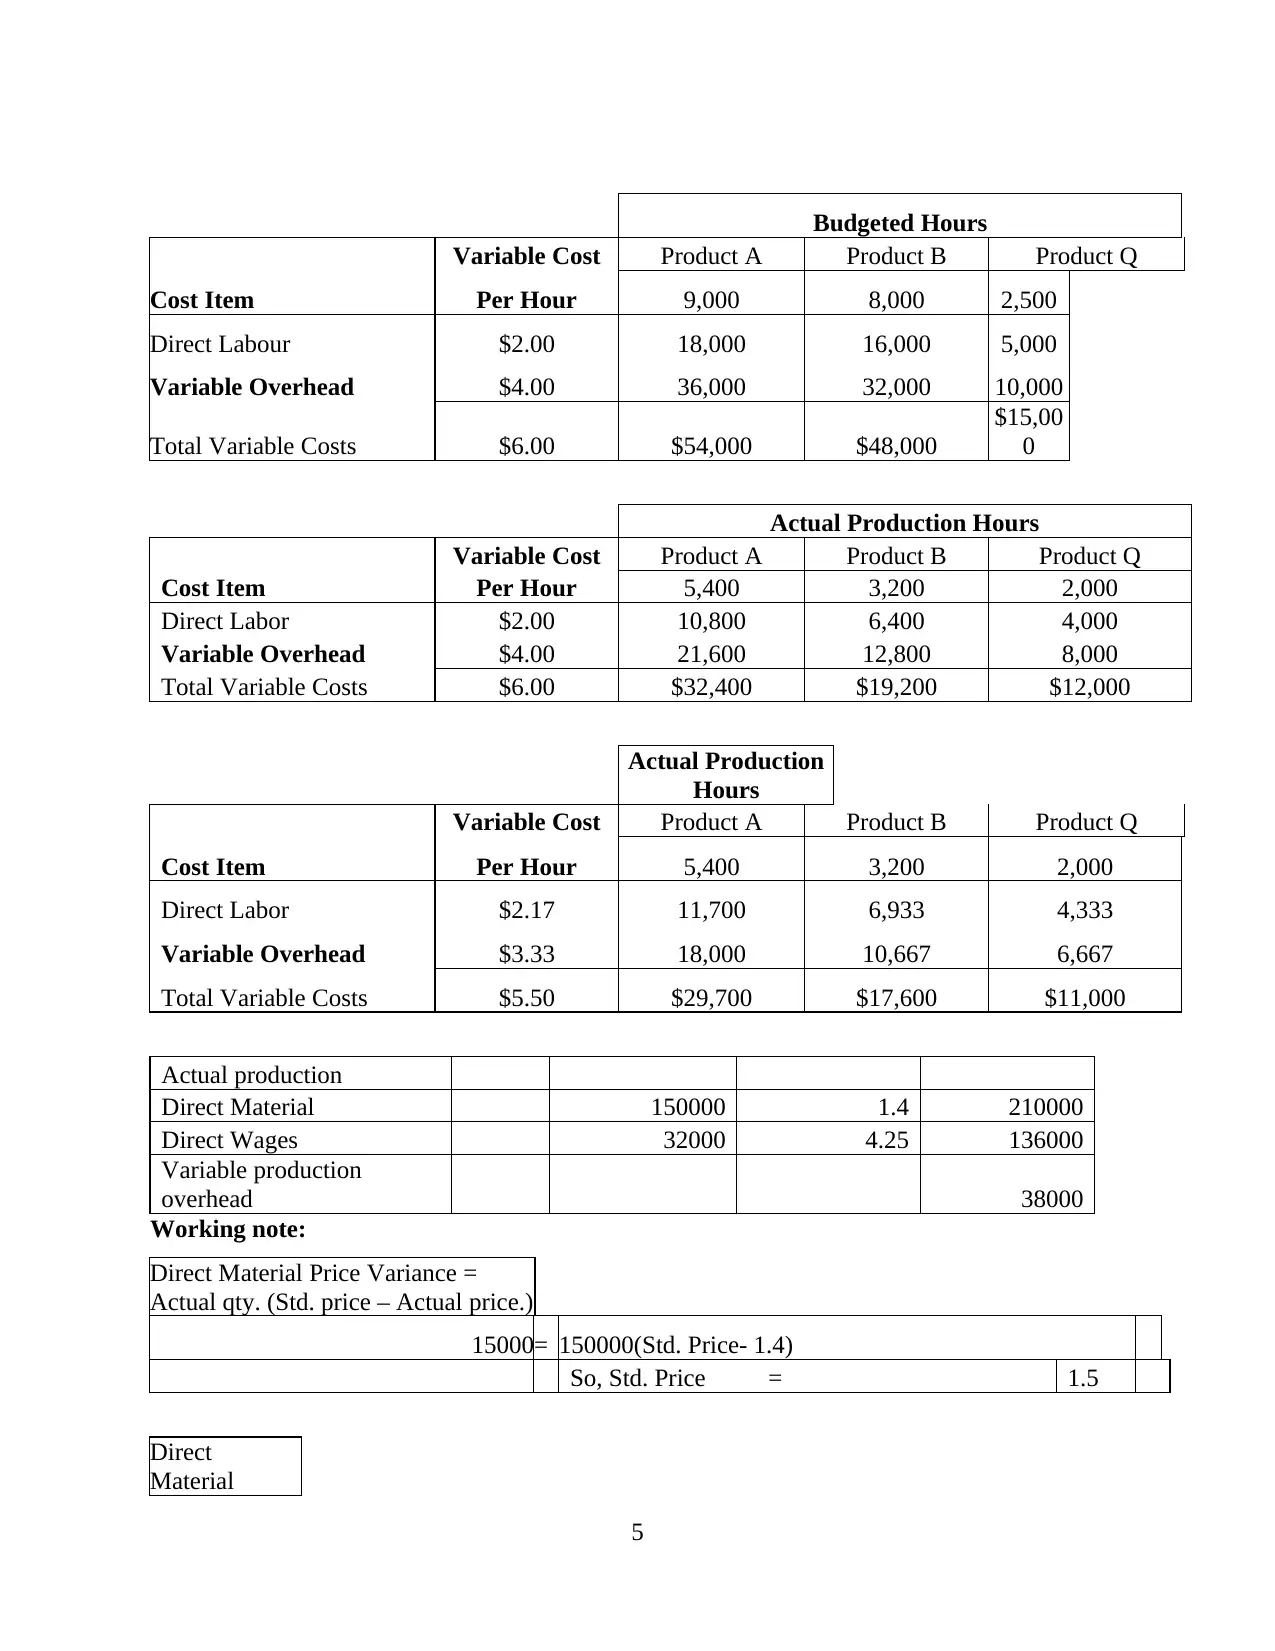
Budgeted Hours
Variable Cost Product A Product B Product Q
Cost Item Per Hour 9,000 8,000 2,500
Direct Labour $2.00 18,000 16,000 5,000
Variable Overhead $4.00 36,000 32,000 10,000
Total Variable Costs $6.00 $54,000 $48,000
$15,00
0
Actual Production Hours
Variable Cost Product A Product B Product Q
Cost Item Per Hour 5,400 3,200 2,000
Direct Labor $2.00 10,800 6,400 4,000
Variable Overhead $4.00 21,600 12,800 8,000
Total Variable Costs $6.00 $32,400 $19,200 $12,000
Actual Production
Hours
Variable Cost Product A Product B Product Q
Cost Item Per Hour 5,400 3,200 2,000
Direct Labor $2.17 11,700 6,933 4,333
Variable Overhead $3.33 18,000 10,667 6,667
Total Variable Costs $5.50 $29,700 $17,600 $11,000
Actual production
Direct Material 150000 1.4 210000
Direct Wages 32000 4.25 136000
Variable production
overhead 38000
Working note:
Direct Material Price Variance =
Actual qty. (Std. price – Actual price.)
15000= 150000(Std. Price- 1.4)
So, Std. Price = 1.5
Direct
Material
5
Variable Cost Product A Product B Product Q
Cost Item Per Hour 9,000 8,000 2,500
Direct Labour $2.00 18,000 16,000 5,000
Variable Overhead $4.00 36,000 32,000 10,000
Total Variable Costs $6.00 $54,000 $48,000
$15,00
0
Actual Production Hours
Variable Cost Product A Product B Product Q
Cost Item Per Hour 5,400 3,200 2,000
Direct Labor $2.00 10,800 6,400 4,000
Variable Overhead $4.00 21,600 12,800 8,000
Total Variable Costs $6.00 $32,400 $19,200 $12,000
Actual Production
Hours
Variable Cost Product A Product B Product Q
Cost Item Per Hour 5,400 3,200 2,000
Direct Labor $2.17 11,700 6,933 4,333
Variable Overhead $3.33 18,000 10,667 6,667
Total Variable Costs $5.50 $29,700 $17,600 $11,000
Actual production
Direct Material 150000 1.4 210000
Direct Wages 32000 4.25 136000
Variable production
overhead 38000
Working note:
Direct Material Price Variance =
Actual qty. (Std. price – Actual price.)
15000= 150000(Std. Price- 1.4)
So, Std. Price = 1.5
Direct
Material
5
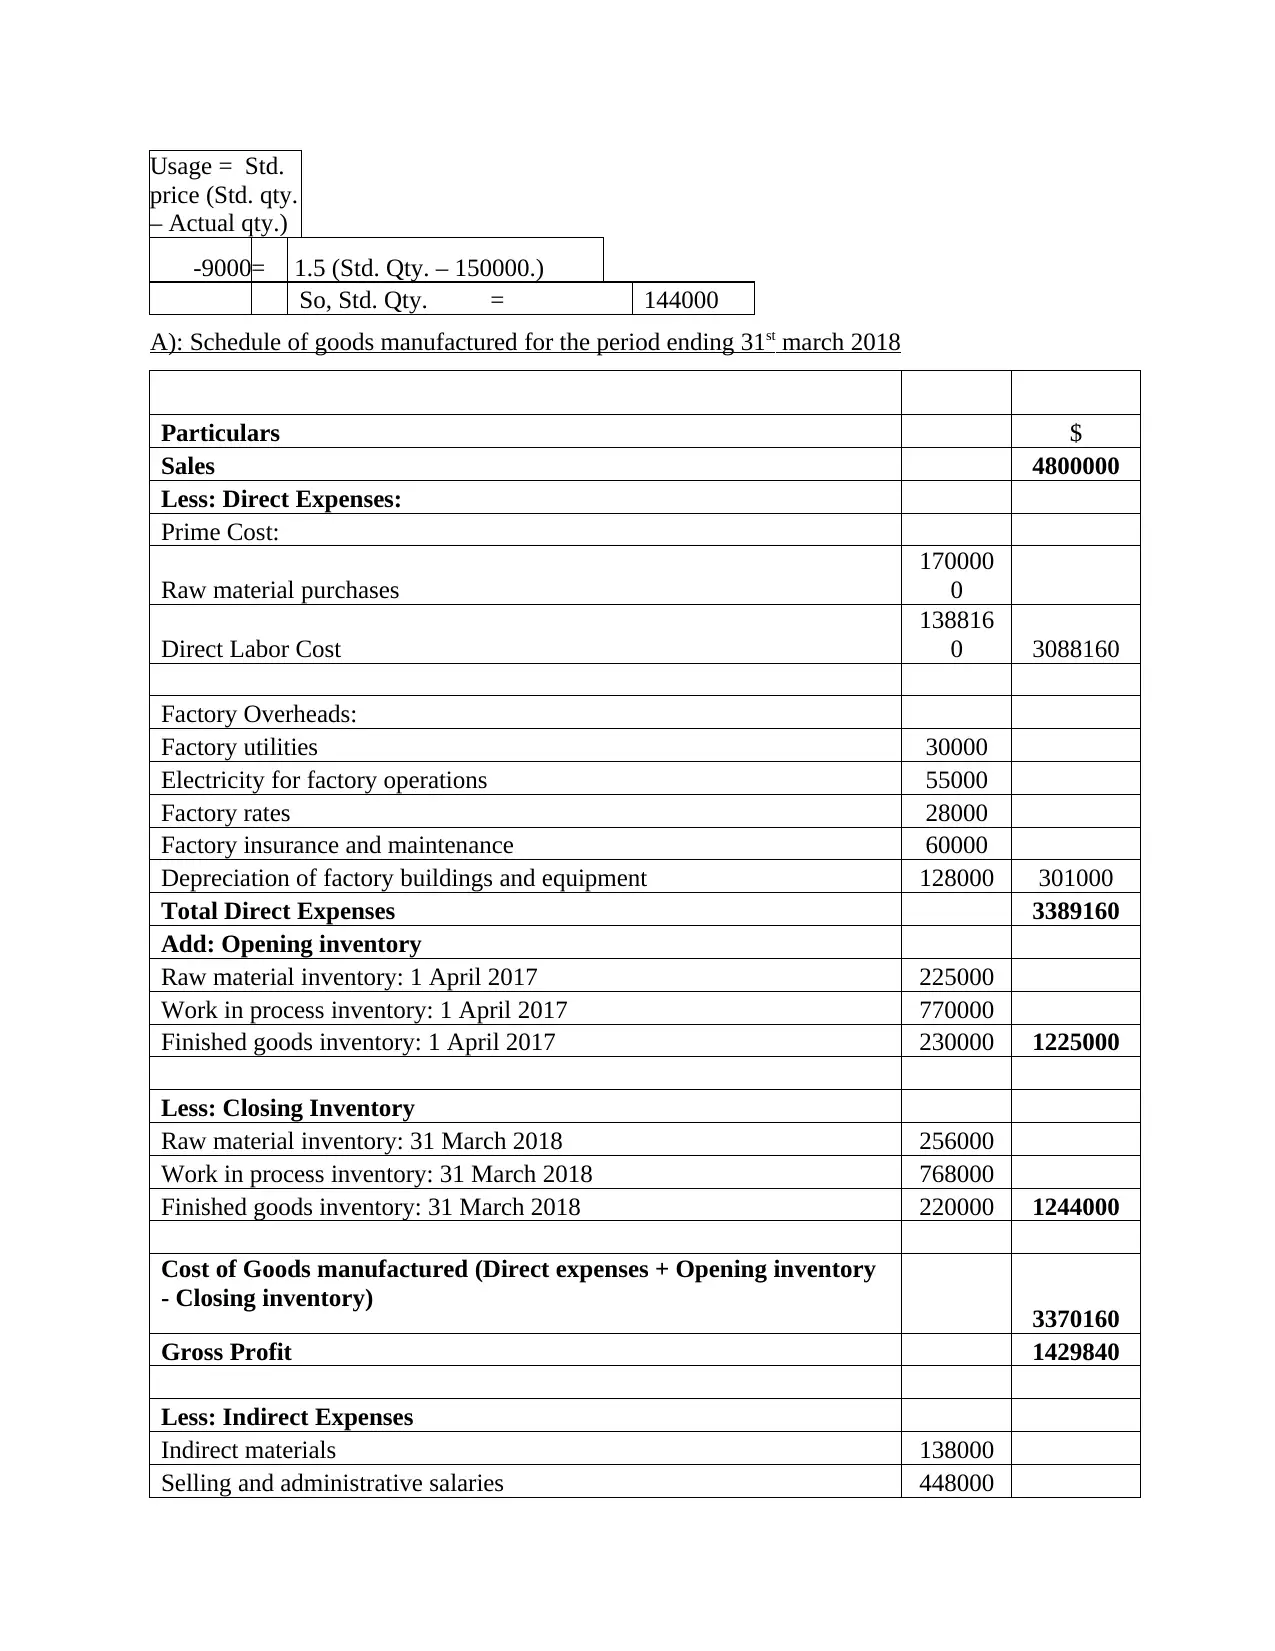
Usage = Std.
price (Std. qty.
– Actual qty.)
-9000= 1.5 (Std. Qty. – 150000.)
So, Std. Qty. = 144000
A): Schedule of goods manufactured for the period ending 31st march 2018
Particulars $
Sales 4800000
Less: Direct Expenses:
Prime Cost:
Raw material purchases
170000
0
Direct Labor Cost
138816
0 3088160
Factory Overheads:
Factory utilities 30000
Electricity for factory operations 55000
Factory rates 28000
Factory insurance and maintenance 60000
Depreciation of factory buildings and equipment 128000 301000
Total Direct Expenses 3389160
Add: Opening inventory
Raw material inventory: 1 April 2017 225000
Work in process inventory: 1 April 2017 770000
Finished goods inventory: 1 April 2017 230000 1225000
Less: Closing Inventory
Raw material inventory: 31 March 2018 256000
Work in process inventory: 31 March 2018 768000
Finished goods inventory: 31 March 2018 220000 1244000
Cost of Goods manufactured (Direct expenses + Opening inventory
- Closing inventory) 3370160
Gross Profit 1429840
Less: Indirect Expenses
Indirect materials 138000
Selling and administrative salaries 448000
⊘ This is a preview!⊘
Do you want full access?
Subscribe today to unlock all pages.
Trusted by 1+ million students worldwide
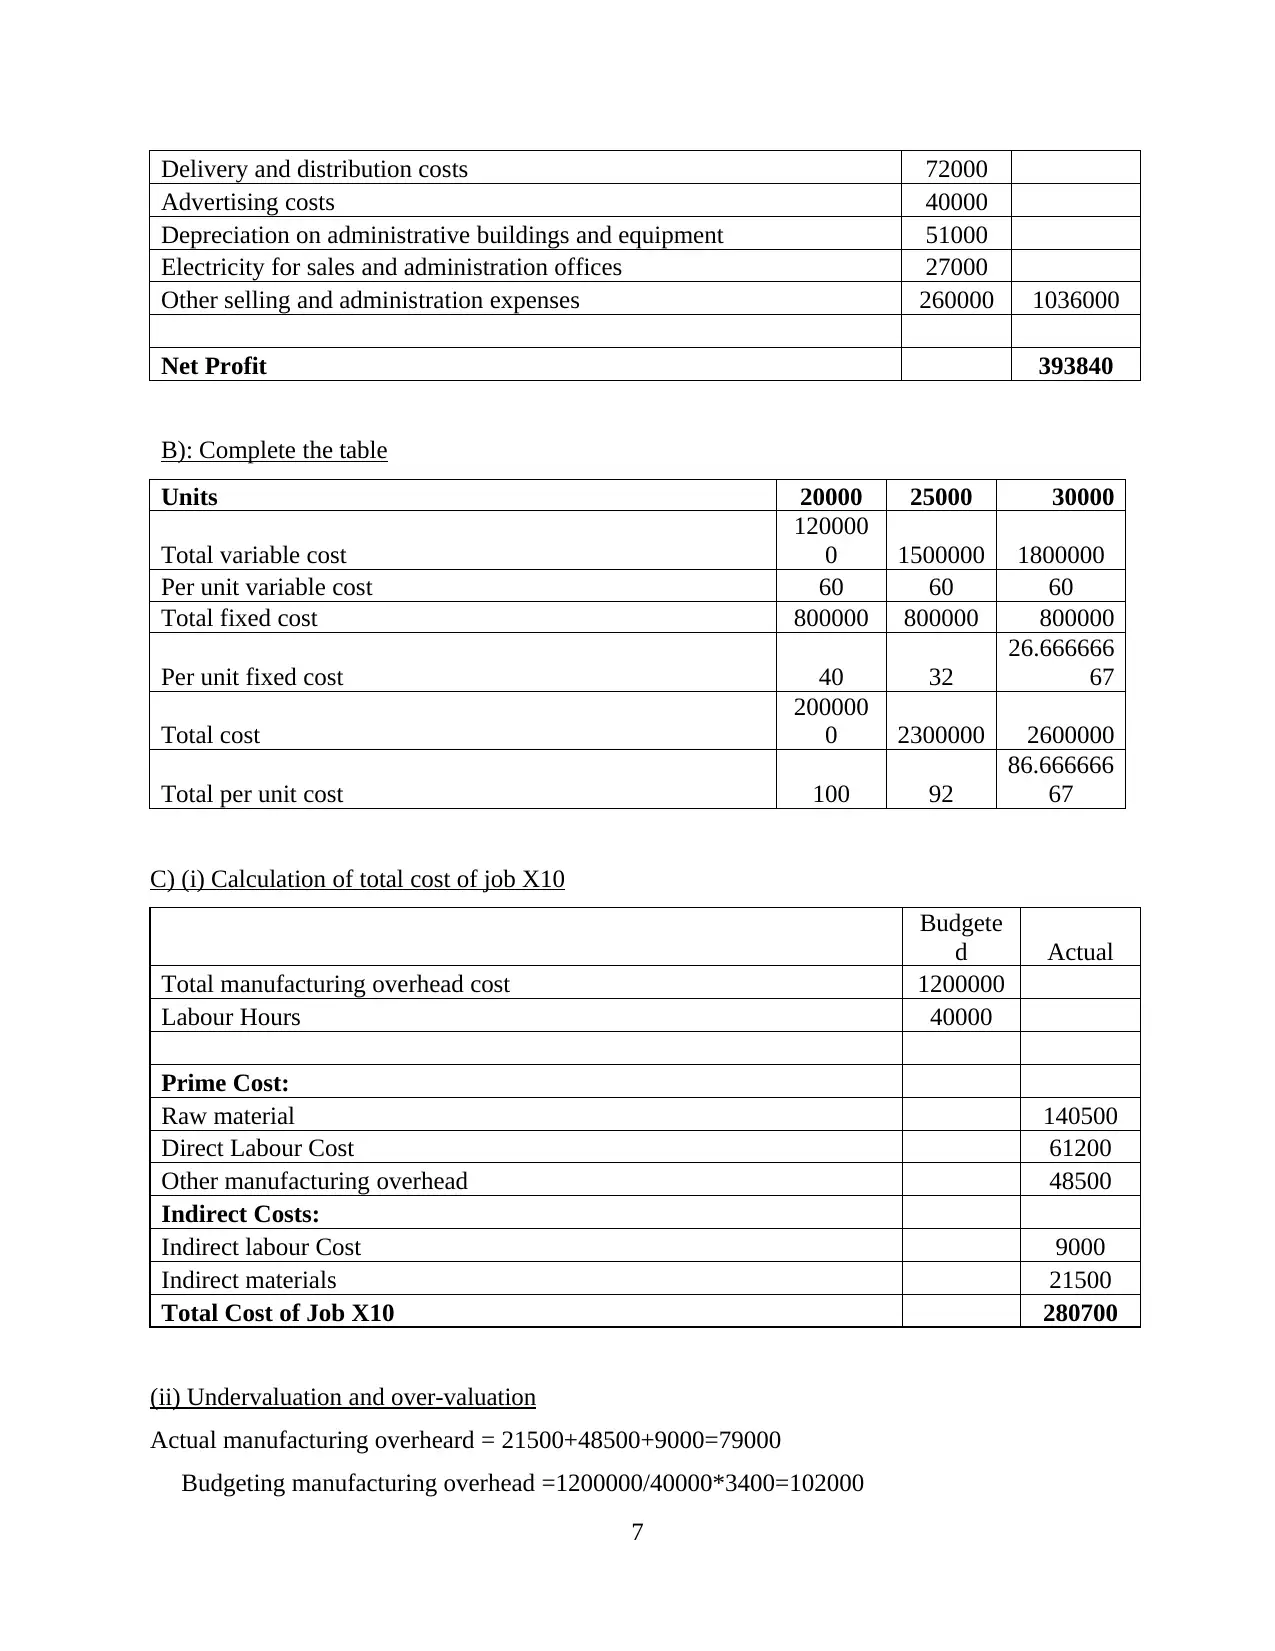
Delivery and distribution costs 72000
Advertising costs 40000
Depreciation on administrative buildings and equipment 51000
Electricity for sales and administration offices 27000
Other selling and administration expenses 260000 1036000
Net Profit 393840
B): Complete the table
Units 20000 25000 30000
Total variable cost
120000
0 1500000 1800000
Per unit variable cost 60 60 60
Total fixed cost 800000 800000 800000
Per unit fixed cost 40 32
26.666666
67
Total cost
200000
0 2300000 2600000
Total per unit cost 100 92
86.666666
67
C) (i) Calculation of total cost of job X10
Budgete
d Actual
Total manufacturing overhead cost 1200000
Labour Hours 40000
Prime Cost:
Raw material 140500
Direct Labour Cost 61200
Other manufacturing overhead 48500
Indirect Costs:
Indirect labour Cost 9000
Indirect materials 21500
Total Cost of Job X10 280700
(ii) Undervaluation and over-valuation
Actual manufacturing overheard = 21500+48500+9000=79000
Budgeting manufacturing overhead =1200000/40000*3400=102000
7
Paraphrase This Document
Need a fresh take? Get an instant paraphrase of this document with our AI Paraphraser
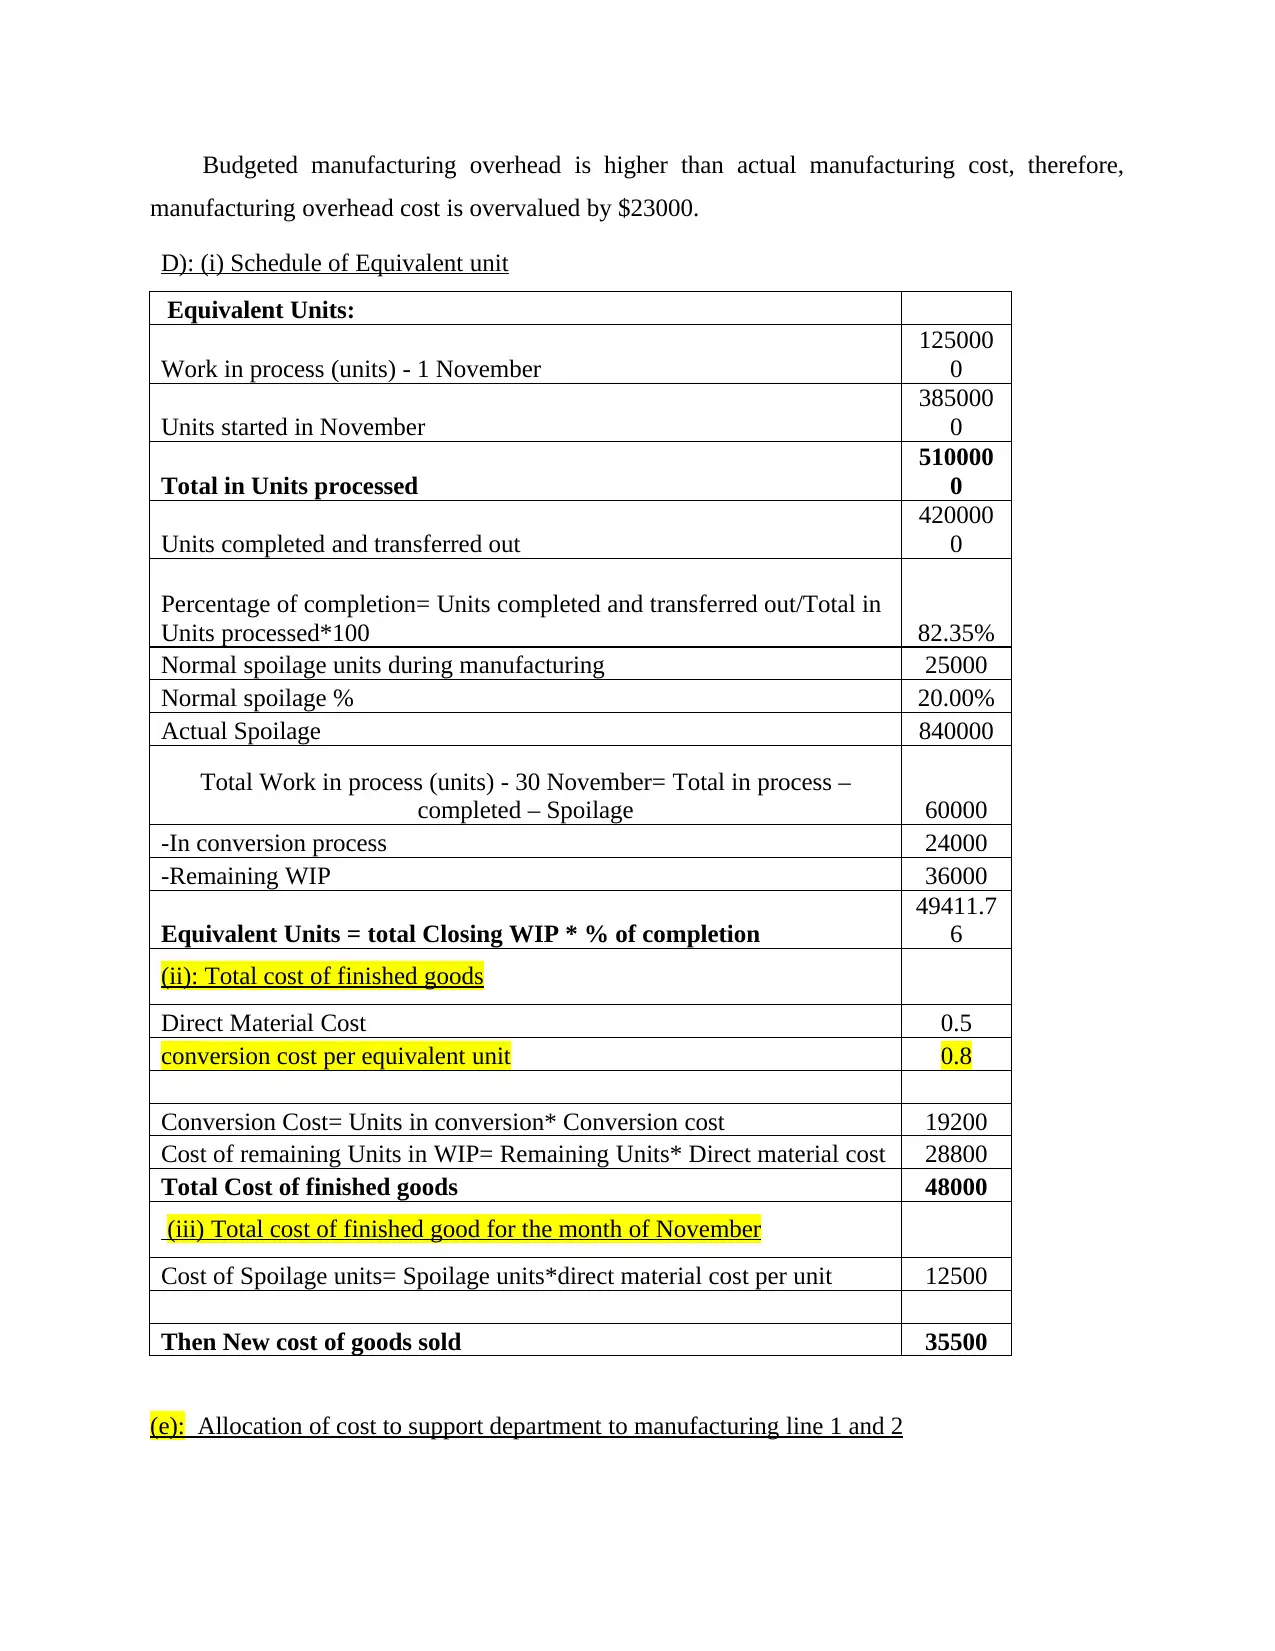
Budgeted manufacturing overhead is higher than actual manufacturing cost, therefore,
manufacturing overhead cost is overvalued by $23000.
D): (i) Schedule of Equivalent unit
Equivalent Units:
Work in process (units) - 1 November
125000
0
Units started in November
385000
0
Total in Units processed
510000
0
Units completed and transferred out
420000
0
Percentage of completion= Units completed and transferred out/Total in
Units processed*100 82.35%
Normal spoilage units during manufacturing 25000
Normal spoilage % 20.00%
Actual Spoilage 840000
Total Work in process (units) - 30 November= Total in process –
completed – Spoilage 60000
-In conversion process 24000
-Remaining WIP 36000
Equivalent Units = total Closing WIP * % of completion
49411.7
6
(ii): Total cost of finished goods
Direct Material Cost 0.5
conversion cost per equivalent unit 0.8
Conversion Cost= Units in conversion* Conversion cost 19200
Cost of remaining Units in WIP= Remaining Units* Direct material cost 28800
Total Cost of finished goods 48000
(iii) Total cost of finished good for the month of November
Cost of Spoilage units= Spoilage units*direct material cost per unit 12500
Then New cost of goods sold 35500
(e): Allocation of cost to support department to manufacturing line 1 and 2
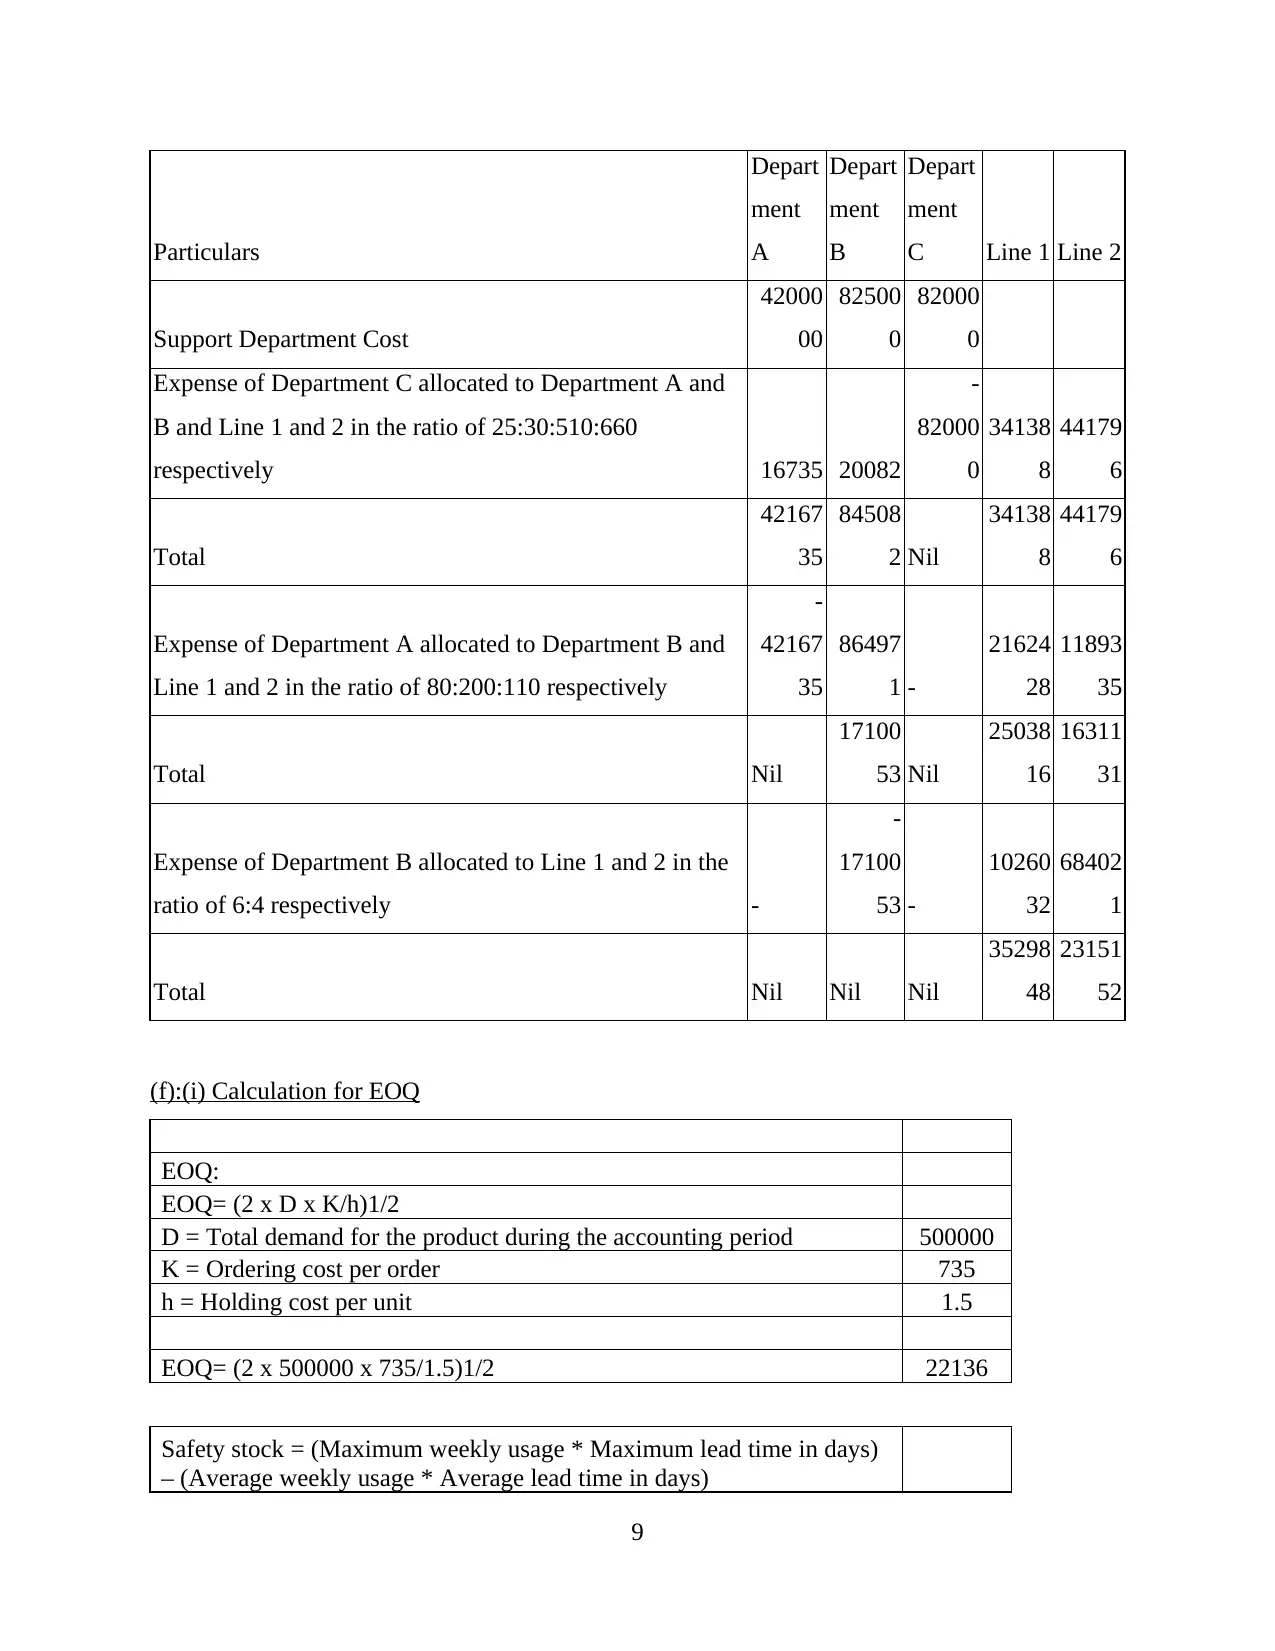
Particulars
Depart
ment
A
Depart
ment
B
Depart
ment
C Line 1 Line 2
Support Department Cost
42000
00
82500
0
82000
0
Expense of Department C allocated to Department A and
B and Line 1 and 2 in the ratio of 25:30:510:660
respectively 16735 20082
-
82000
0
34138
8
44179
6
Total
42167
35
84508
2 Nil
34138
8
44179
6
Expense of Department A allocated to Department B and
Line 1 and 2 in the ratio of 80:200:110 respectively
-
42167
35
86497
1 -
21624
28
11893
35
Total Nil
17100
53 Nil
25038
16
16311
31
Expense of Department B allocated to Line 1 and 2 in the
ratio of 6:4 respectively -
-
17100
53 -
10260
32
68402
1
Total Nil Nil Nil
35298
48
23151
52
(f):(i) Calculation for EOQ
EOQ:
EOQ= (2 x D x K/h)1/2
D = Total demand for the product during the accounting period 500000
K = Ordering cost per order 735
h = Holding cost per unit 1.5
EOQ= (2 x 500000 x 735/1.5)1/2 22136
Safety stock = (Maximum weekly usage * Maximum lead time in days)
– (Average weekly usage * Average lead time in days)
9
Depart
ment
A
Depart
ment
B
Depart
ment
C Line 1 Line 2
Support Department Cost
42000
00
82500
0
82000
0
Expense of Department C allocated to Department A and
B and Line 1 and 2 in the ratio of 25:30:510:660
respectively 16735 20082
-
82000
0
34138
8
44179
6
Total
42167
35
84508
2 Nil
34138
8
44179
6
Expense of Department A allocated to Department B and
Line 1 and 2 in the ratio of 80:200:110 respectively
-
42167
35
86497
1 -
21624
28
11893
35
Total Nil
17100
53 Nil
25038
16
16311
31
Expense of Department B allocated to Line 1 and 2 in the
ratio of 6:4 respectively -
-
17100
53 -
10260
32
68402
1
Total Nil Nil Nil
35298
48
23151
52
(f):(i) Calculation for EOQ
EOQ:
EOQ= (2 x D x K/h)1/2
D = Total demand for the product during the accounting period 500000
K = Ordering cost per order 735
h = Holding cost per unit 1.5
EOQ= (2 x 500000 x 735/1.5)1/2 22136
Safety stock = (Maximum weekly usage * Maximum lead time in days)
– (Average weekly usage * Average lead time in days)
9
⊘ This is a preview!⊘
Do you want full access?
Subscribe today to unlock all pages.
Trusted by 1+ million students worldwide
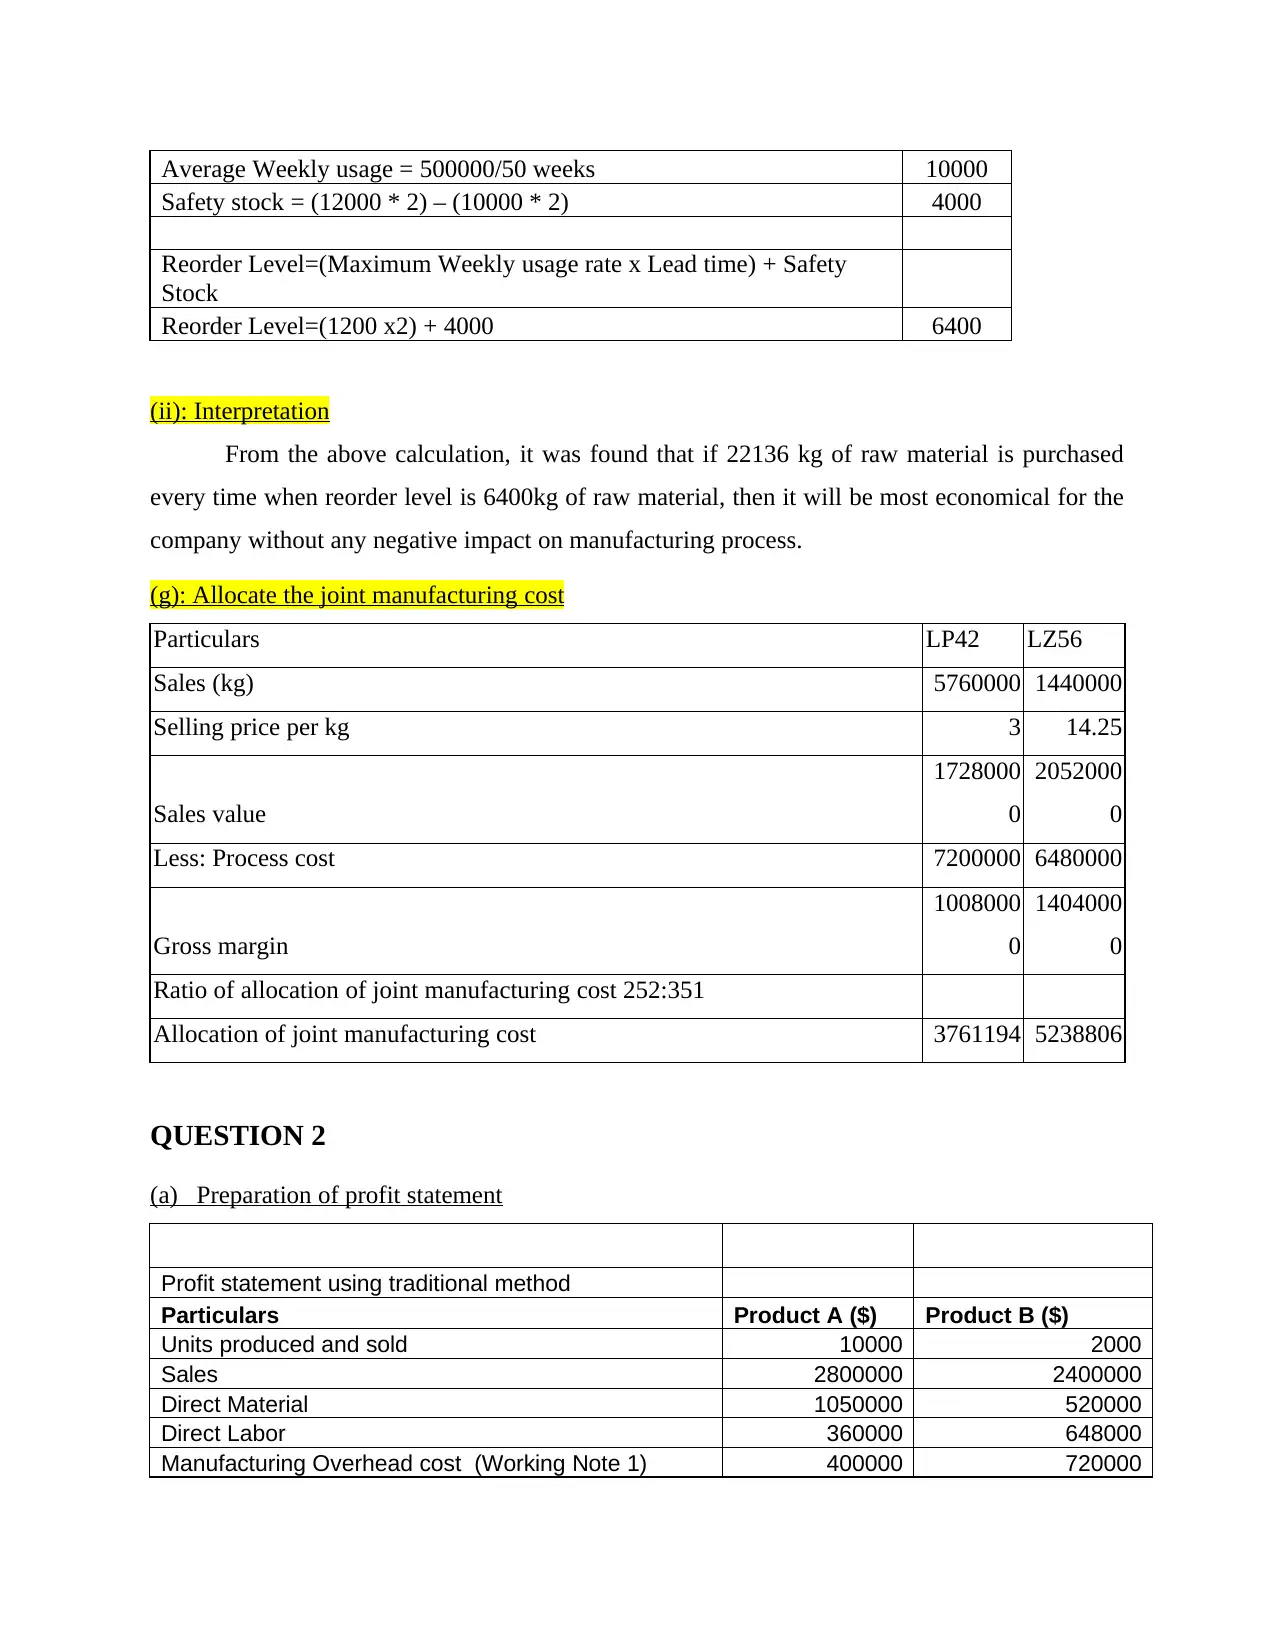
Average Weekly usage = 500000/50 weeks 10000
Safety stock = (12000 * 2) – (10000 * 2) 4000
Reorder Level=(Maximum Weekly usage rate x Lead time) + Safety
Stock
Reorder Level=(1200 x2) + 4000 6400
(ii): Interpretation
From the above calculation, it was found that if 22136 kg of raw material is purchased
every time when reorder level is 6400kg of raw material, then it will be most economical for the
company without any negative impact on manufacturing process.
(g): Allocate the joint manufacturing cost
Particulars LP42 LZ56
Sales (kg) 5760000 1440000
Selling price per kg 3 14.25
Sales value
1728000
0
2052000
0
Less: Process cost 7200000 6480000
Gross margin
1008000
0
1404000
0
Ratio of allocation of joint manufacturing cost 252:351
Allocation of joint manufacturing cost 3761194 5238806
QUESTION 2
(a) Preparation of profit statement
Profit statement using traditional method
Particulars Product A ($) Product B ($)
Units produced and sold 10000 2000
Sales 2800000 2400000
Direct Material 1050000 520000
Direct Labor 360000 648000
Manufacturing Overhead cost (Working Note 1) 400000 720000
Paraphrase This Document
Need a fresh take? Get an instant paraphrase of this document with our AI Paraphraser
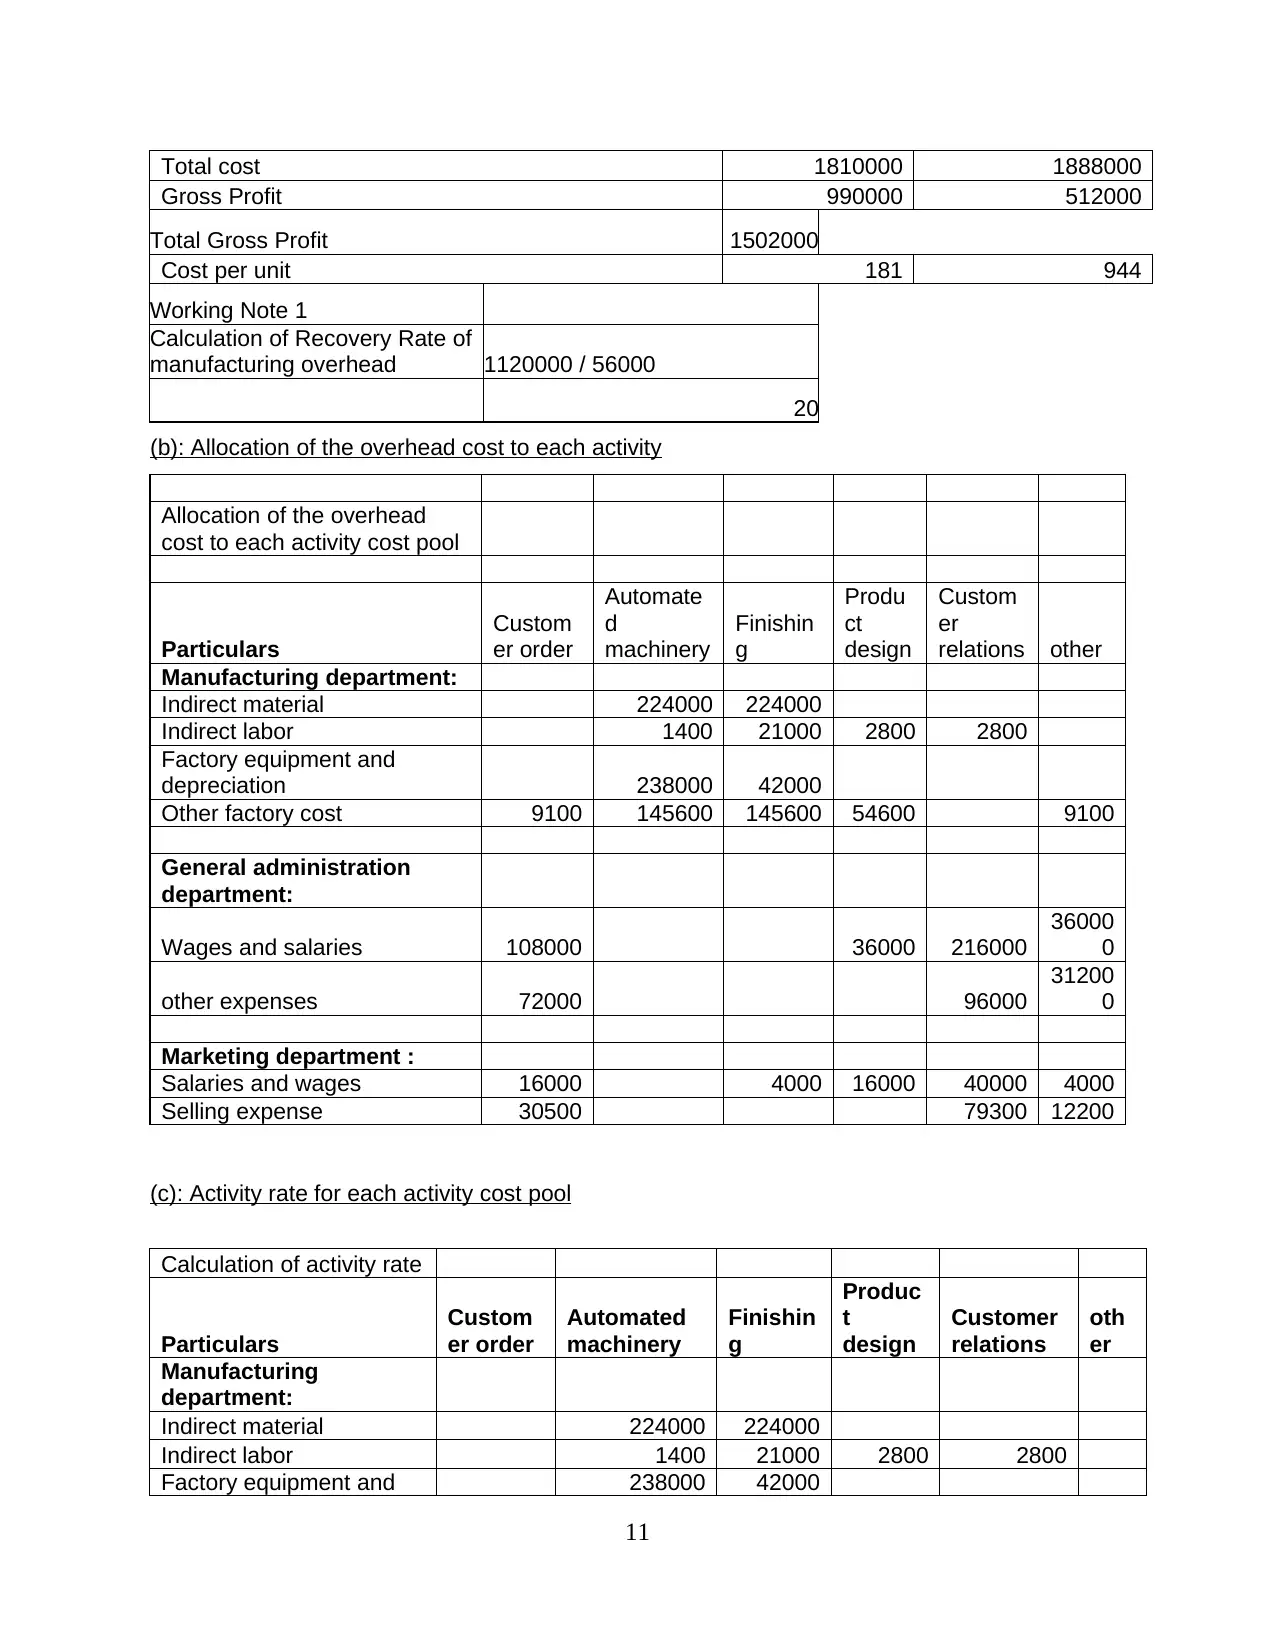
Total cost 1810000 1888000
Gross Profit 990000 512000
Total Gross Profit 1502000
Cost per unit 181 944
Working Note 1
Calculation of Recovery Rate of
manufacturing overhead 1120000 / 56000
20
(b): Allocation of the overhead cost to each activity
Allocation of the overhead
cost to each activity cost pool
Particulars
Custom
er order
Automate
d
machinery
Finishin
g
Produ
ct
design
Custom
er
relations other
Manufacturing department:
Indirect material 224000 224000
Indirect labor 1400 21000 2800 2800
Factory equipment and
depreciation 238000 42000
Other factory cost 9100 145600 145600 54600 9100
General administration
department:
Wages and salaries 108000 36000 216000
36000
0
other expenses 72000 96000
31200
0
Marketing department :
Salaries and wages 16000 4000 16000 40000 4000
Selling expense 30500 79300 12200
(c): Activity rate for each activity cost pool
Calculation of activity rate
Particulars
Custom
er order
Automated
machinery
Finishin
g
Produc
t
design
Customer
relations
oth
er
Manufacturing
department:
Indirect material 224000 224000
Indirect labor 1400 21000 2800 2800
Factory equipment and 238000 42000
11
depreciation
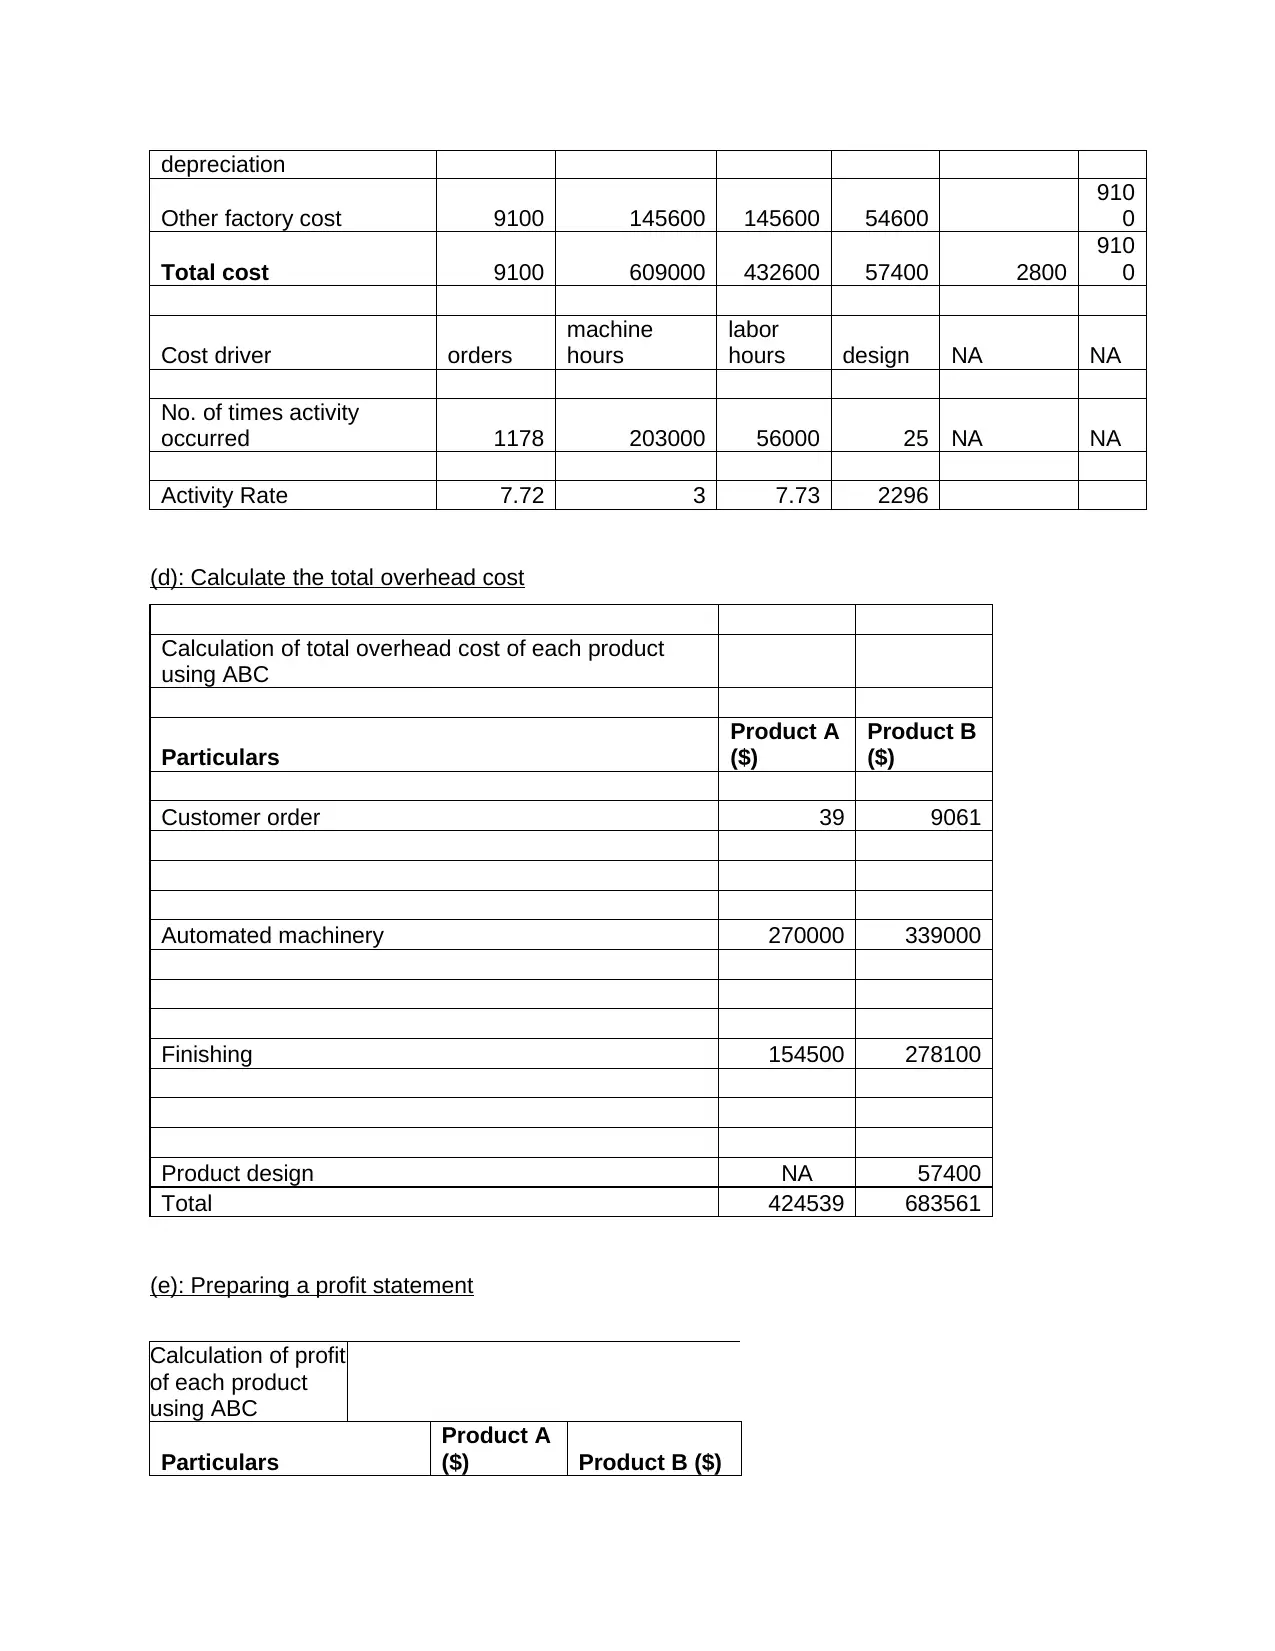
Other factory cost 9100 145600 145600 54600
910
0
Total cost 9100 609000 432600 57400 2800
910
0
Cost driver orders
machine
hours
labor
hours design NA NA
No. of times activity
occurred 1178 203000 56000 25 NA NA
Activity Rate 7.72 3 7.73 2296
(d): Calculate the total overhead cost
Calculation of total overhead cost of each product
using ABC
Particulars
Product A
($)
Product B
($)
Customer order 39 9061
Automated machinery 270000 339000
Finishing 154500 278100
Product design NA 57400
Total 424539 683561
(e): Preparing a profit statement
Calculation of profit
of each product
using ABC
Particulars
Product A
($) Product B ($)
⊘ This is a preview!⊘
Do you want full access?
Subscribe today to unlock all pages.
Trusted by 1+ million students worldwide
1 out of 19
Related Documents


Your All-in-One AI-Powered Toolkit for Academic Success.
+13062052269
info@desklib.com
Available 24*7 on WhatsApp / Email
![[object Object]](/_next/static/media/star-bottom.7253800d.svg)
Unlock your academic potential
Copyright © 2020–2026 A2Z Services. All Rights Reserved. Developed and managed by ZUCOL.