Management Accounting Report: Budgeting and Investment
VerifiedAdded on 2021/05/31
|14
|1441
|26
Report
AI Summary
This report analyzes a management accounting assignment, focusing on the preparation of a master budget, investment decisions, and the comparison of participative and imposed budgetary approaches. Part A details the components of a master budget, including sales, production, direct labor, purchase, direct material, manufacturing overhead, cash, cost of goods manufactured, and income statements. Part B assesses an investment decision made by a production manager, evaluating its impact through budget analysis. The analysis reveals declining sales and potential losses, suggesting the investment plan might not be viable. Part C contrasts participative and imposed budgetary approaches, highlighting the benefits of the participative method for flexibility and employee involvement, advocating for its use by the sales and production manager to formulate an appropriate budget. The report references key academic sources to support its findings and recommendations.
Running head: MANAGEMENT ACCOUNTING
Management Accounting
Name of the Student:
Name of the University:
Author’s Note:
Management Accounting
Name of the Student:
Name of the University:
Author’s Note:
Paraphrase This Document
Need a fresh take? Get an instant paraphrase of this document with our AI Paraphraser
1
MANAGEMENT ACCOUNTING
Table of Contents
Part A...............................................................................................................................................2
Preparation of Master Budget......................................................................................................2
Part B.............................................................................................................................................10
Investment Decision..................................................................................................................10
Part C.............................................................................................................................................12
Participative and Imposed Budgetary Approach.......................................................................12
Reference.......................................................................................................................................13
2
MANAGEMENT ACCOUNTING
Part A
Preparation of Master Budget
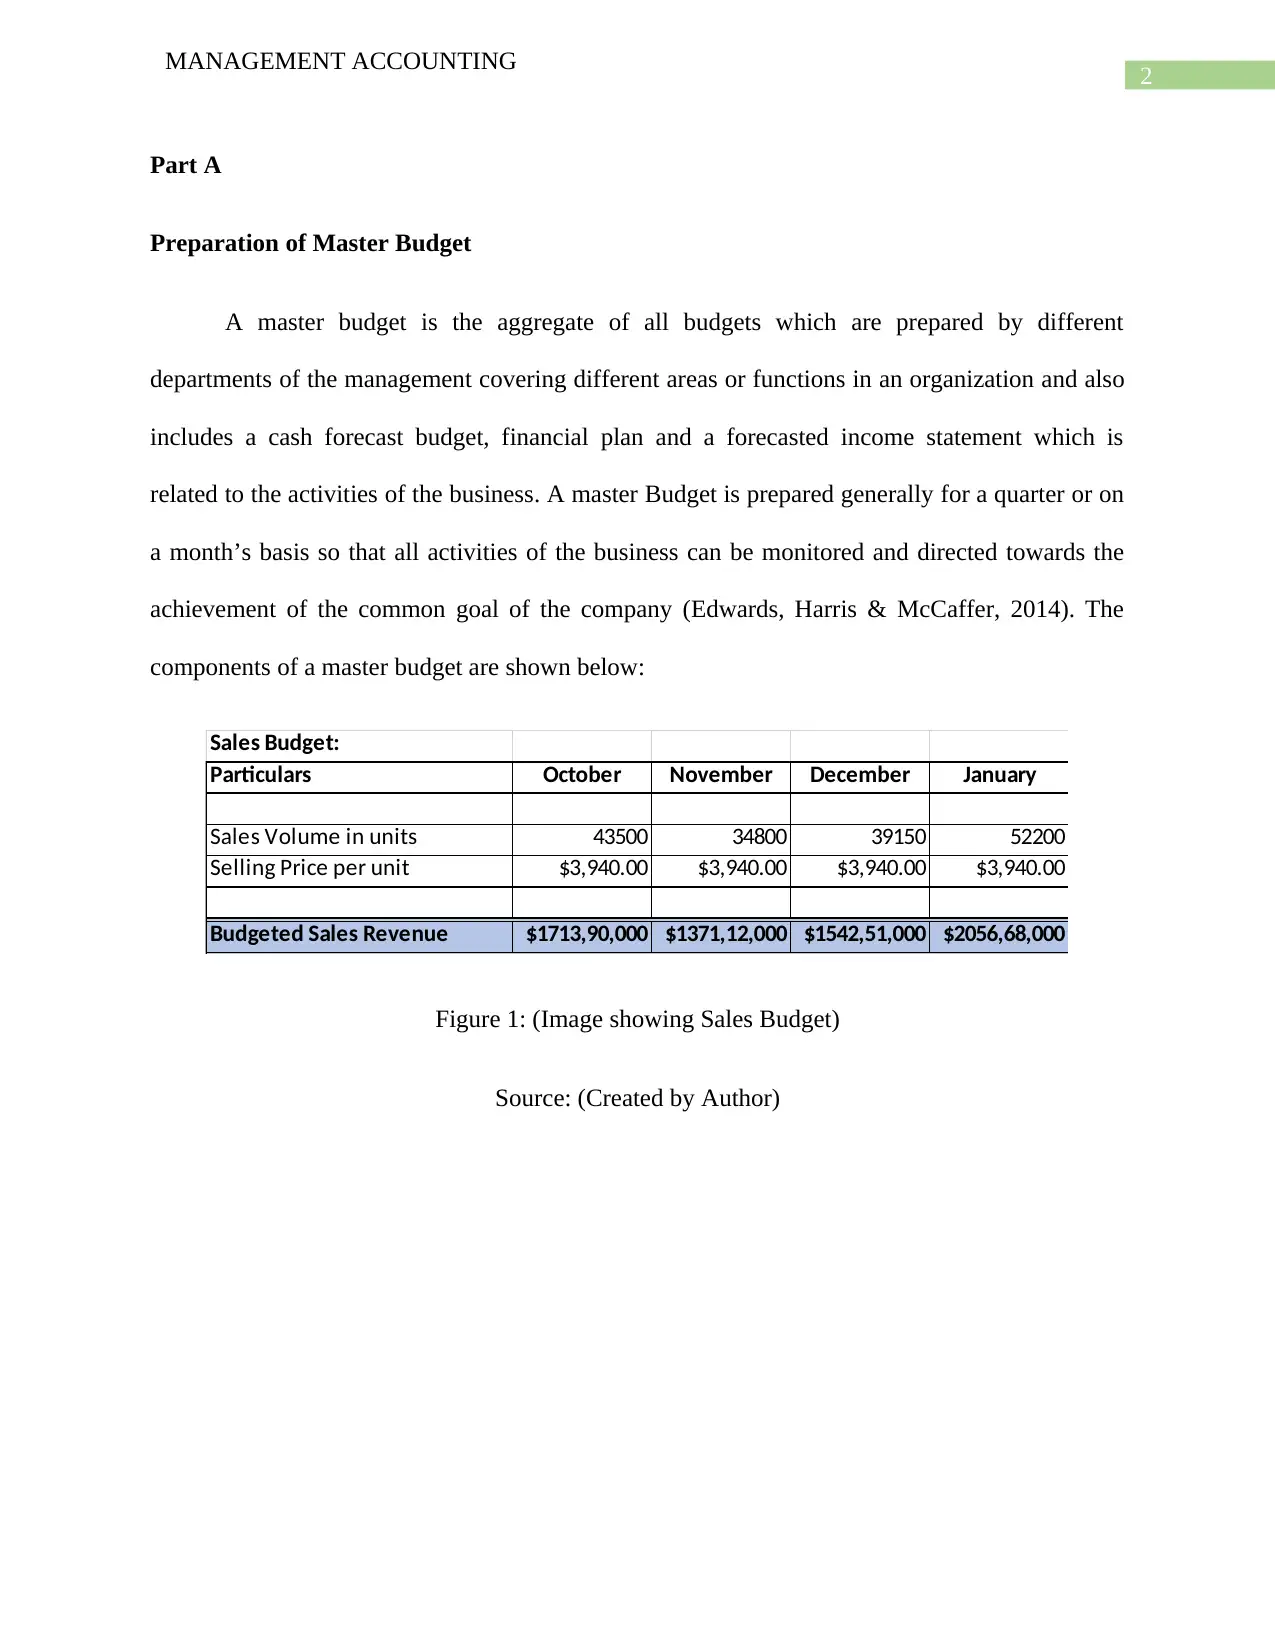
A master budget is the aggregate of all budgets which are prepared by different
departments of the management covering different areas or functions in an organization and also
includes a cash forecast budget, financial plan and a forecasted income statement which is
related to the activities of the business. A master Budget is prepared generally for a quarter or on
a month’s basis so that all activities of the business can be monitored and directed towards the
achievement of the common goal of the company (Edwards, Harris & McCaffer, 2014). The
components of a master budget are shown below:
Sales Budget:
Particulars October November December January
Sales Volume in units 43500 34800 39150 52200
Selling Price per unit $3,940.00 $3,940.00 $3,940.00 $3,940.00
Budgeted Sales Revenue $1713,90,000 $1371,12,000 $1542,51,000 $2056,68,000
Figure 1: (Image showing Sales Budget)
Source: (Created by Author)
MANAGEMENT ACCOUNTING
Part A
Preparation of Master Budget
A master budget is the aggregate of all budgets which are prepared by different
departments of the management covering different areas or functions in an organization and also
includes a cash forecast budget, financial plan and a forecasted income statement which is
related to the activities of the business. A master Budget is prepared generally for a quarter or on
a month’s basis so that all activities of the business can be monitored and directed towards the
achievement of the common goal of the company (Edwards, Harris & McCaffer, 2014). The
components of a master budget are shown below:
Sales Budget:
Particulars October November December January
Sales Volume in units 43500 34800 39150 52200
Selling Price per unit $3,940.00 $3,940.00 $3,940.00 $3,940.00
Budgeted Sales Revenue $1713,90,000 $1371,12,000 $1542,51,000 $2056,68,000
Figure 1: (Image showing Sales Budget)
Source: (Created by Author)
⊘ This is a preview!⊘
Do you want full access?
Subscribe today to unlock all pages.
Trusted by 1+ million students worldwide
3
MANAGEMENT ACCOUNTING
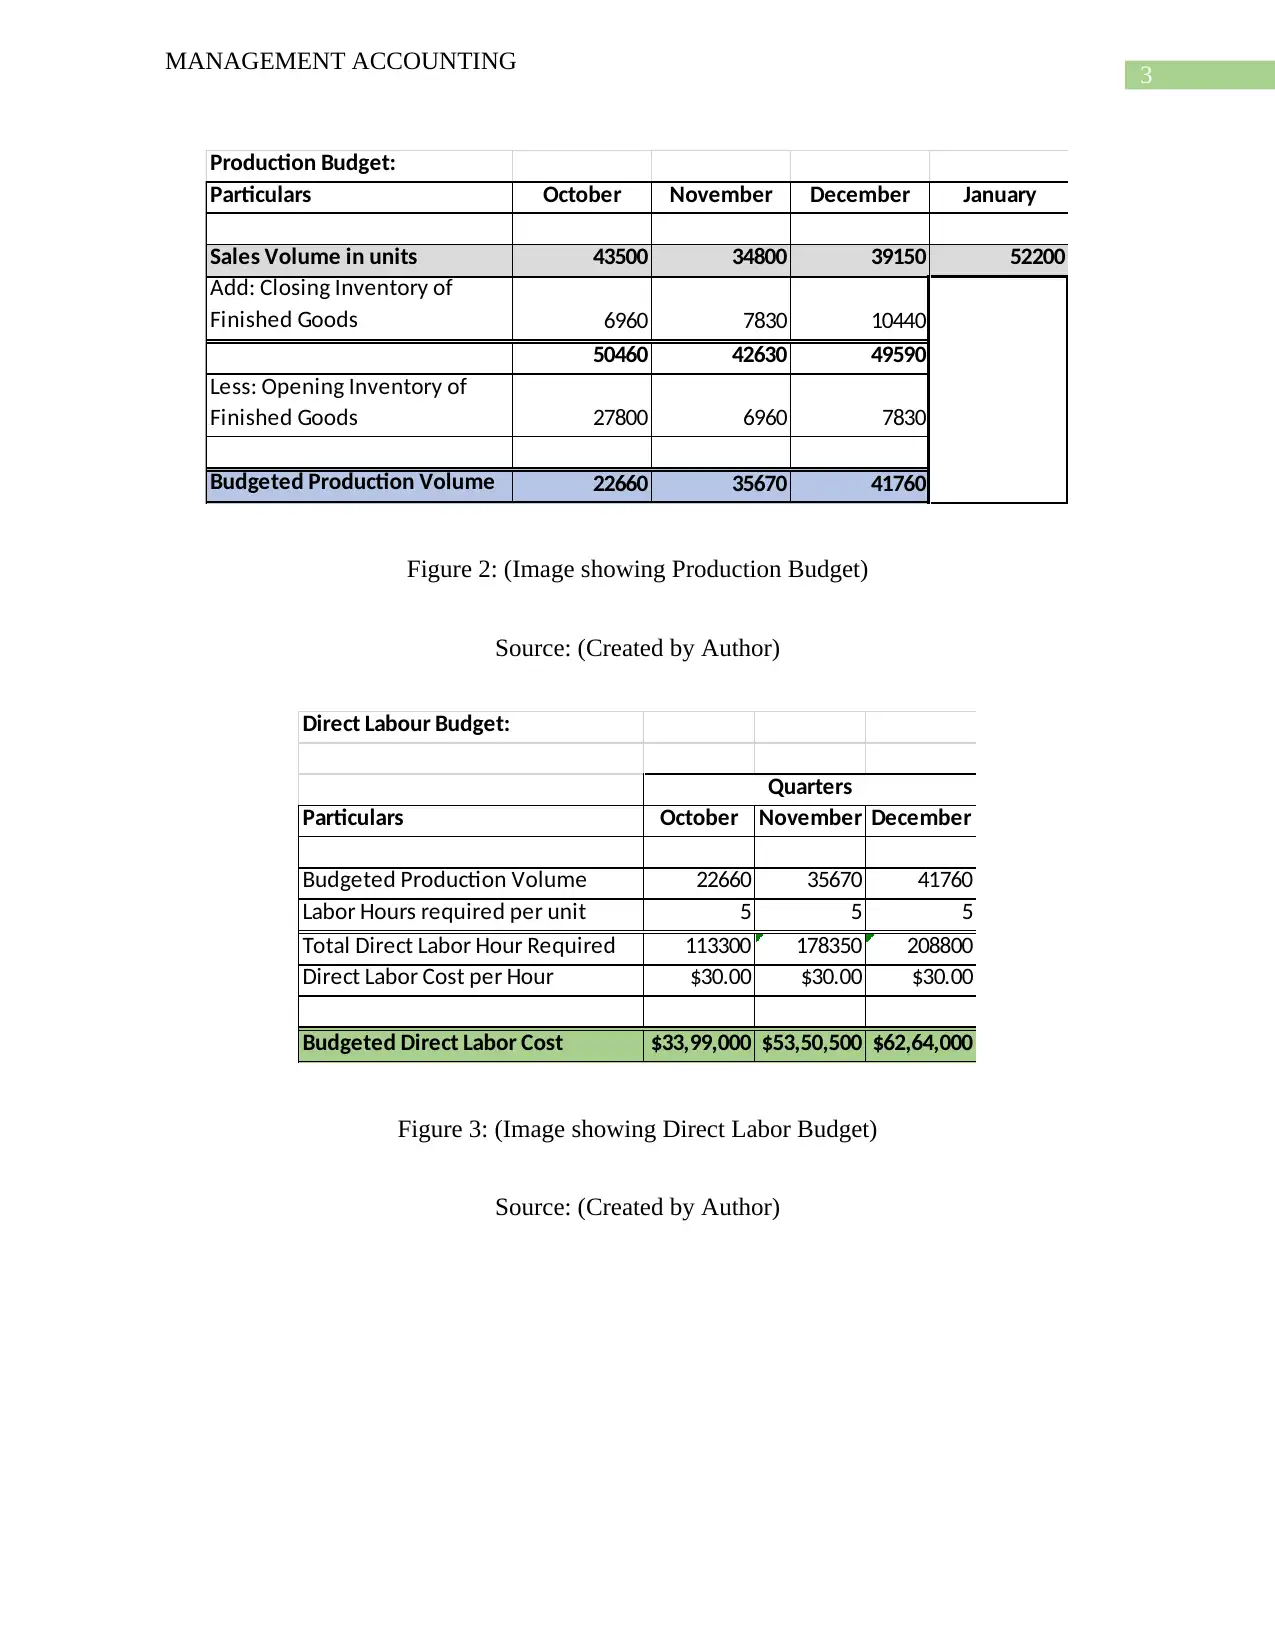
Production Budget:
Particulars October November December January
Sales Volume in units 43500 34800 39150 52200
Add: Closing Inventory of
Finished Goods 6960 7830 10440
50460 42630 49590
Less: Opening Inventory of
Finished Goods 27800 6960 7830
Budgeted Production Volume 22660 35670 41760
Figure 2: (Image showing Production Budget)
Source: (Created by Author)
Direct Labour Budget:
Particulars October November December
Budgeted Production Volume 22660 35670 41760
Labor Hours required per unit 5 5 5
Total Direct Labor Hour Required 113300 178350 208800
Direct Labor Cost per Hour $30.00 $30.00 $30.00
Budgeted Direct Labor Cost $33,99,000 $53,50,500 $62,64,000
Quarters
Figure 3: (Image showing Direct Labor Budget)
Source: (Created by Author)
MANAGEMENT ACCOUNTING
Production Budget:
Particulars October November December January
Sales Volume in units 43500 34800 39150 52200
Add: Closing Inventory of
Finished Goods 6960 7830 10440
50460 42630 49590
Less: Opening Inventory of
Finished Goods 27800 6960 7830
Budgeted Production Volume 22660 35670 41760
Figure 2: (Image showing Production Budget)
Source: (Created by Author)
Direct Labour Budget:
Particulars October November December
Budgeted Production Volume 22660 35670 41760
Labor Hours required per unit 5 5 5
Total Direct Labor Hour Required 113300 178350 208800
Direct Labor Cost per Hour $30.00 $30.00 $30.00
Budgeted Direct Labor Cost $33,99,000 $53,50,500 $62,64,000
Quarters
Figure 3: (Image showing Direct Labor Budget)
Source: (Created by Author)
Paraphrase This Document
Need a fresh take? Get an instant paraphrase of this document with our AI Paraphraser

4
MANAGEMENT ACCOUNTING
Purchase Budget:
Particulars October November December January
Budgeted Sales Volume 43500 34800 39150 52200
Budgeted Production Volume 22660 35670 41760
Sensors required per unit 3 3 3
Total Sensors Required 67980 107010 125280
Add: Closing Inventory of Sensors 62640 70470 93960
130620 177480 219240
Less: Opening Inventory of Sensors 78300 62640 70470
Budgeted Purchase Volume (in units) 52320 114840 148770
Sensors Cost per unit $52.00 $52.00 $52.00
Total Cost of Sensors $27,20,640 $59,71,680 $77,36,040
Gears required per unit 3 3 3 3
Total Gears Required 67980 107010 125280
Add: Closing Inventory of Gears 62640 70470 93960
130620 177480 219240
Less: Opening Inventory of Gears 78300 62640 70470
Budgeted Purchase Volume (in units) 52320 114840 148770
Gears Cost per unit $70.00 $70.00 $70.00
Total Cost of Gears $47,58,600 $74,90,700 $87,69,600
Budgeted Direct Material Purchase $74,79,240 $134,62,380 $165,05,640
Figure 4: (Image showing Purchase Budget)
Source: (Created by Author)
5
MANAGEMENT ACCOUNTING
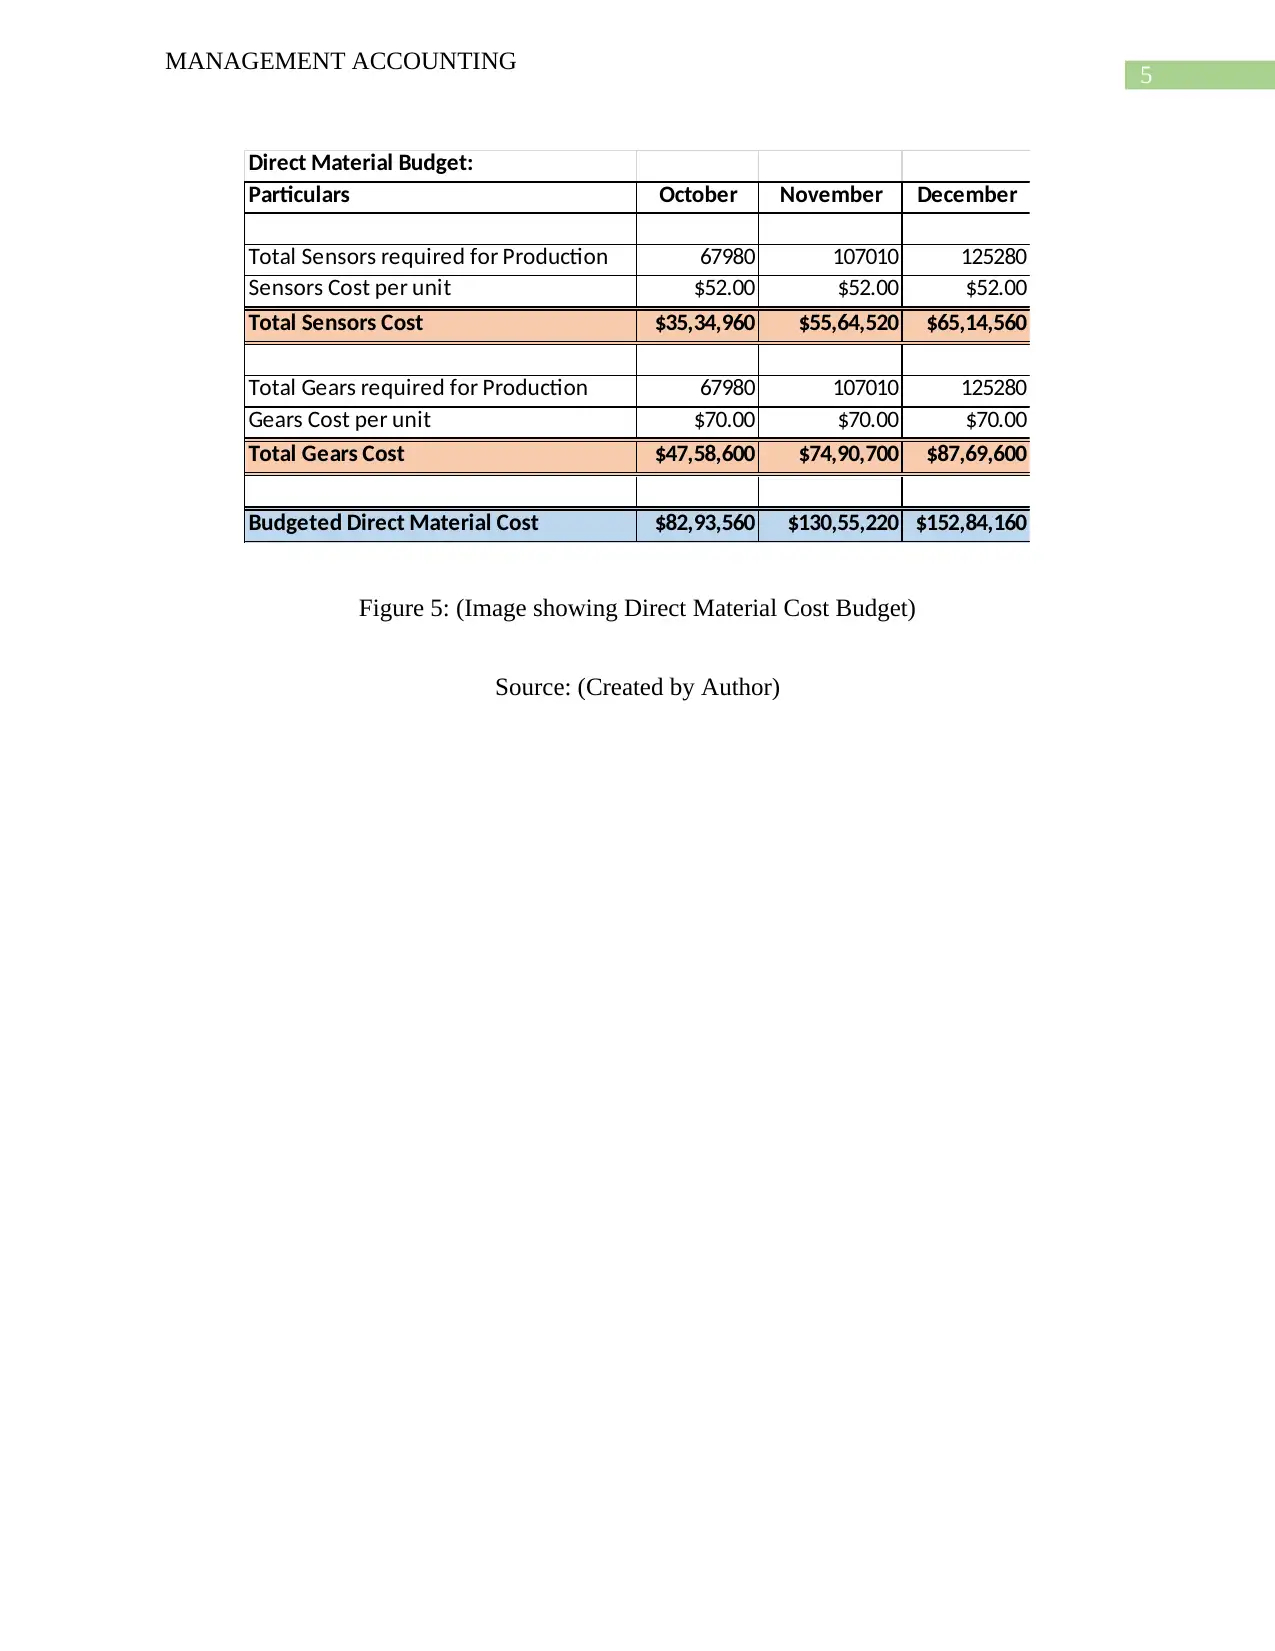
Direct Material Budget:
Particulars October November December
Total Sensors required for Production 67980 107010 125280
Sensors Cost per unit $52.00 $52.00 $52.00
Total Sensors Cost $35,34,960 $55,64,520 $65,14,560
Total Gears required for Production 67980 107010 125280
Gears Cost per unit $70.00 $70.00 $70.00
Total Gears Cost $47,58,600 $74,90,700 $87,69,600
Budgeted Direct Material Cost $82,93,560 $130,55,220 $152,84,160
Figure 5: (Image showing Direct Material Cost Budget)
Source: (Created by Author)
MANAGEMENT ACCOUNTING
Direct Material Budget:
Particulars October November December
Total Sensors required for Production 67980 107010 125280
Sensors Cost per unit $52.00 $52.00 $52.00
Total Sensors Cost $35,34,960 $55,64,520 $65,14,560
Total Gears required for Production 67980 107010 125280
Gears Cost per unit $70.00 $70.00 $70.00
Total Gears Cost $47,58,600 $74,90,700 $87,69,600
Budgeted Direct Material Cost $82,93,560 $130,55,220 $152,84,160
Figure 5: (Image showing Direct Material Cost Budget)
Source: (Created by Author)
⊘ This is a preview!⊘
Do you want full access?
Subscribe today to unlock all pages.
Trusted by 1+ million students worldwide
6
MANAGEMENT ACCOUNTING
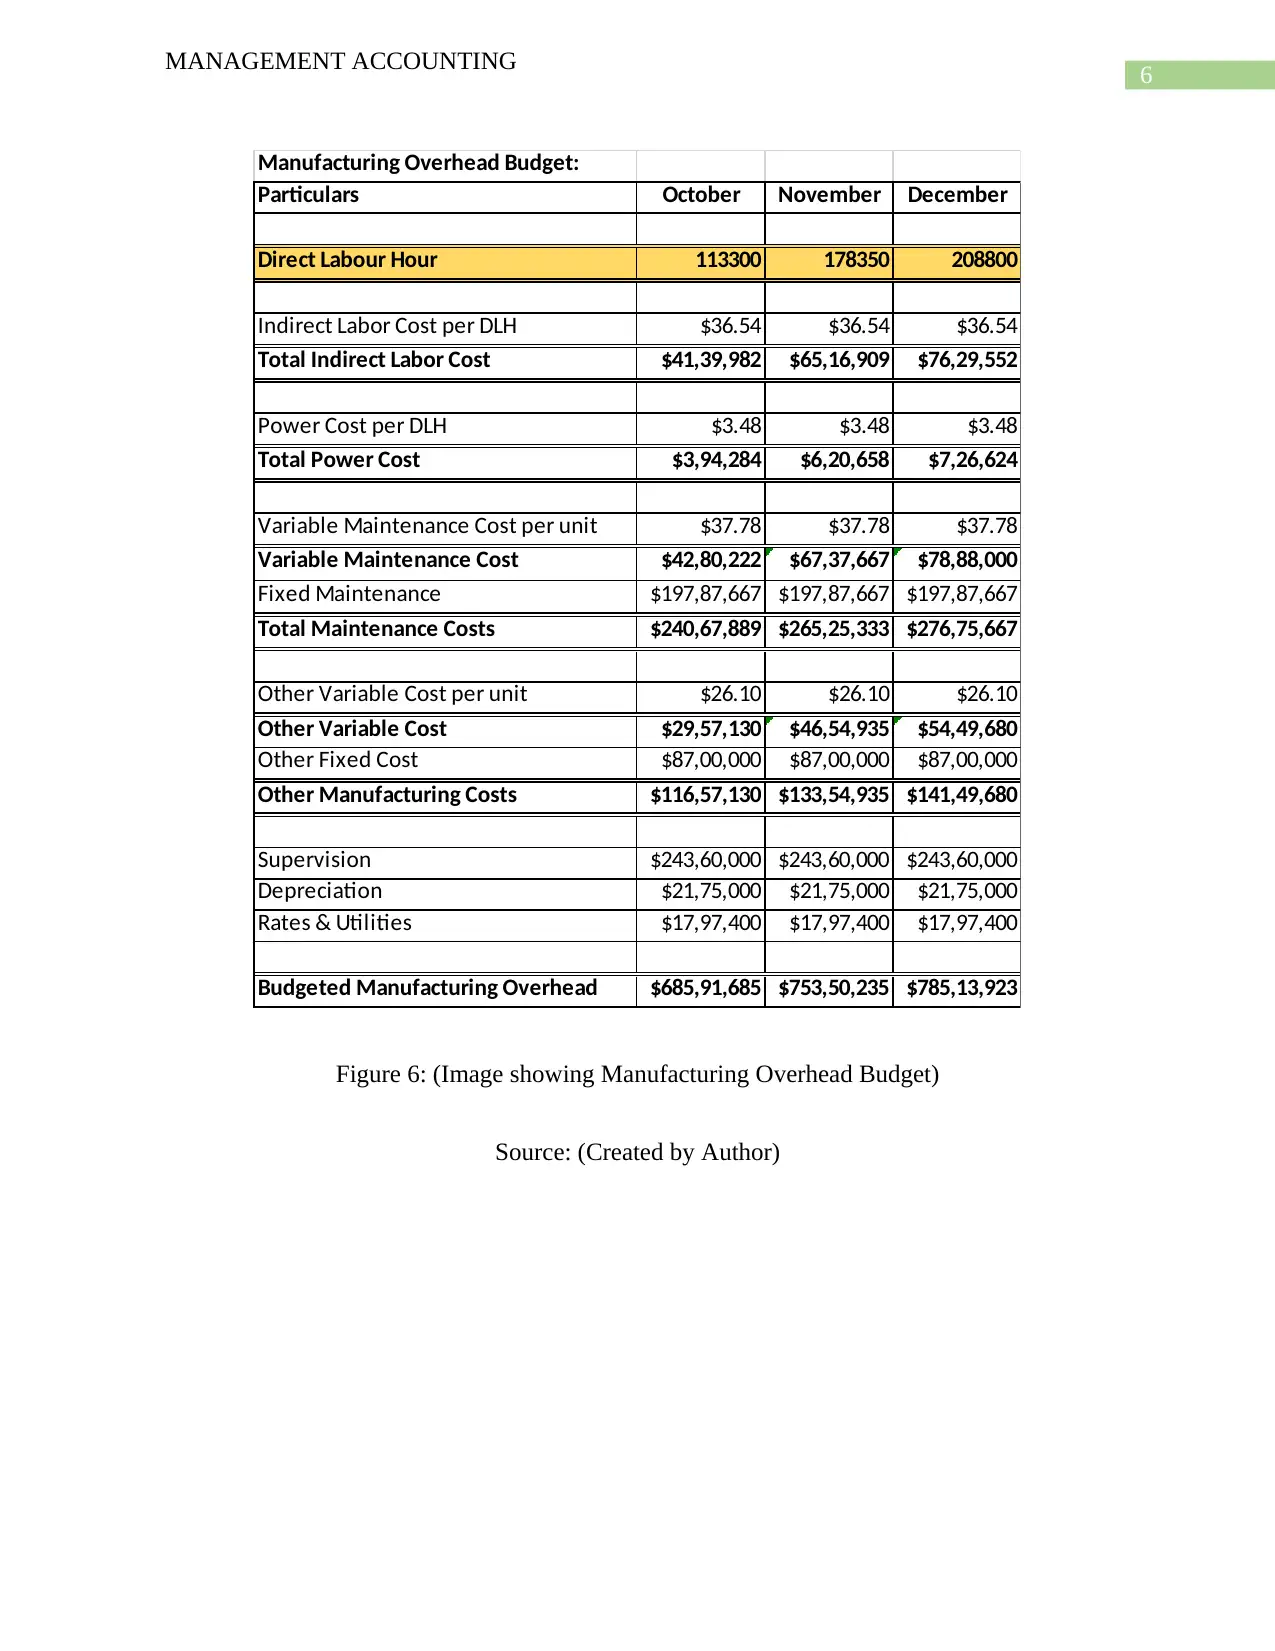
Manufacturing Overhead Budget:
Particulars October November December
Direct Labour Hour 113300 178350 208800
Indirect Labor Cost per DLH $36.54 $36.54 $36.54
Total Indirect Labor Cost $41,39,982 $65,16,909 $76,29,552
Power Cost per DLH $3.48 $3.48 $3.48
Total Power Cost $3,94,284 $6,20,658 $7,26,624
Variable Maintenance Cost per unit $37.78 $37.78 $37.78
Variable Maintenance Cost $42,80,222 $67,37,667 $78,88,000
Fixed Maintenance $197,87,667 $197,87,667 $197,87,667
Total Maintenance Costs $240,67,889 $265,25,333 $276,75,667
Other Variable Cost per unit $26.10 $26.10 $26.10
Other Variable Cost $29,57,130 $46,54,935 $54,49,680
Other Fixed Cost $87,00,000 $87,00,000 $87,00,000
Other Manufacturing Costs $116,57,130 $133,54,935 $141,49,680
Supervision $243,60,000 $243,60,000 $243,60,000
Depreciation $21,75,000 $21,75,000 $21,75,000
Rates & Utilities $17,97,400 $17,97,400 $17,97,400
Budgeted Manufacturing Overhead $685,91,685 $753,50,235 $785,13,923
Figure 6: (Image showing Manufacturing Overhead Budget)
Source: (Created by Author)
MANAGEMENT ACCOUNTING
Manufacturing Overhead Budget:
Particulars October November December
Direct Labour Hour 113300 178350 208800
Indirect Labor Cost per DLH $36.54 $36.54 $36.54
Total Indirect Labor Cost $41,39,982 $65,16,909 $76,29,552
Power Cost per DLH $3.48 $3.48 $3.48
Total Power Cost $3,94,284 $6,20,658 $7,26,624
Variable Maintenance Cost per unit $37.78 $37.78 $37.78
Variable Maintenance Cost $42,80,222 $67,37,667 $78,88,000
Fixed Maintenance $197,87,667 $197,87,667 $197,87,667
Total Maintenance Costs $240,67,889 $265,25,333 $276,75,667
Other Variable Cost per unit $26.10 $26.10 $26.10
Other Variable Cost $29,57,130 $46,54,935 $54,49,680
Other Fixed Cost $87,00,000 $87,00,000 $87,00,000
Other Manufacturing Costs $116,57,130 $133,54,935 $141,49,680
Supervision $243,60,000 $243,60,000 $243,60,000
Depreciation $21,75,000 $21,75,000 $21,75,000
Rates & Utilities $17,97,400 $17,97,400 $17,97,400
Budgeted Manufacturing Overhead $685,91,685 $753,50,235 $785,13,923
Figure 6: (Image showing Manufacturing Overhead Budget)
Source: (Created by Author)
Paraphrase This Document
Need a fresh take? Get an instant paraphrase of this document with our AI Paraphraser

7
MANAGEMENT ACCOUNTING
Cash Collection from Debtors:
Particulars October November December
Total Sales Revenue $1713,90,000 $1371,12,000 $1542,51,000
Collection in the month of Sales $685,56,000 $548,44,800 $617,00,400
Collection in the following month of
Sales $634,21,260 $994,06,200 $795,24,960
Total Collection from Debtors $1319,77,260 $1542,51,000 $1412,25,360
Figure 7: (Image showing Total Collection from Debtors)
Source: (Created by Author)
8
MANAGEMENT ACCOUNTING
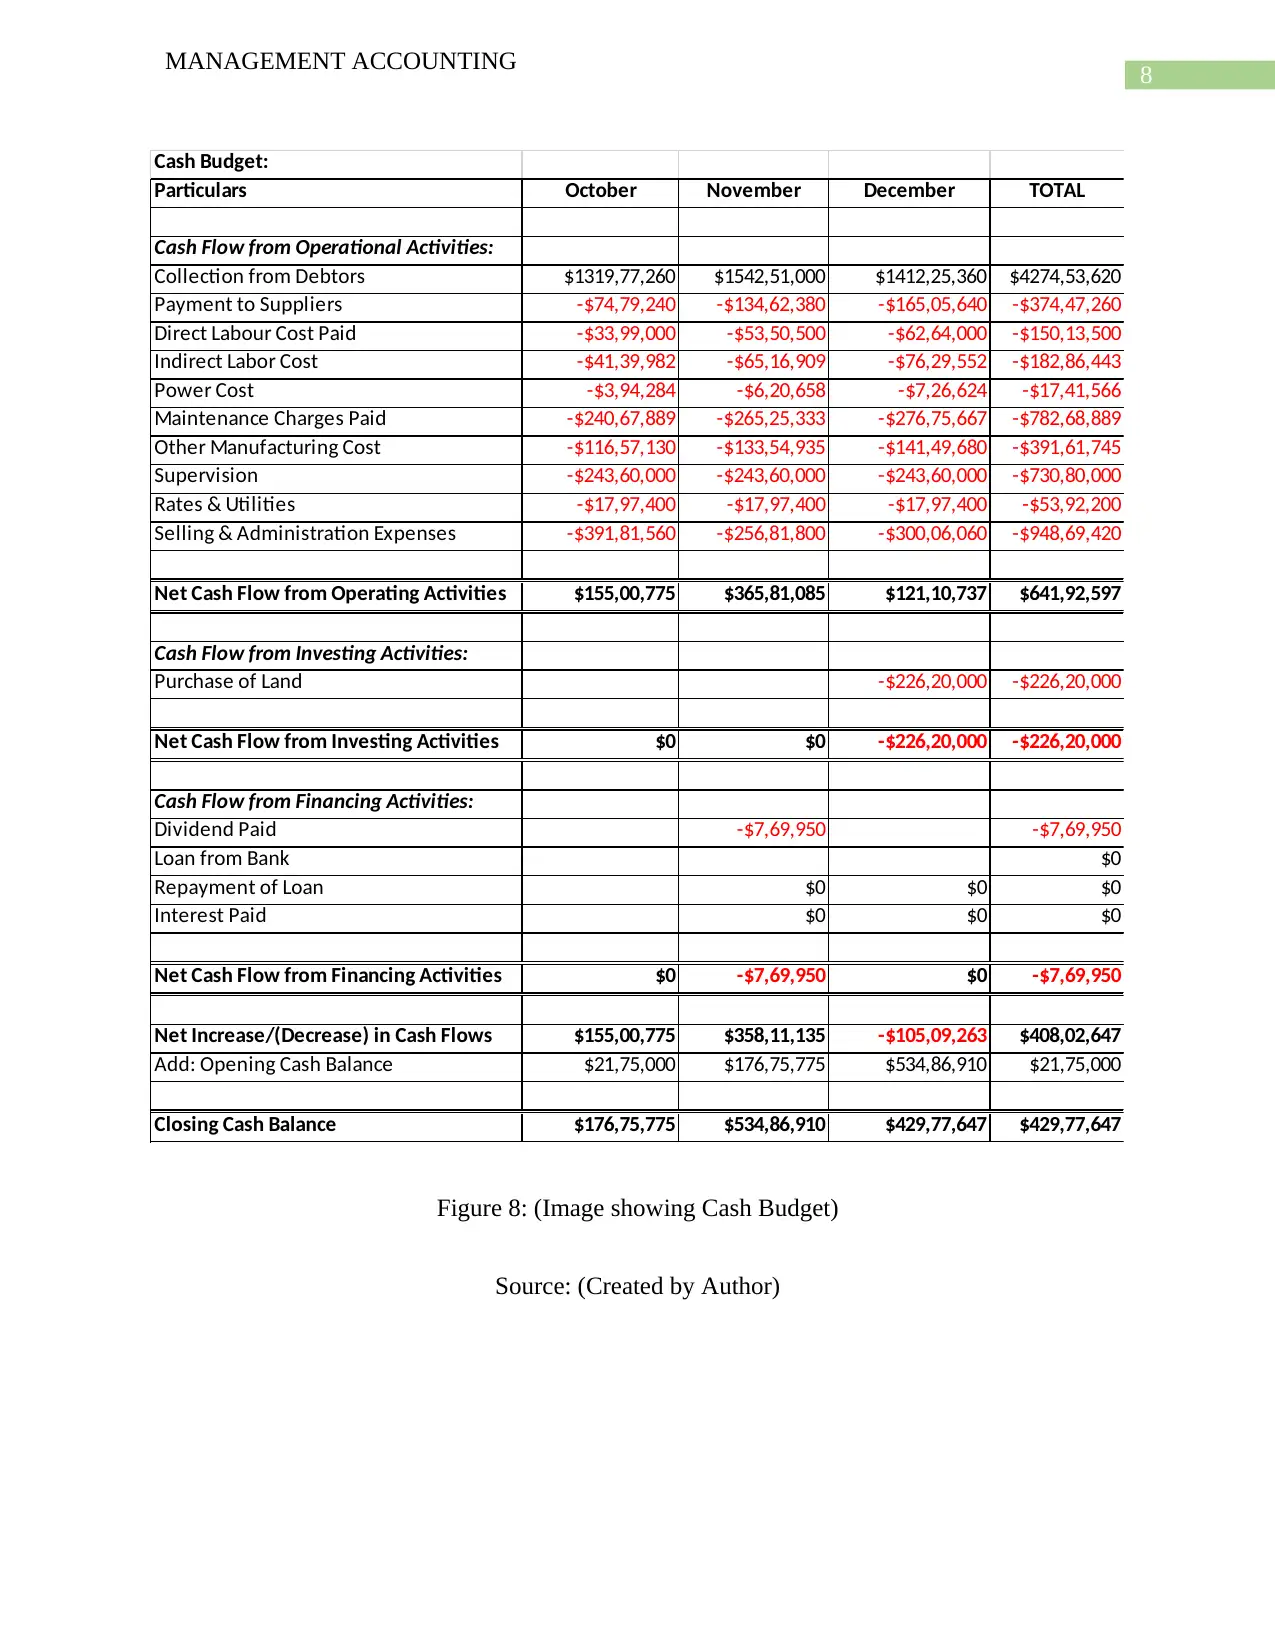
Cash Budget:
Particulars October November December TOTAL
Cash Flow from Operational Activities:
Collection from Debtors $1319,77,260 $1542,51,000 $1412,25,360 $4274,53,620
Payment to Suppliers -$74,79,240 -$134,62,380 -$165,05,640 -$374,47,260
Direct Labour Cost Paid -$33,99,000 -$53,50,500 -$62,64,000 -$150,13,500
Indirect Labor Cost -$41,39,982 -$65,16,909 -$76,29,552 -$182,86,443
Power Cost -$3,94,284 -$6,20,658 -$7,26,624 -$17,41,566
Maintenance Charges Paid -$240,67,889 -$265,25,333 -$276,75,667 -$782,68,889
Other Manufacturing Cost -$116,57,130 -$133,54,935 -$141,49,680 -$391,61,745
Supervision -$243,60,000 -$243,60,000 -$243,60,000 -$730,80,000
Rates & Utilities -$17,97,400 -$17,97,400 -$17,97,400 -$53,92,200
Selling & Administration Expenses -$391,81,560 -$256,81,800 -$300,06,060 -$948,69,420
Net Cash Flow from Operating Activities $155,00,775 $365,81,085 $121,10,737 $641,92,597
Cash Flow from Investing Activities:
Purchase of Land -$226,20,000 -$226,20,000
Net Cash Flow from Investing Activities $0 $0 -$226,20,000 -$226,20,000
Cash Flow from Financing Activities:
Dividend Paid -$7,69,950 -$7,69,950
Loan from Bank $0
Repayment of Loan $0 $0 $0
Interest Paid $0 $0 $0
Net Cash Flow from Financing Activities $0 -$7,69,950 $0 -$7,69,950
Net Increase/(Decrease) in Cash Flows $155,00,775 $358,11,135 -$105,09,263 $408,02,647
Add: Opening Cash Balance $21,75,000 $176,75,775 $534,86,910 $21,75,000
Closing Cash Balance $176,75,775 $534,86,910 $429,77,647 $429,77,647
Figure 8: (Image showing Cash Budget)
Source: (Created by Author)
MANAGEMENT ACCOUNTING
Cash Budget:
Particulars October November December TOTAL
Cash Flow from Operational Activities:
Collection from Debtors $1319,77,260 $1542,51,000 $1412,25,360 $4274,53,620
Payment to Suppliers -$74,79,240 -$134,62,380 -$165,05,640 -$374,47,260
Direct Labour Cost Paid -$33,99,000 -$53,50,500 -$62,64,000 -$150,13,500
Indirect Labor Cost -$41,39,982 -$65,16,909 -$76,29,552 -$182,86,443
Power Cost -$3,94,284 -$6,20,658 -$7,26,624 -$17,41,566
Maintenance Charges Paid -$240,67,889 -$265,25,333 -$276,75,667 -$782,68,889
Other Manufacturing Cost -$116,57,130 -$133,54,935 -$141,49,680 -$391,61,745
Supervision -$243,60,000 -$243,60,000 -$243,60,000 -$730,80,000
Rates & Utilities -$17,97,400 -$17,97,400 -$17,97,400 -$53,92,200
Selling & Administration Expenses -$391,81,560 -$256,81,800 -$300,06,060 -$948,69,420
Net Cash Flow from Operating Activities $155,00,775 $365,81,085 $121,10,737 $641,92,597
Cash Flow from Investing Activities:
Purchase of Land -$226,20,000 -$226,20,000
Net Cash Flow from Investing Activities $0 $0 -$226,20,000 -$226,20,000
Cash Flow from Financing Activities:
Dividend Paid -$7,69,950 -$7,69,950
Loan from Bank $0
Repayment of Loan $0 $0 $0
Interest Paid $0 $0 $0
Net Cash Flow from Financing Activities $0 -$7,69,950 $0 -$7,69,950
Net Increase/(Decrease) in Cash Flows $155,00,775 $358,11,135 -$105,09,263 $408,02,647
Add: Opening Cash Balance $21,75,000 $176,75,775 $534,86,910 $21,75,000
Closing Cash Balance $176,75,775 $534,86,910 $429,77,647 $429,77,647
Figure 8: (Image showing Cash Budget)
Source: (Created by Author)
⊘ This is a preview!⊘
Do you want full access?
Subscribe today to unlock all pages.
Trusted by 1+ million students worldwide
9
MANAGEMENT ACCOUNTING
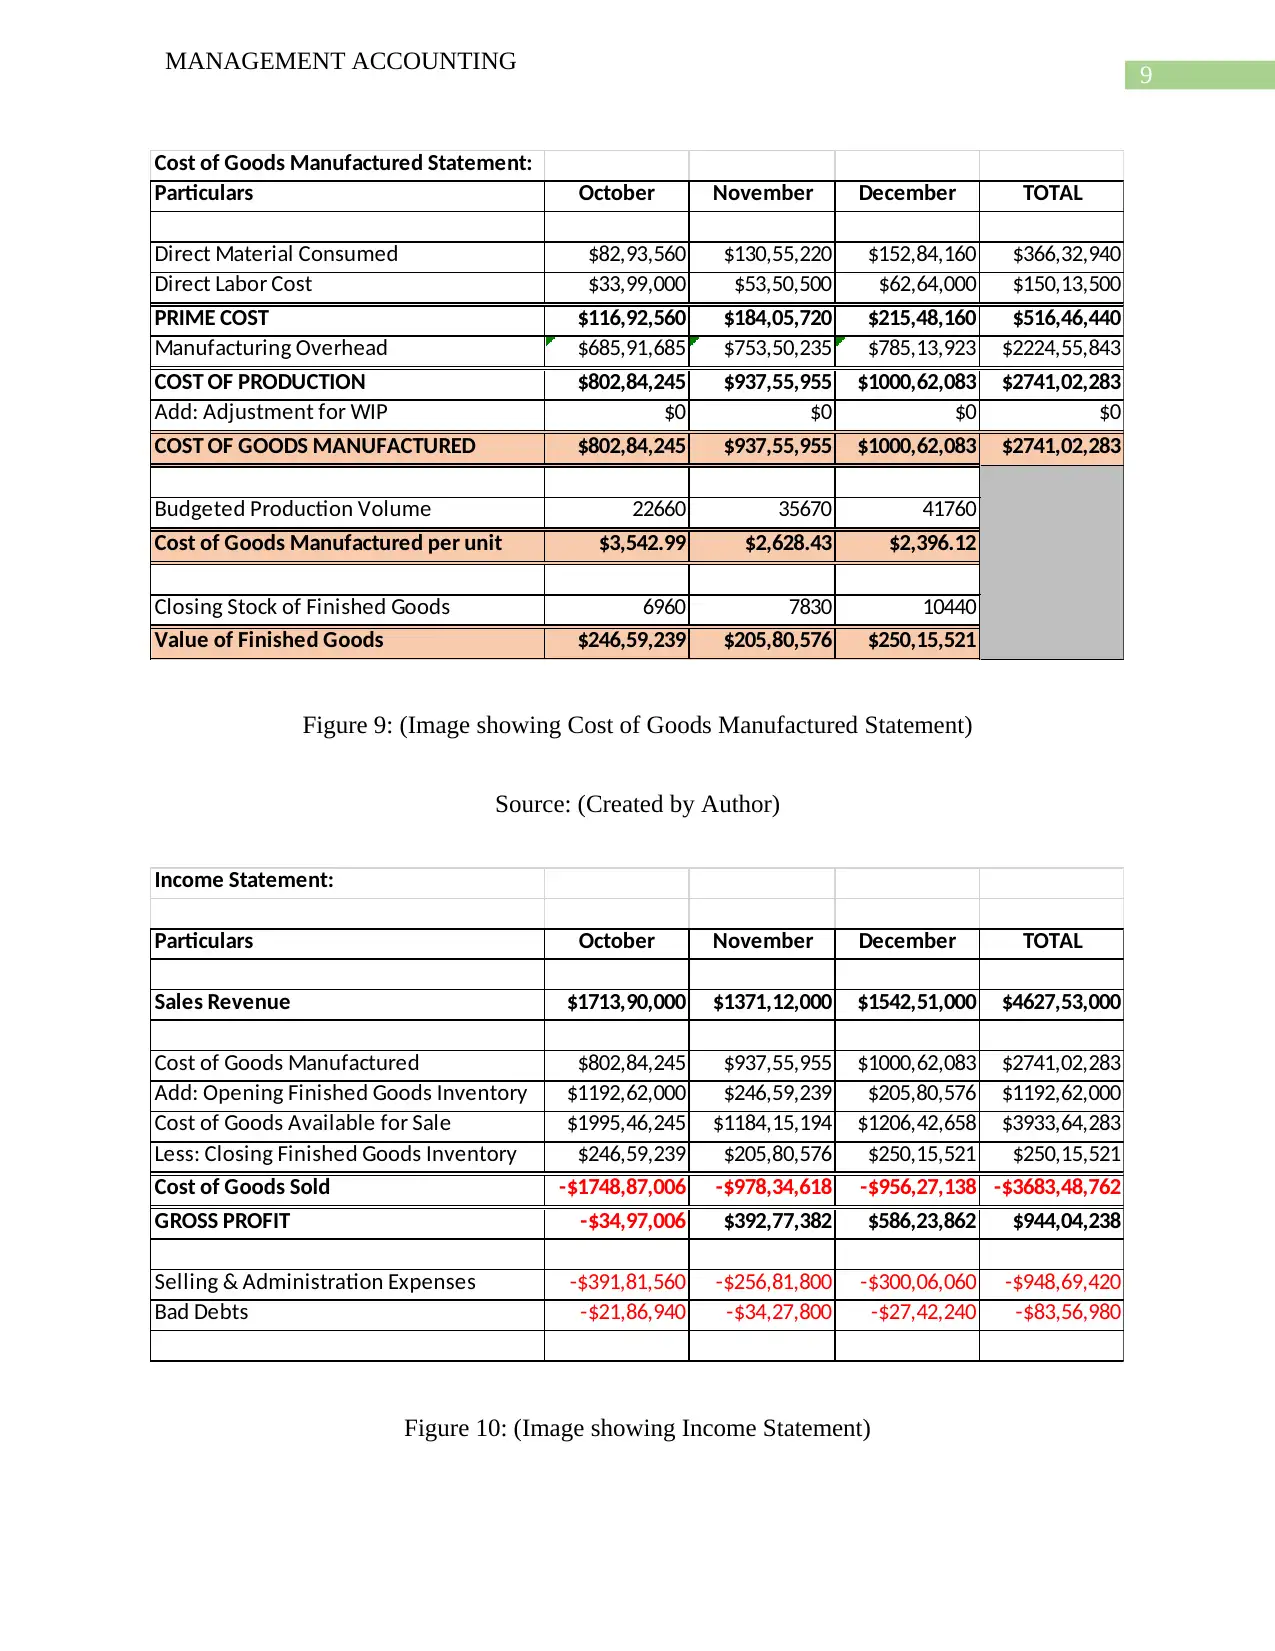
Cost of Goods Manufactured Statement:
Particulars October November December TOTAL
Direct Material Consumed $82,93,560 $130,55,220 $152,84,160 $366,32,940
Direct Labor Cost $33,99,000 $53,50,500 $62,64,000 $150,13,500
PRIME COST $116,92,560 $184,05,720 $215,48,160 $516,46,440
Manufacturing Overhead $685,91,685 $753,50,235 $785,13,923 $2224,55,843
COST OF PRODUCTION $802,84,245 $937,55,955 $1000,62,083 $2741,02,283
Add: Adjustment for WIP $0 $0 $0 $0
COST OF GOODS MANUFACTURED $802,84,245 $937,55,955 $1000,62,083 $2741,02,283
Budgeted Production Volume 22660 35670 41760
Cost of Goods Manufactured per unit $3,542.99 $2,628.43 $2,396.12
Closing Stock of Finished Goods 6960 7830 10440
Value of Finished Goods $246,59,239 $205,80,576 $250,15,521
Figure 9: (Image showing Cost of Goods Manufactured Statement)
Source: (Created by Author)
Income Statement:
Particulars October November December TOTAL
Sales Revenue $1713,90,000 $1371,12,000 $1542,51,000 $4627,53,000
Cost of Goods Manufactured $802,84,245 $937,55,955 $1000,62,083 $2741,02,283
Add: Opening Finished Goods Inventory $1192,62,000 $246,59,239 $205,80,576 $1192,62,000
Cost of Goods Available for Sale $1995,46,245 $1184,15,194 $1206,42,658 $3933,64,283
Less: Closing Finished Goods Inventory $246,59,239 $205,80,576 $250,15,521 $250,15,521
Cost of Goods Sold -$1748,87,006 -$978,34,618 -$956,27,138 -$3683,48,762
GROSS PROFIT -$34,97,006 $392,77,382 $586,23,862 $944,04,238
Selling & Administration Expenses -$391,81,560 -$256,81,800 -$300,06,060 -$948,69,420
Bad Debts -$21,86,940 -$34,27,800 -$27,42,240 -$83,56,980
Figure 10: (Image showing Income Statement)
MANAGEMENT ACCOUNTING
Cost of Goods Manufactured Statement:
Particulars October November December TOTAL
Direct Material Consumed $82,93,560 $130,55,220 $152,84,160 $366,32,940
Direct Labor Cost $33,99,000 $53,50,500 $62,64,000 $150,13,500
PRIME COST $116,92,560 $184,05,720 $215,48,160 $516,46,440
Manufacturing Overhead $685,91,685 $753,50,235 $785,13,923 $2224,55,843
COST OF PRODUCTION $802,84,245 $937,55,955 $1000,62,083 $2741,02,283
Add: Adjustment for WIP $0 $0 $0 $0
COST OF GOODS MANUFACTURED $802,84,245 $937,55,955 $1000,62,083 $2741,02,283
Budgeted Production Volume 22660 35670 41760
Cost of Goods Manufactured per unit $3,542.99 $2,628.43 $2,396.12
Closing Stock of Finished Goods 6960 7830 10440
Value of Finished Goods $246,59,239 $205,80,576 $250,15,521
Figure 9: (Image showing Cost of Goods Manufactured Statement)
Source: (Created by Author)
Income Statement:
Particulars October November December TOTAL
Sales Revenue $1713,90,000 $1371,12,000 $1542,51,000 $4627,53,000
Cost of Goods Manufactured $802,84,245 $937,55,955 $1000,62,083 $2741,02,283
Add: Opening Finished Goods Inventory $1192,62,000 $246,59,239 $205,80,576 $1192,62,000
Cost of Goods Available for Sale $1995,46,245 $1184,15,194 $1206,42,658 $3933,64,283
Less: Closing Finished Goods Inventory $246,59,239 $205,80,576 $250,15,521 $250,15,521
Cost of Goods Sold -$1748,87,006 -$978,34,618 -$956,27,138 -$3683,48,762
GROSS PROFIT -$34,97,006 $392,77,382 $586,23,862 $944,04,238
Selling & Administration Expenses -$391,81,560 -$256,81,800 -$300,06,060 -$948,69,420
Bad Debts -$21,86,940 -$34,27,800 -$27,42,240 -$83,56,980
Figure 10: (Image showing Income Statement)
Paraphrase This Document
Need a fresh take? Get an instant paraphrase of this document with our AI Paraphraser

10
MANAGEMENT ACCOUNTING
Source: (Created by Author)
Part B
Investment Decision
As per the situation which is given in the question, the production manager of the
company has made the decision to undertake an investment which will benefit the business and
improve the overall production capacity of the business. The new manufacturing policy which is
adopted by the business will be ensuring that the business is able maximize the production
process and thereby increasing the revenue of the business.
For the purpose of judging the effectiveness of the manufacturing plan which is intended
by the management various forecasting and planning is done with the help of using Budgeting
tool. The various budgets which are prepared by the management of the company are sales,
budget, purchase budget, production budget, direct labor, direct material budget, cash budget and
income statement. The Sales budget which is prepared by the company shows that the sales
volume of the company decreases from the estimates of month of October as shown in the month
of November and December which is 34800 units and 39150 units. The overall sales of the
company which is estimated in the budget for the month of January is shown to be $ 2056,68,000
which is significantly higher than the sales which is estimated to be achieved in the month of
December which is $ 1542,51,000. This shows that the company is expecting increase in the
sales of the company in the month of January. The production budget reveals that the anticipated
volume of production is expected to be highest in the month of January which is shown to be
52200 units. The budgeted production volume from the month of October shows an increasing
trend which means that the business is anticipating growth. The direct labor budget shows that
11
MANAGEMENT ACCOUNTING
the anticipated labor cost is also expected to rise as the labor is increasing keeping the rate
charged by the labor constant. As the production level of the company increases it is natural that
the level of variable costs which includes labor cost will also be increasing. The budgeted labor
cost is anticipated to be $ 62,654,000 as shown in figure 3 above. As the budgeted Sales Volume
is known from the sales budget and the expected production level is also known the management
needs to know how much material needs to be purchased for keeping the estimates of sales and
production budget intact. The budgeted direct material purchased for the month of December
shows a significant rise of more than $ 3,0000. The direct material which is needed to be
purchased is of the value of $ 165,05,640. The manufacturing overhead which is prepared shows
the various indirect expenses which are undertaken by the management of the company which
needs to be estimated. The budget shows both indirect costs of variable and fixed nature. The
budgeted manufacturing overhead for the month of December is shown to be $ 785,13,923. The
cash budgets show the various expenses which the management expects they will be incurring
during the quarter (Almaree et al., 2015). The cash from operating activities shows positive
results for all months which suggest that the management believes in the operation strength of
the business. The closing cash balance for the month of December shows that the business
anticipated a cash balance of $ 429,77,647. The income statement shows loss when the aggregate
profit for all the months are considered.
Thus, from the above analysis it is clearly shown in the income statement which
anticipates the income and expenses of the business that the business will be earning losses in
aggregate therefore the management should not undertake the production plan.
⊘ This is a preview!⊘
Do you want full access?
Subscribe today to unlock all pages.
Trusted by 1+ million students worldwide
1 out of 14
Related Documents


Your All-in-One AI-Powered Toolkit for Academic Success.
+13062052269
info@desklib.com
Available 24*7 on WhatsApp / Email
![[object Object]](/_next/static/media/star-bottom.7253800d.svg)
Unlock your academic potential
Copyright © 2020–2026 A2Z Services. All Rights Reserved. Developed and managed by ZUCOL.