University Report: Management Accounting and Control - PGBM 64
VerifiedAdded on 2022/10/19
|14
|4276
|255
Report
AI Summary
This report presents a comprehensive analysis of management accounting and control principles, addressing two specific questions from a university assignment. The first question focuses on production planning under resource constraints, including the allocation of fixed costs, the application of Economic Order Quantity (EOQ), and the interpretation of the margin of safety. It explores the use of a balanced scorecard for decision-making, considering financial, customer, internal process, and organizational capacity perspectives. The second question evaluates three investment proposals from different divisions (leather, wood, and steel) based on Return on Investment (ROI), residual income, and Economic Value Added (EVA). The report compares the viability of each proposal, considering the nature and timing of returns. The report provides detailed calculations in the appendices and supports its findings with relevant academic research.
Running head: MANAGEMENT ACCOUNTING AND CONTROL
MANAGEMENT ACCOUNTING AND CONTROL
Name of the Student
Name of the University
Author Note
MANAGEMENT ACCOUNTING AND CONTROL
Name of the Student
Name of the University
Author Note
Paraphrase This Document
Need a fresh take? Get an instant paraphrase of this document with our AI Paraphraser
1
MANAGEMENT ACCOUNTING AND CONTROL
Table of Contents
Answer to Question 1...................................................................................................................3
Answer to Question 2...................................................................................................................6
Bibliography...............................................................................................................................10
Appendix....................................................................................................................................12
2
MANAGEMENT ACCOUNTING AND CONTROL
Answer to Question 1
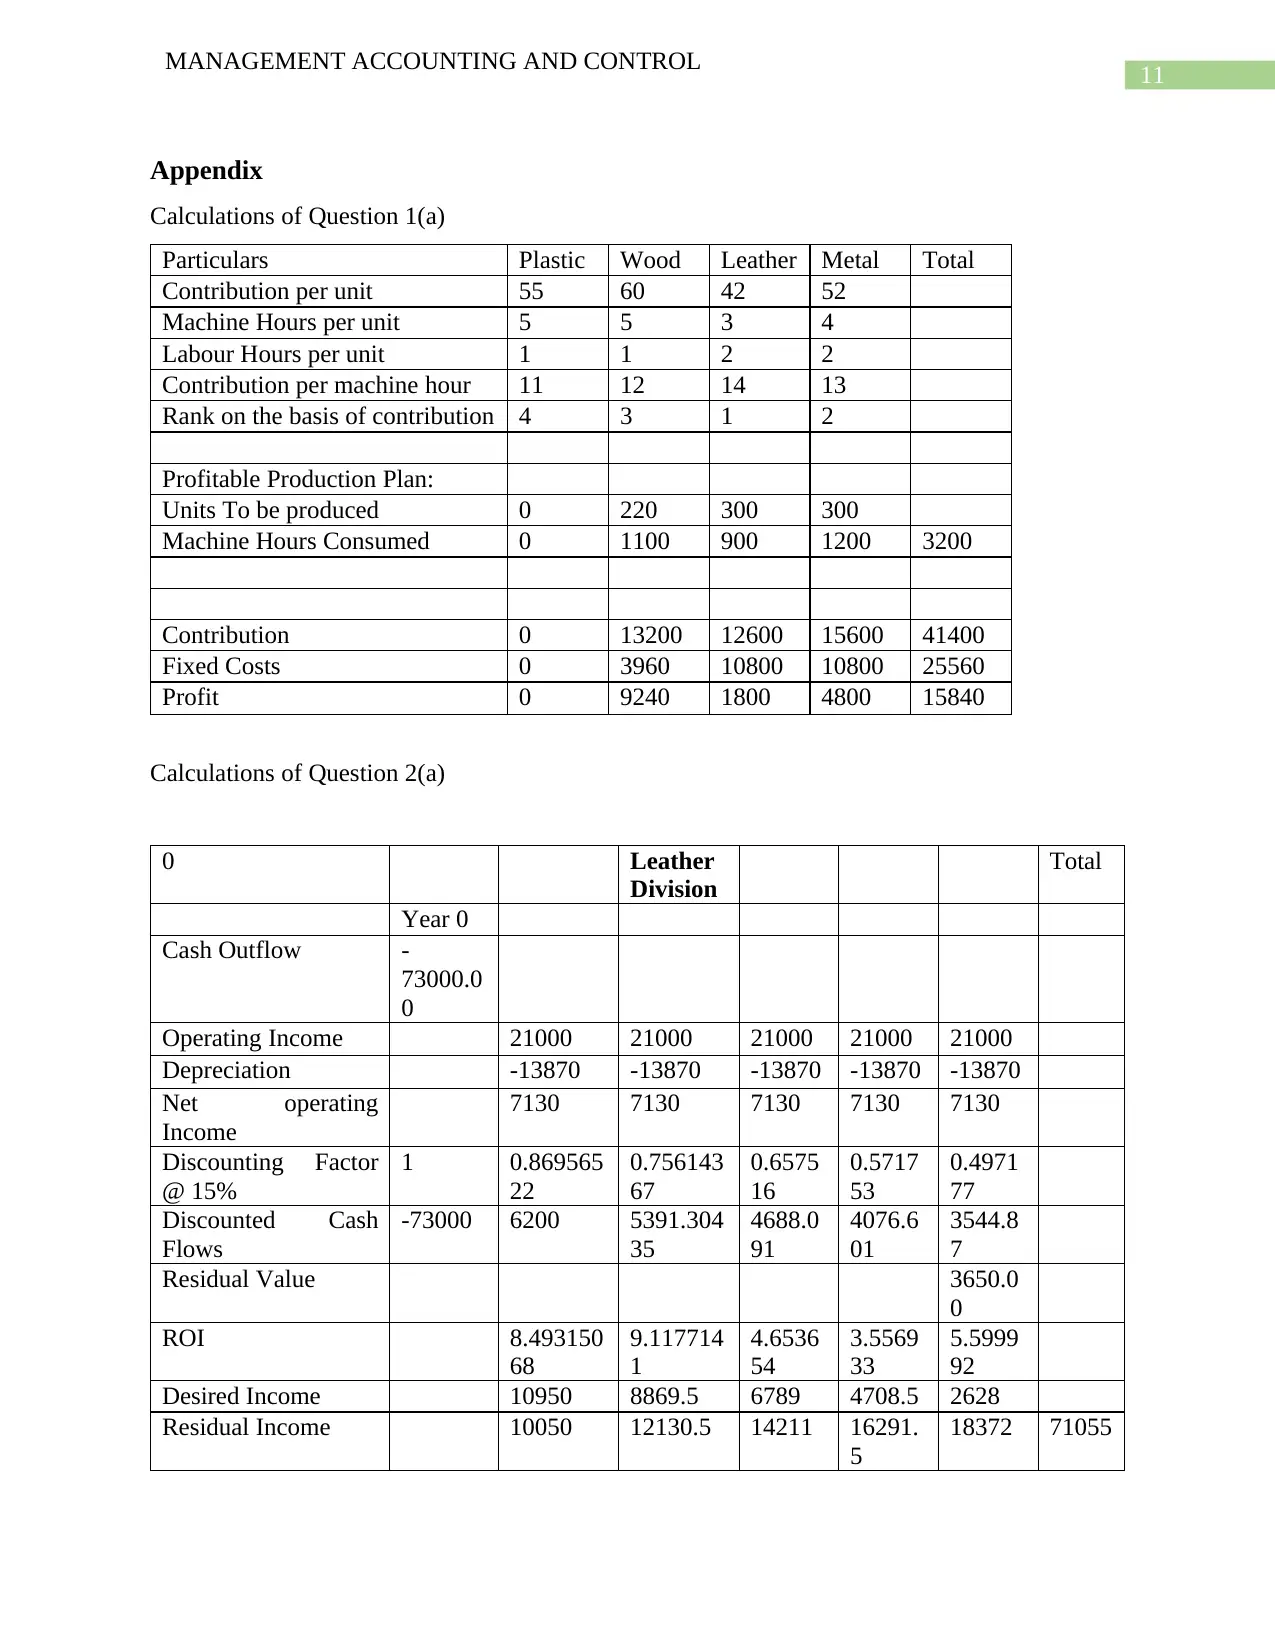
(a) In this situation, the production plan of the company has to be prepared by keeping the
constraint of machine hours in consideration. The absorbed fixed costs of the machine
hours should also be allocated to the products accordingly. When contribution is
calculated according to the constraint of machine hours in hand, the leather product
provides the highest amount of contribution. Fixed costs should also be allocated
according to the labour hours in hand (Novak and Popesko 2014). After calculating the
profit provided by a product on the basis of both the variable costs and labour costs, it has
been understood that producing 300 units each of the leather product and the metal
product along with 220 units of the wood product will turn out to be the most profitable
for the company as it provides a profit of 15840 after deducting all the costs. Plastic
chairs should not be produced at all as even though the profit earned from this type of
product is high, the product does not hold well under circumstances with restrictions on
the machine hours and the labour hours. After the allocation of the fixed costs, it is more
evident that the product is not at all profitable due to the high amount of machine hours it
consumes. Hence, after calculating the appropriate combination of products according to
the calculations made and ranking of the products, it has been found that the contribution
of the combination of the products is 41400 and the fixed costs are arrived at 25560.
(b) Economic order quantity (EOQ) is the appropriate amount of quantity that an entity
should procure at once while taking the cost of production, demand rate, holding costs
and other relevant variables into consideration (Sajtiprasert 2014). The main purpose of
applying EOQ is to reduce the costs associated with inventories. However, the theoretical
definition of EOQ is limited. It fails to consider the practical constraints faced by the
business. Utilising Sequential Quadratic Programming (SQP) is helpful in finding the
optimum quantity required for the buyer while taking constraints like budget, space,
ordering and procurement costs into consideration (Pasandideh, Niaki and Gharaei 2015).
This method has also been approved by conducting sensitivity analysis and its
comparison with other methods. In the given case, Lazy King Ltd. can apply the EOQ
model to order sufficient quantities of raw materials required for the manufacturing of the
profitable products in an efficient manner. It can altogether avoid the procurement of raw
MANAGEMENT ACCOUNTING AND CONTROL
Answer to Question 1
(a) In this situation, the production plan of the company has to be prepared by keeping the
constraint of machine hours in consideration. The absorbed fixed costs of the machine
hours should also be allocated to the products accordingly. When contribution is
calculated according to the constraint of machine hours in hand, the leather product
provides the highest amount of contribution. Fixed costs should also be allocated
according to the labour hours in hand (Novak and Popesko 2014). After calculating the
profit provided by a product on the basis of both the variable costs and labour costs, it has
been understood that producing 300 units each of the leather product and the metal
product along with 220 units of the wood product will turn out to be the most profitable
for the company as it provides a profit of 15840 after deducting all the costs. Plastic
chairs should not be produced at all as even though the profit earned from this type of
product is high, the product does not hold well under circumstances with restrictions on
the machine hours and the labour hours. After the allocation of the fixed costs, it is more
evident that the product is not at all profitable due to the high amount of machine hours it
consumes. Hence, after calculating the appropriate combination of products according to
the calculations made and ranking of the products, it has been found that the contribution
of the combination of the products is 41400 and the fixed costs are arrived at 25560.
(b) Economic order quantity (EOQ) is the appropriate amount of quantity that an entity
should procure at once while taking the cost of production, demand rate, holding costs
and other relevant variables into consideration (Sajtiprasert 2014). The main purpose of
applying EOQ is to reduce the costs associated with inventories. However, the theoretical
definition of EOQ is limited. It fails to consider the practical constraints faced by the
business. Utilising Sequential Quadratic Programming (SQP) is helpful in finding the
optimum quantity required for the buyer while taking constraints like budget, space,
ordering and procurement costs into consideration (Pasandideh, Niaki and Gharaei 2015).
This method has also been approved by conducting sensitivity analysis and its
comparison with other methods. In the given case, Lazy King Ltd. can apply the EOQ
model to order sufficient quantities of raw materials required for the manufacturing of the
profitable products in an efficient manner. It can altogether avoid the procurement of raw
⊘ This is a preview!⊘
Do you want full access?
Subscribe today to unlock all pages.
Trusted by 1+ million students worldwide
3
MANAGEMENT ACCOUNTING AND CONTROL
materials of plastic chairs as the production of those chairs is totally unprofitable. Margin
of safety is a measure which is used to know the revenue that a company can earn over its
breakeven sales. This is calculated after the company meets both its fixed and variable
costs in a given financial year (Walther and Skousen 2017). A lower margin of safety
indicates that a company is likely to incur losses due to a slight change in fixed costs or a
decrease in the selling price. In the given case, the margin of safety of the entity is quite
high and the company can continue manufacturing its products at that level to be able to
maximise its profits under the given constraints (Caprice, Schlippenbach and Wey 2014).
In the given case, the company is not able to meet the entire demand for the wood chairs
and the plastic chairs. Apart from this, it has been found by many manufacturing
companies that lead time is a significant tool to differentiate themselves in the market and
is helpful in positioning themselves profitably. Hence, instead of increasing the labour
hours or providing special discounts to customers, the company can focus on improving
its efficiency by following a vendor-purchaser integrated production model (Vijayashree
and Uthayakumar 2014). These can lead to a decline in the costs incurred by the company
and increase the speed at which it delivers the products while also manufacturing them
quickly.
(c) The balanced scorecard is a financial tool that considers the performance of an entity
using four aspects. These are the financial perspective, customer/stakeholder perspective,
internal process related perspective and the organisational capacity. The main objective
of this tool is to provide the company with a strategy to satisfy all of the above mentioned
guidelines and to help in decision making (Tjader et al., 2014). When considering all of
the perspectives covered under a balanced scorecard and the scenarios faced by the entity,
it is evident that the tool can be used to guide the company in the process of making
decisions related to manufacturing specific products and outsourcing them. Although, the
limitation of the balanced scorecard has been found to be its inability to properly manage
the micro aspects of a business (Susilawati et al. 2013). This limitation is not completely
relevant in the present scenario as the company is not a very big organisation that
operates in a large number of business areas and produces a wide variety of range of
products. As the information about the company’s business and other perspectives is
quite clear, applying balanced scorecard in this case is more relevant (Sundharam,
Paraphrase This Document
Need a fresh take? Get an instant paraphrase of this document with our AI Paraphraser
4
MANAGEMENT ACCOUNTING AND CONTROL
Sharma and Thangaiah 2013). From a financial perspective, the company should continue
its production in a manner which increases the overall profitability of its manufacturing
process. Hence, the company should consider following the production plan mentioned in
(a) to be able to maximise the profits earned by it. Apart from maximising the profits that
the company stands to earn in the given year, this plan also satisfies the various
perspectives measured by a balanced scorecard. Manufacturing only plastic chairs will
lead to a drastic decline in the profits of the company. Hence, it cannot be considered to
be a viable option as the company needs to generate profits to survive and thrive as a
business. This will also lead to the company not being able to meet its demand for other
products from the customers. Increasing the labour hours is good from a customer
perspective but it severely limits the capability of the company to generate high profits
from its manufacturing process. Not undertaking this measure also causes the business to
not meet the demands of its customers. Researchers suggest that the most important
aspect to consider when using balanced scorecard in the business is customer satisfaction.
In an ideal scenario, the main priority should be given to satisfying the customers in order
to satisfy and retain them. Hence, the company should consider accepting the outsourcing
offer as it leads to a reduction in the costs by a half. This will lead to the company to
meet the demand for its products in the market, while also avoiding the burdens caused
due to manufacturing the product itself (Leng et al., 2013). Other benefits that the
company can obtain from outsourcing the products are getting the time and resources to
focus on core activities, increasing the efficiency of the process of the business,
flexibility in staffing and gaining a competitive advantage over the competitors of the
business. This serves the purpose of ultimately leading to the development of the business
as a whole. However, apart from the financial and customer perspectives, there has been
an increasing demand from all stakeholders to consider environmental resources and
sustainability for the future generations into consideration. The usage of plastic has been
condemned by all the relevant authorities due to the negative effects caused by its usage.
There has been no support from the government authorities or the export countries. This
can also lead to a damage in the reputation of the company. Hence, in order to meet its
corporate social responsibility obligations and to make a good amount of profit on an
annual basis, the company should stop manufacturing the plastic chairs (Dinçer, Hacıoğlu
5
MANAGEMENT ACCOUNTING AND CONTROL
and Yüksel 2017). Although it is possible that the company may face the wrath of its
customers, this can be overcome by repositioning itself in the market as a company
manufacturing only environmental friendly products (Saeidi et al. 2015). A part of the
savings made in the costs by discontinuing the production can be invested in the
marketing of its products. For the remaining capacity of the wood chairs which it is not
able to produce currently, the company can choose to outsource the products as it can
earn a certain amount of profit by opting for the same.
Answer to Question 2
(a) In the given case, the three investment proposals of the three divisions called the leather
division, wood division and steel division vary from each other in terms of returns
provided on the investment, residual income provided and the economic value added by
each of the individual projects. While the return on investment of the proposal of the
leather division is positive throughout the lifetime of the asset, it never exceeds 9%
during the lifetime of the asset. The ROI of the proposal of the wood division is very high
and exceeds 10% in more than three years. The returns provided by this proposal are
fluctuating on a yearly basis and there is no guarantee of getting stable returns from this
proposal. The ROI of the investment proposed by the steel division is negative for the
first year but is increasing on a consistent basis from then on and provides extremely high
returns of around 69% in the final year of its lifetime. While all of the proposals have
their set of merits and demerits, it can be said that the proposals of the Steel Division and
Wood Division are viable as they provide similar returns on an average by the end of the
project. However, the company will have to survive initial losses to be able to implement
the Steel Division project. When considering residual income as a measure of the quality
of the investment proposal, the residual income provided by the proposal of the leather
division is higher than that of the wood division and the steel division (Havlíček,
Thalassinos and Berezkinova 2013). It is evident that leather division’s proposal is better
than the other two. In terms of economic value added to the organisation, the proposal of
the leather division is again considered to be more viable than that of the wood division
and steel division as the EVA of this proposal is more than that of the other two
proposals. It can be summarised that the investment proposals of the wood division and
⊘ This is a preview!⊘
Do you want full access?
Subscribe today to unlock all pages.
Trusted by 1+ million students worldwide
6
MANAGEMENT ACCOUNTING AND CONTROL
the steel division are similar in nature in terms of the nature and timing of the returns,
economic value added and the residual income provided.
(b) Return on Investment (ROI) is the ratio between the net profit earned by an entity and the
cost of the investment made by it in a given year. It is used to indicate the percentage of
returns that an investor has been able to make over the amount he has invested in a given
financial year. The main benefits of using ROI as a measure of financial performance is
the better measurement of profitability along with the comparability between
investments. It also allows focusing on the performance of divisions where there is no
scope for much innovation and the major target is only to increase the profits (Auerbach,
Tulloch. and Possingham 2014). It is also convenient to use with the standard cost and
financial accounting systems followed on a worldwide basis. This measure suffers from
its own set of limitations despite the numerable benefits provided by it. While ROI
intends to measure the profit that an entity is earning on its investment, the profit that is
to be considered is not very clear in every case. There are many concepts of profit like
profit before tax, profit after tax and profit before depreciation and taxes and others. If a
company considers profit after tax for the measuring of ROI, a sudden increase in the tax
levels will reduce the ROI and make the investment seem unfavourable. Any unexpected
losses suffered by a company also play a part in reducing the ROI. While comparison of
ROIs is a benefit provided by this measure, differences arise due to the changes in
accounting policies followed by the divisions (Otley 2016). This results in making the
comparisons difficult. With regards to residual income, it is an effective concept as it
considers concepts like opportunity cost of capital in measuring the income. The concept
also considers the net operating assets used by the firm according to their updated value
and not the historical cost of the assets. This makes the results provided by it to be more
relevant. However, there are certain limitations in this model as well. In practical
application, a reliable measure of the opportunity cost of capital is difficult to arrive at
due to the nature of fluctuations in markets (McLellan 2014). Impairment of assets
without any proper evidence to back the same also leads to a decline in the value of the
residual income. This has been the case in many situations related to the measurement of
residual income. As residual income is an absolute measure, in order to compare the
performance of two divisions, one has to make sure that both the divisions are of the
Paraphrase This Document
Need a fresh take? Get an instant paraphrase of this document with our AI Paraphraser
7
MANAGEMENT ACCOUNTING AND CONTROL
same size and operate under similar conditions. Otherwise, it becomes quite evident that
this is not a suitable measure to compare the performances of two divisions. Economic
value added is defined as the value that an investment adds to the firm over the return
required by the shareholders. This is said to be a measure which quantifies the additional
economic benefits that a shareholder obtains due to investing in a specified investment
avenue. The main rationale of the EVA measure is highly acceptable as it is universally
accepted that the purpose of a business is to create value apart from providing returns to
the shareholders. It also acts as a good measure of the difference between the actual level
and the desired level of performance of a company. However, like the above mentioned
measures of performance, EVA becomes difficult to calculate and less reliable when the
aspects of measure keep changing on a constant basis. Whereas negative EVA is
considered not to be good, it has been proven that firms with negative EVA in the short
run provide extremely high returns in the short run (Ivanov, Leong and Zaima 2014).
This encourages investors to invest in such firms in the short run. Due to its nature of
relying heavily on the capital invested by a company, and being an absolute value of
measure, EVA tends to look much better for larger firms than for the smaller firms and
the start-ups. Hence, in case of companies which are heavy on intangible assets like
technology and service oriented companies, EVA cannot be used as a reliable source of
measure to know the value created by the firm. As in the case of Residual Income, EVA
remains relevant only to the period for which it is calculated and cannot be reliably used
to measure the future trends and forecasts of the company. It has been noted that correctly
calculating the EVA needs around 164 adjustments to be made to the calculated
accounting reports to remove the distortions caused by accounting rules and regulations.
In practice, accountants and firms do not use more than a dozen of these (Collier 2015).
(c) Short term financial measures have long been criticised by various research scholars and
users for their lack of completeness, neutrality, balance and their encouragement of
having a short term vision (Anon 2019). There is also no clarity about a standard measure
to measure the performance of a firm (Miller, Washburn and Glick 2013). While using
the short term measures of financial performance, the focus of the organisation remains
only on areas which are to be worked on to improve the immediate financial performance
of the company. However, they never fail to provide concrete solutions to sustaining the
8
MANAGEMENT ACCOUNTING AND CONTROL
performance in the long run or any information about the market conditions that may
exist in the future. Hence, to overcome these deficiencies, it becomes vital for KAdlex
PLC to adopt a more complete and long term performance measure which measures both
the financial and the non-financial factors which are likely to impact the business.
Balance scorecard has proven itself to be such a measure over the years since it was first
adopted (Akkermans and Van Oorschot 2018). Its focus remains on becoming a tool
which measures the performance of the firm as a whole and not just on improving the
profitability of the firm. Other factors like customer perspective, internal process, and
organisational capacity to learn and grow are all required to be considered while forming
the policies of an entity. This reduces the firm’s short term planning and helps it in
forming a business where the focus is on creating a sustainable and growth oriented
business for a long period of time. This aligns all the activities of the firm into a single
strategy and makes sure that everyone works towards achieving the vision and mission of
the organisation. This perspective is important as the firm should always strive to carry
on its business in the future and not wind itself up at the first available opportunity.
⊘ This is a preview!⊘
Do you want full access?
Subscribe today to unlock all pages.
Trusted by 1+ million students worldwide
9
MANAGEMENT ACCOUNTING AND CONTROL
Bibliography
Akkermans, H.A. and Van Oorschot, K.E., 2018. Relevance assumed: a case study of balanced
scorecard development using system dynamics. In System Dynamics (pp. 107-132). Palgrave
Macmillan, London.
Anon, (2019). [Online] Available at:
https://www.researchgate.net/publication/235320491_The_balanced_scorecard_Short-
term_guest_or_long-term_resident [Accessed 26 Jul. 2019].
Auerbach, N.A., Tulloch, A.I. and Possingham, H.P., 2014. Informed actions: where to cost
effectively manage multiple threats to species to maximize return on investment. Ecological
Applications, 24(6), pp.1357-1373.
Caprice, S., Schlippenbach, V.V. and Wey, C., 2014. Supplier Fixed Costs and Retail Market
Monopolization.
Collier, P.M., 2015. Accounting for managers: Interpreting accounting information for decision
making. John Wiley & Sons.
Dinçer, H., Hacıoğlu, Ü. and Yüksel, S., 2017. Balanced scorecard based performance
measurement of European airlines using a hybrid multicriteria decision making approach under
the fuzzy environment. Journal of Air Transport Management, 63, pp.17-33.
Havlíček, K., Thalassinos, I.E. and Berezkinova, L., 2013. Innovation management and
controlling in SMEs. European Research Studies Journal, 16(4), pp.57-70.
Ivanov, S.I., Leong, K. and Zaima, J.K., 2014. An empirical examination of negative economic
value added firms. The International Journal of Business and Finance Research, 8(1), pp.103-
112.
Leng, J.W., Jiang, P.Y., Zhang, F.Q. and Cao, W., 2013. Framework and key enabling
technologies for social manufacturing. In Applied Mechanics and Materials (Vol. 312, pp. 498-
501). Trans Tech Publications.
McLellan, J.D., 2014. Management Accounting Theory and Practice: Measuring the Gap in
United States Businesses. Journal of Accounting, Business & Management, 21(1).
Miller, C.C., Washburn, N.T. and Glick, W.H., 2013. Perspective— the myth of firm
performance. Organization Science, 24(3), pp.948-964.
Paraphrase This Document
Need a fresh take? Get an instant paraphrase of this document with our AI Paraphraser
10
MANAGEMENT ACCOUNTING AND CONTROL
Novák, P. and Popesko, B., 2014. Cost variability and cost behaviour in manufacturing
enterprises. Economics and Sociology.
Otley, D., 2016. The contingency theory of management accounting and control: 1980–
2014. Management accounting research, 31, pp.45-62.
Pasandideh, S.H.R., Niaki, S.T.A. and Gharaei, A., 2015. Optimization of a multiproduct
economic production quantity problem with stochastic constraints using sequential quadratic
programming. Knowledge-Based Systems, 84, pp.98-107.
Saeidi, S.P., Sofian, S., Saeidi, P., Saeidi, S.P. and Saaeidi, S.A., 2015. How does corporate
social responsibility contribute to firm financial performance? The mediating role of competitive
advantage, reputation, and customer satisfaction. Journal of business research, 68(2), pp.341-
350.
Sajtiprasert, W., 2014. Application of economic order quantity (EOQ) for inventory management
of a food ingredient importer.
Sundharam, V.N., Sharma, V. and Stephan Thangaiah, I.S., 2013. An integration of BSC and
AHP for sustainable growth of manufacturing industries. International Journal of Business
Excellence, 6(1), pp.77-92.
Susilawati, A., Tan, J., Bell, D. and Sarwar, M., 2013. Develop a framework of performance
measurement and improvement system for lean manufacturing activity. International Journal of
Lean Thinking, 4(1), pp.51-64.
Tjader, Y., May, J.H., Shang, J., Vargas, L.G. and Gao, N., 2014. Firm-level outsourcing
decision making: A balanced scorecard-based analytic network process model. International
Journal of Production Economics, 147, pp.614-623.
Vijayashree, M. and Uthayakumar, R., 2014. An integrated inventory model with controllable
lead time and setup cost reduction for defective and non-defective items. International Journal
of Supply and Operations Management, 1(2), p.190.
Walther, L.M. and Skousen, C.J., 2017. Cost Analysis. Bookboon.
11
MANAGEMENT ACCOUNTING AND CONTROL
Appendix
Calculations of Question 1(a)
Particulars Plastic Wood Leather Metal Total
Contribution per unit 55 60 42 52
Machine Hours per unit 5 5 3 4
Labour Hours per unit 1 1 2 2
Contribution per machine hour 11 12 14 13
Rank on the basis of contribution 4 3 1 2
Profitable Production Plan:
Units To be produced 0 220 300 300
Machine Hours Consumed 0 1100 900 1200 3200
Contribution 0 13200 12600 15600 41400
Fixed Costs 0 3960 10800 10800 25560
Profit 0 9240 1800 4800 15840
Calculations of Question 2(a)
0 Leather
Division
Total
Year 0
Cash Outflow -
73000.0
0
Operating Income 21000 21000 21000 21000 21000
Depreciation -13870 -13870 -13870 -13870 -13870
Net operating
Income
7130 7130 7130 7130 7130
Discounting Factor
@ 15%
1 0.869565
22
0.756143
67
0.6575
16
0.5717
53
0.4971
77
Discounted Cash
Flows
-73000 6200 5391.304
35
4688.0
91
4076.6
01
3544.8
7
Residual Value 3650.0
0
ROI 8.493150
68
9.117714
1
4.6536
54
3.5569
33
5.5999
92
Desired Income 10950 8869.5 6789 4708.5 2628
Residual Income 10050 12130.5 14211 16291.
5
18372 71055
⊘ This is a preview!⊘
Do you want full access?
Subscribe today to unlock all pages.
Trusted by 1+ million students worldwide
1 out of 14
Related Documents


Your All-in-One AI-Powered Toolkit for Academic Success.
+13062052269
info@desklib.com
Available 24*7 on WhatsApp / Email
![[object Object]](/_next/static/media/star-bottom.7253800d.svg)
Unlock your academic potential
Copyright © 2020–2026 A2Z Services. All Rights Reserved. Developed and managed by ZUCOL.