Jeffrey & Son's: Management Accounting Costing and Budgeting Report
VerifiedAdded on 2020/01/15
|23
|5749
|171
Report
AI Summary
This report provides a detailed analysis of management accounting principles, focusing on costing, budgeting, and variance analysis within the context of Jeffrey & Son's, a manufacturing unit producing Exquisite products. The report explores various cost elements, including direct materials, labor, and overhead costs, categorized by function, nature, and behavior. It presents a job cost sheet and analyzes overhead absorption methods using both machine hours and labor hours, concluding that labor hours are more cost-effective for the company. The report also includes a cost sheet for 1900 units, variance analysis, and the impact of cost variances on the company's profitability. The analysis covers variances in labor, material, electricity, and maintenance costs, offering insights into their effects on the business's financial performance and providing recommendations for cost reduction and improved decision-making.
MANAGEMENT ACCOUNTING
COSTING AND BUDGETING
1
COSTING AND BUDGETING
1
Paraphrase This Document
Need a fresh take? Get an instant paraphrase of this document with our AI Paraphraser
Table of Contents
INTRODUCTION...........................................................................................................................1
TASK 1............................................................................................................................................1
P1.1.........................................................................................................................................1
P1.2.........................................................................................................................................2
P1.3.........................................................................................................................................3
P1.4.........................................................................................................................................5
TASK 2............................................................................................................................................6
P2.1.........................................................................................................................................6
P2.2.........................................................................................................................................9
P2.3.........................................................................................................................................9
TASK 3..........................................................................................................................................10
3.1.........................................................................................................................................10
P3.2.......................................................................................................................................11
P3.3.......................................................................................................................................11
P3.4.......................................................................................................................................13
TASK 4..........................................................................................................................................16
P4.1.......................................................................................................................................16
P4.2.......................................................................................................................................19
P4.3.......................................................................................................................................19
CONCLUSION..............................................................................................................................20
REFERENCES..............................................................................................................................21
2
List of tables
Table 1: JOB COST SHEET FOR JOB NO.444.............................................................................3
Table 2: Cost Sheet for Jeffrey & Son's...........................................................................................6
Table 3: Production Budget..........................................................................................................11
Table 4: Material Budget...............................................................................................................12
Table 5: Cash Budget for Jeffrey & Son's.....................................................................................13
Table 6: Operating Statement of Jeffrey & Son's..........................................................................18
1
⊘ This is a preview!⊘
Do you want full access?
Subscribe today to unlock all pages.
Trusted by 1+ million students worldwide
INTRODUCTION
Management accounting plays a very important role in the growth of the business for the
company. It assists the managers to effectively manage the business operations It mainly
includes the financial data analysis techniques which are essential for controlling the cost
incurred (Ahmed, 2010). Jeffrey & Son's is a manufacturing unit and is dealing in the production
of wide range of products which are called Exquisite. In this report, concepts related to
managerial accounting have been studied and analysed. Apart from that the study also focuses on
reducing the cost of production, increase the business income and take efficient decisions which
assist the organization to rise in the market. Different kind of approaches such as budgeting, cost
allocation, variance etc will be taken into consideration.
TASK 1
P1.1
The costs can be divided into different types of elements:
Elements- In this, mainly three types of cost elements are considered which includes
material, labour and overhead cost. For Jeffrey & Sons, direct material cost includes the
price of raw material which is used for the production of goods. Further, direct labour is
associated with the expenditure made to pay the workers who are responsible for
production (Arai, Kitada and Oura, 2013). In addition to this, the other expenses which
directly can be attributed with the production process are known as the direct cost.
Further, the expenditure invested on buying tools and equipment are also included in the
direct expenses.
Function- On the basis of function the cost can be divided into different categories such
as administration, selling and distribution. There are some overheads which can be
included within the business which includes factory rent, power, productive or
unproductive wages, power, lighting etc (Asongu, 2013). Along with that there is also
administration expenses such as staff welfare, stationery, wages, salary etc. Moreover, the
efforts taken by the company for selling the products are involved in the selling and
distribution overhead. These expenses include advertisement, marketing and promotion
means which incur huge amount of cost for the company. Expenses related to production
are associated with the manufacturing process of Jeffrey & Son’s. Depreciation, factory
1
Paraphrase This Document
Need a fresh take? Get an instant paraphrase of this document with our AI Paraphraser
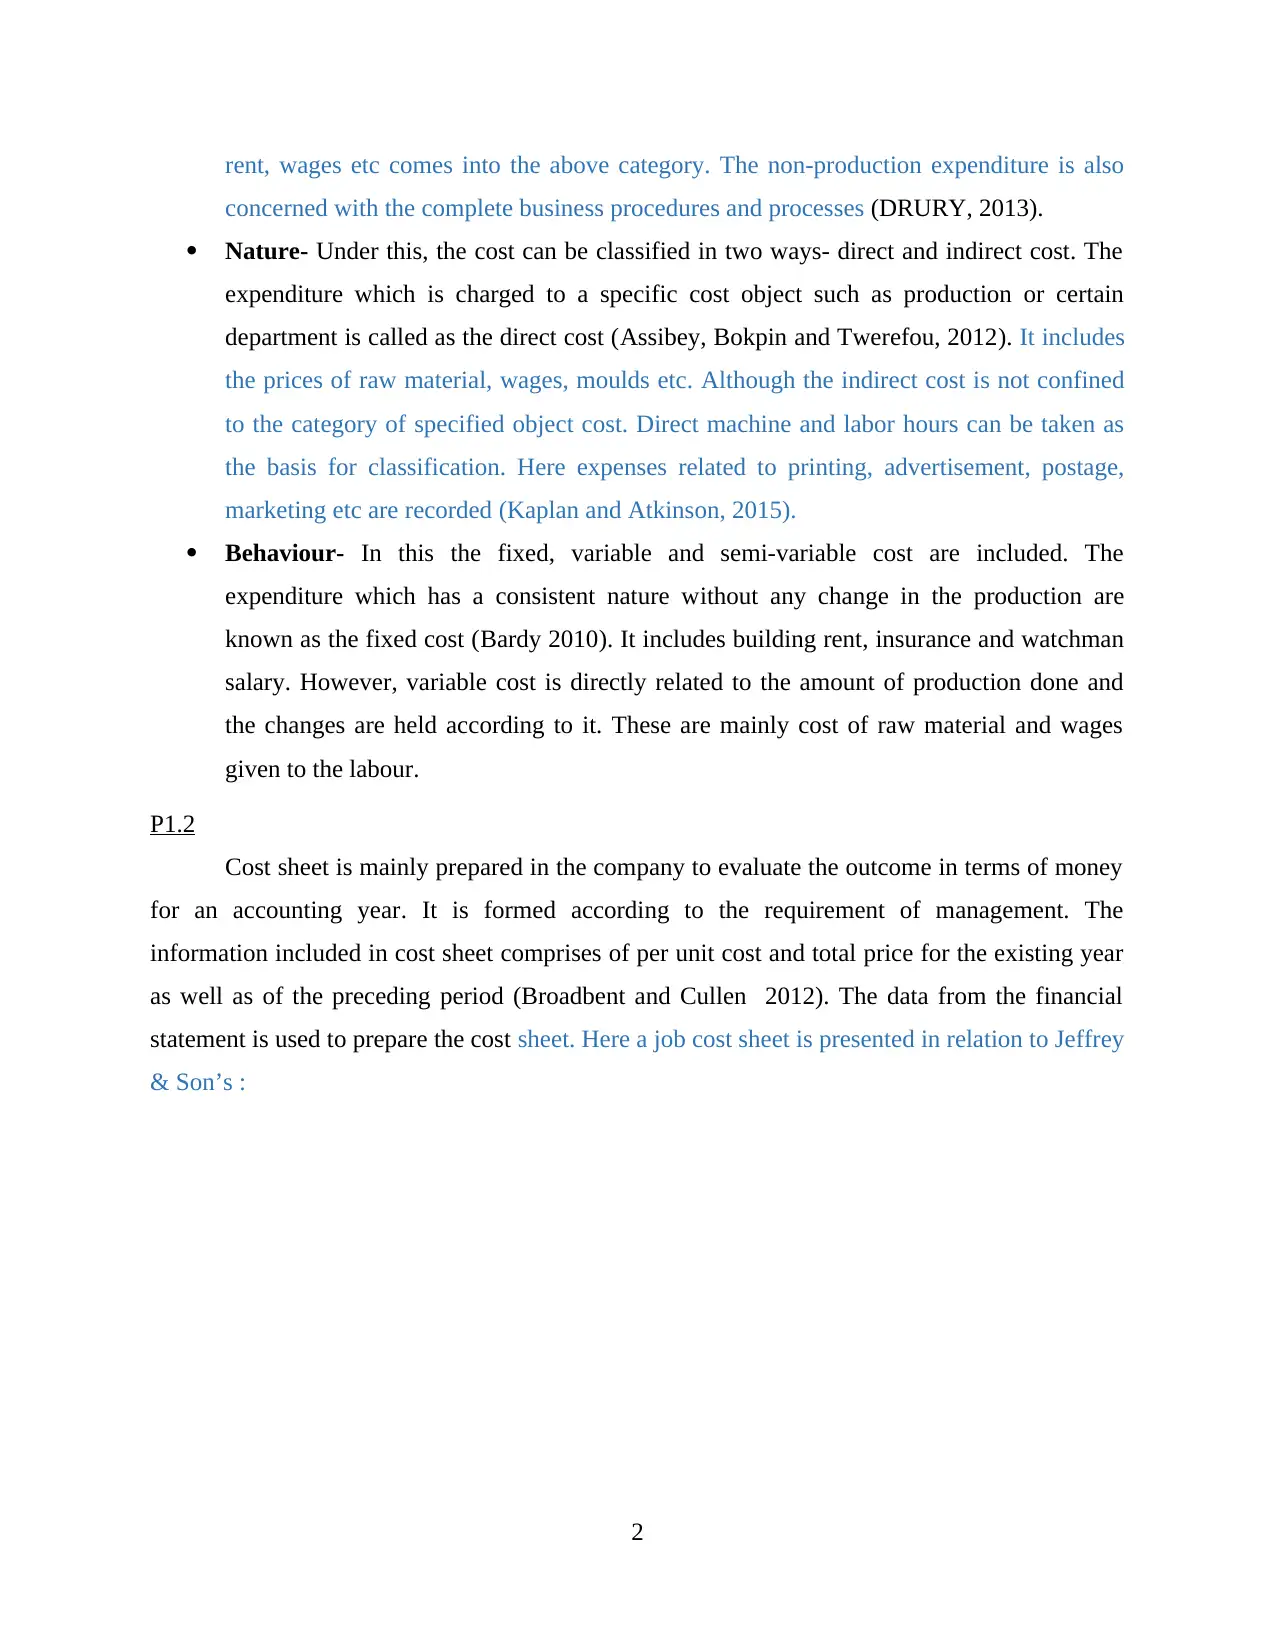
rent, wages etc comes into the above category. The non-production expenditure is also
concerned with the complete business procedures and processes (DRURY, 2013).
Nature- Under this, the cost can be classified in two ways- direct and indirect cost. The
expenditure which is charged to a specific cost object such as production or certain
department is called as the direct cost (Assibey, Bokpin and Twerefou, 2012). It includes
the prices of raw material, wages, moulds etc. Although the indirect cost is not confined
to the category of specified object cost. Direct machine and labor hours can be taken as
the basis for classification. Here expenses related to printing, advertisement, postage,
marketing etc are recorded (Kaplan and Atkinson, 2015).
Behaviour- In this the fixed, variable and semi-variable cost are included. The
expenditure which has a consistent nature without any change in the production are
known as the fixed cost (Bardy 2010). It includes building rent, insurance and watchman
salary. However, variable cost is directly related to the amount of production done and
the changes are held according to it. These are mainly cost of raw material and wages
given to the labour.
P1.2
Cost sheet is mainly prepared in the company to evaluate the outcome in terms of money
for an accounting year. It is formed according to the requirement of management. The
information included in cost sheet comprises of per unit cost and total price for the existing year
as well as of the preceding period (Broadbent and Cullen 2012). The data from the financial
statement is used to prepare the cost sheet. Here a job cost sheet is presented in relation to Jeffrey
& Son’s :
2
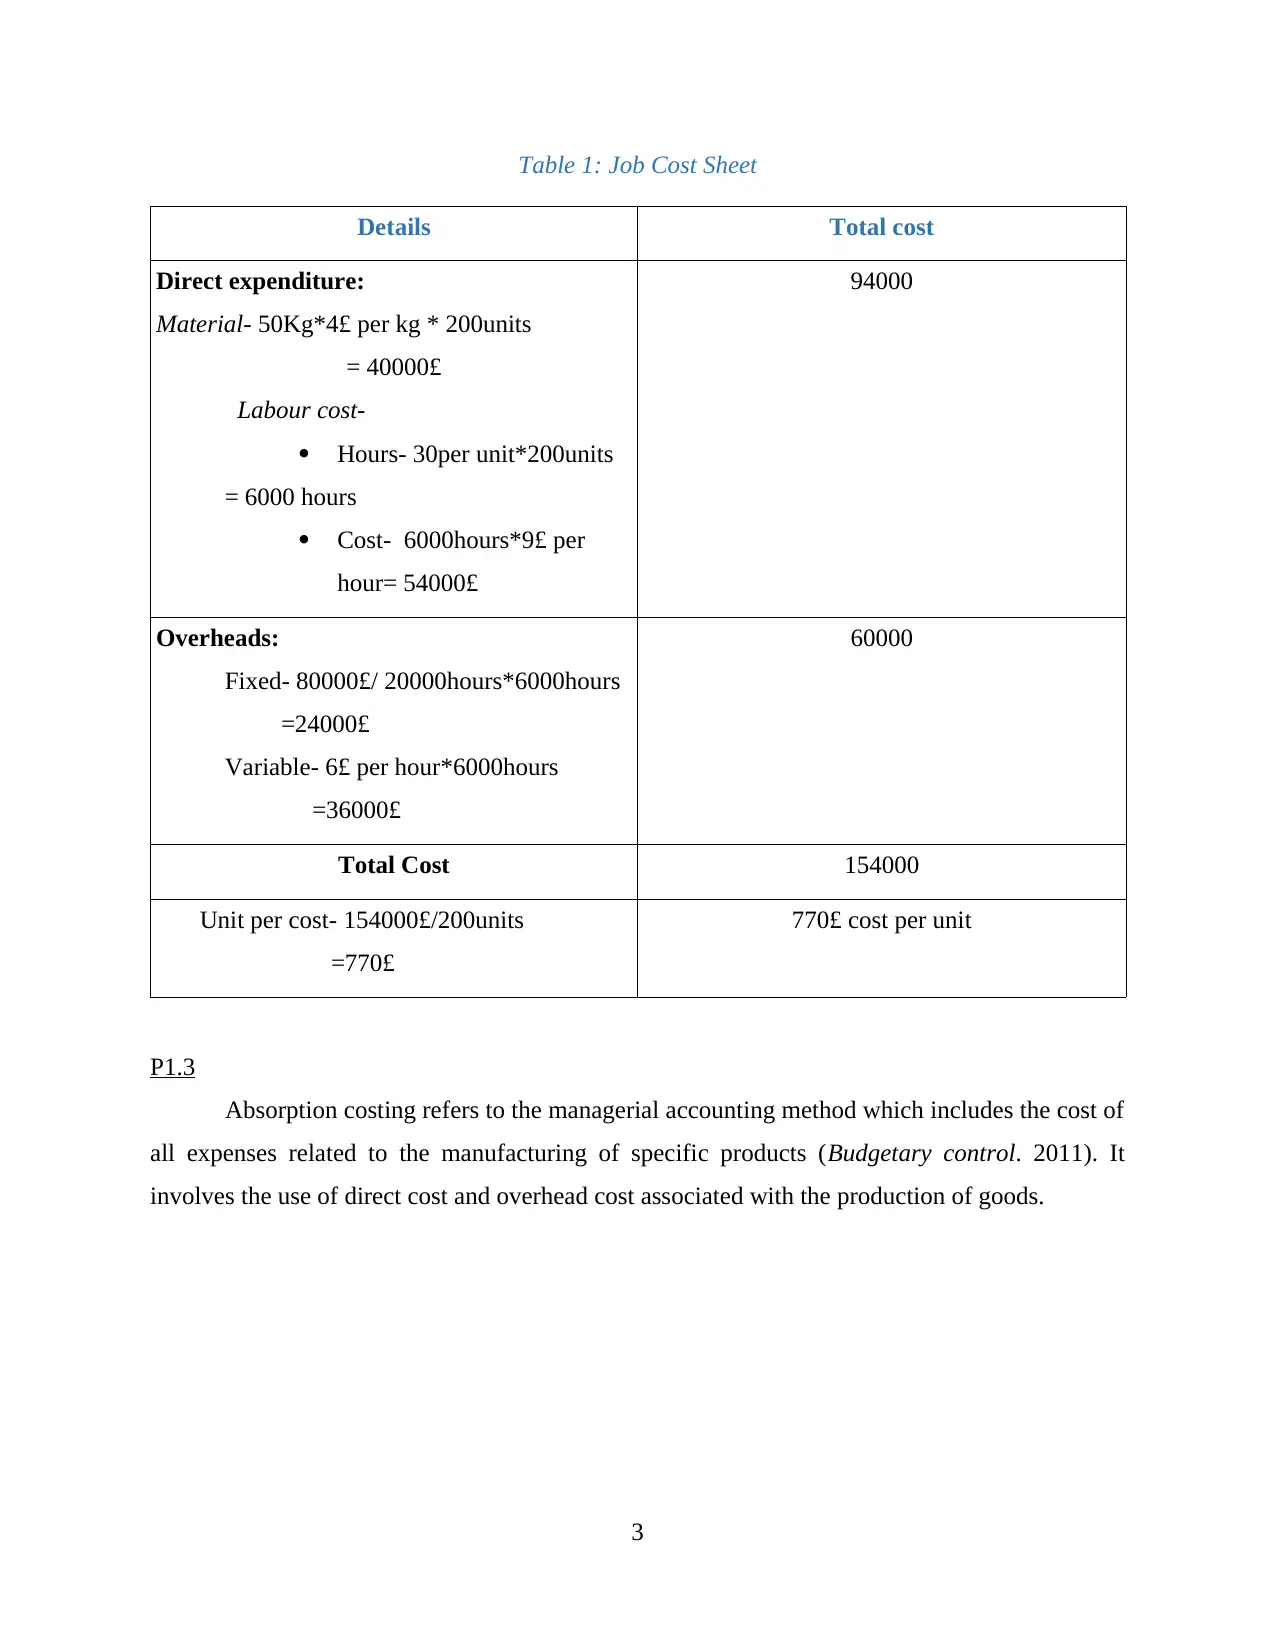
Table 1: Job Cost Sheet
Details Total cost
Direct expenditure:
Material- 50Kg*4£ per kg * 200units
= 40000£
Labour cost-
Hours- 30per unit*200units
= 6000 hours
Cost- 6000hours*9£ per
hour= 54000£
94000
Overheads:
Fixed- 80000£/ 20000hours*6000hours
=24000£
Variable- 6£ per hour*6000hours
=36000£
60000
Total Cost 154000
Unit per cost- 154000£/200units
=770£
770£ cost per unit
P1.3
Absorption costing refers to the managerial accounting method which includes the cost of
all expenses related to the manufacturing of specific products (Budgetary control. 2011). It
involves the use of direct cost and overhead cost associated with the production of goods.
3
⊘ This is a preview!⊘
Do you want full access?
Subscribe today to unlock all pages.
Trusted by 1+ million students worldwide
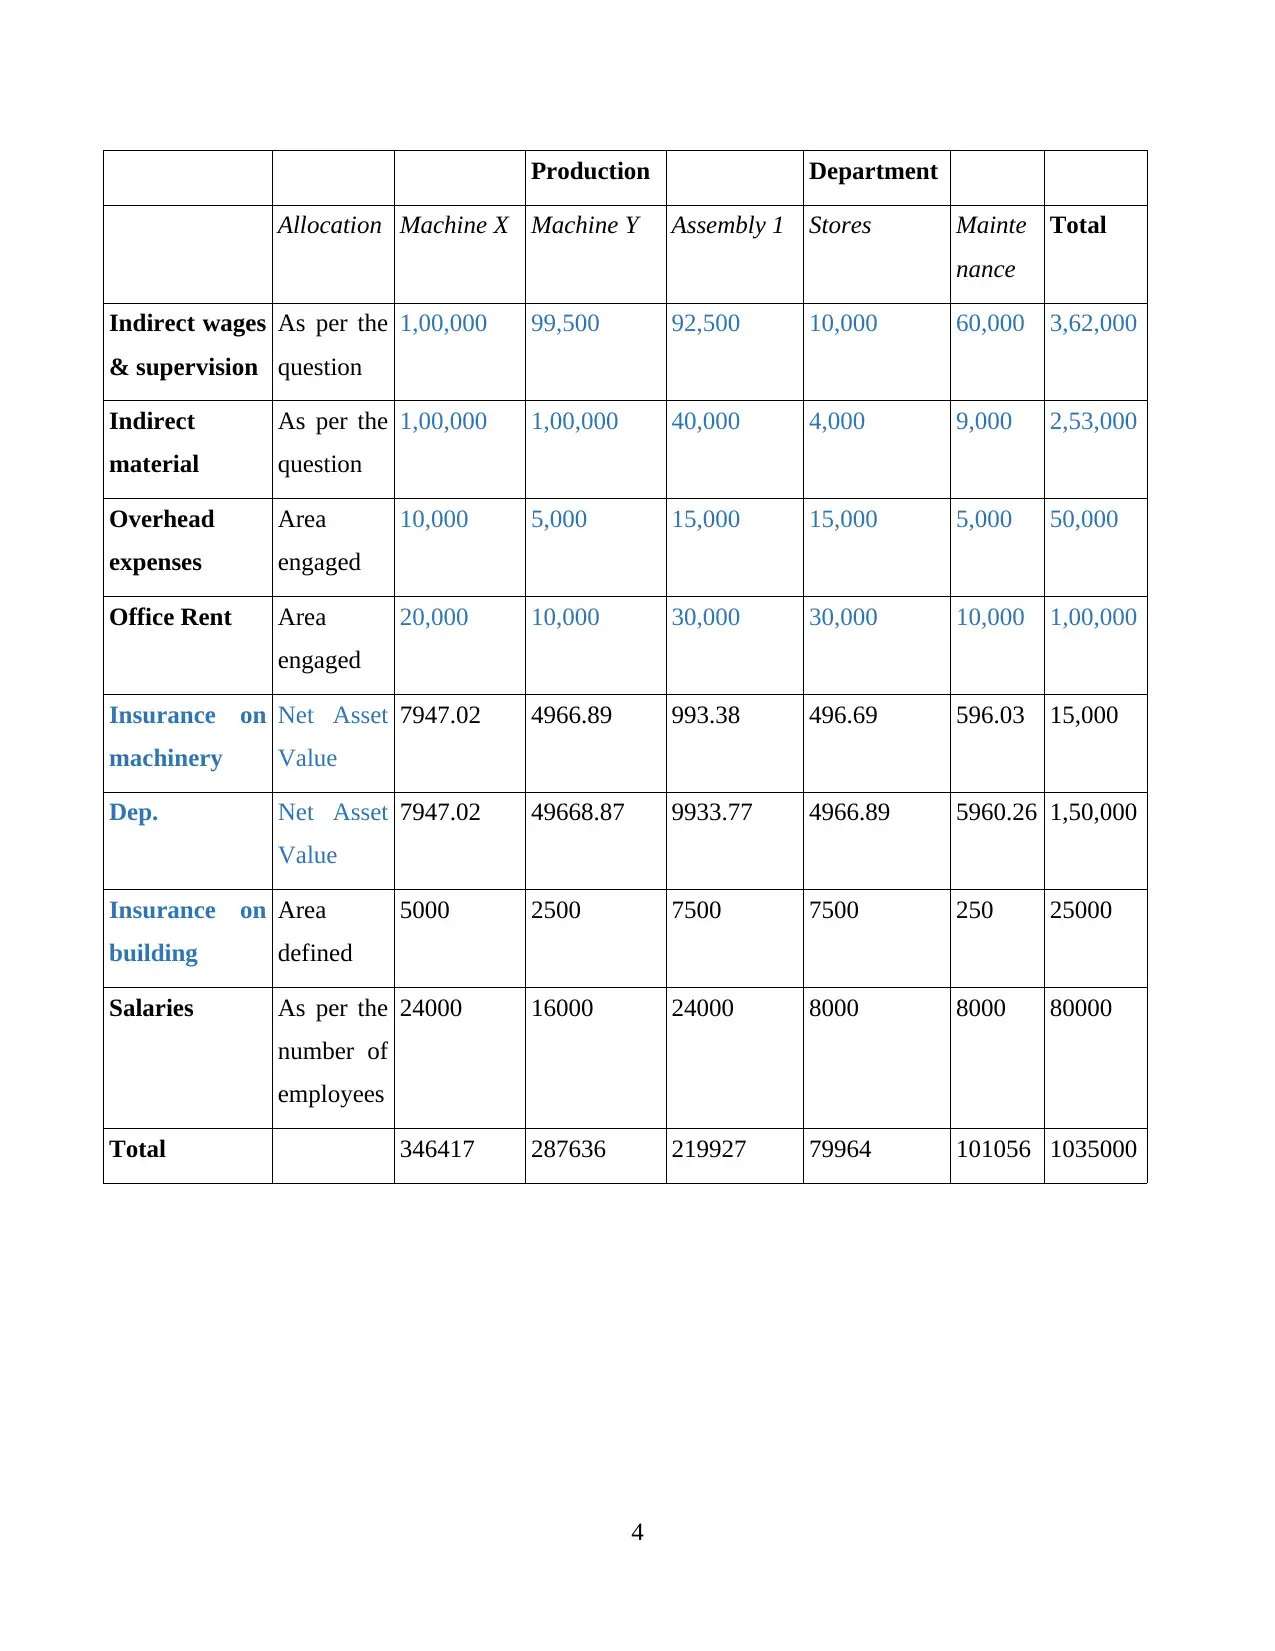
Production Department
Allocation Machine X Machine Y Assembly 1 Stores Mainte
nance
Total
Indirect wages
& supervision
As per the
question
1,00,000 99,500 92,500 10,000 60,000 3,62,000
Indirect
material
As per the
question
1,00,000 1,00,000 40,000 4,000 9,000 2,53,000
Overhead
expenses
Area
engaged
10,000 5,000 15,000 15,000 5,000 50,000
Office Rent Area
engaged
20,000 10,000 30,000 30,000 10,000 1,00,000
Insurance on
machinery
Net Asset
Value
7947.02 4966.89 993.38 496.69 596.03 15,000
Dep. Net Asset
Value
7947.02 49668.87 9933.77 4966.89 5960.26 1,50,000
Insurance on
building
Area
defined
5000 2500 7500 7500 250 25000
Salaries As per the
number of
employees
24000 16000 24000 8000 8000 80000
Total 346417 287636 219927 79964 101056 1035000
4
Paraphrase This Document
Need a fresh take? Get an instant paraphrase of this document with our AI Paraphraser
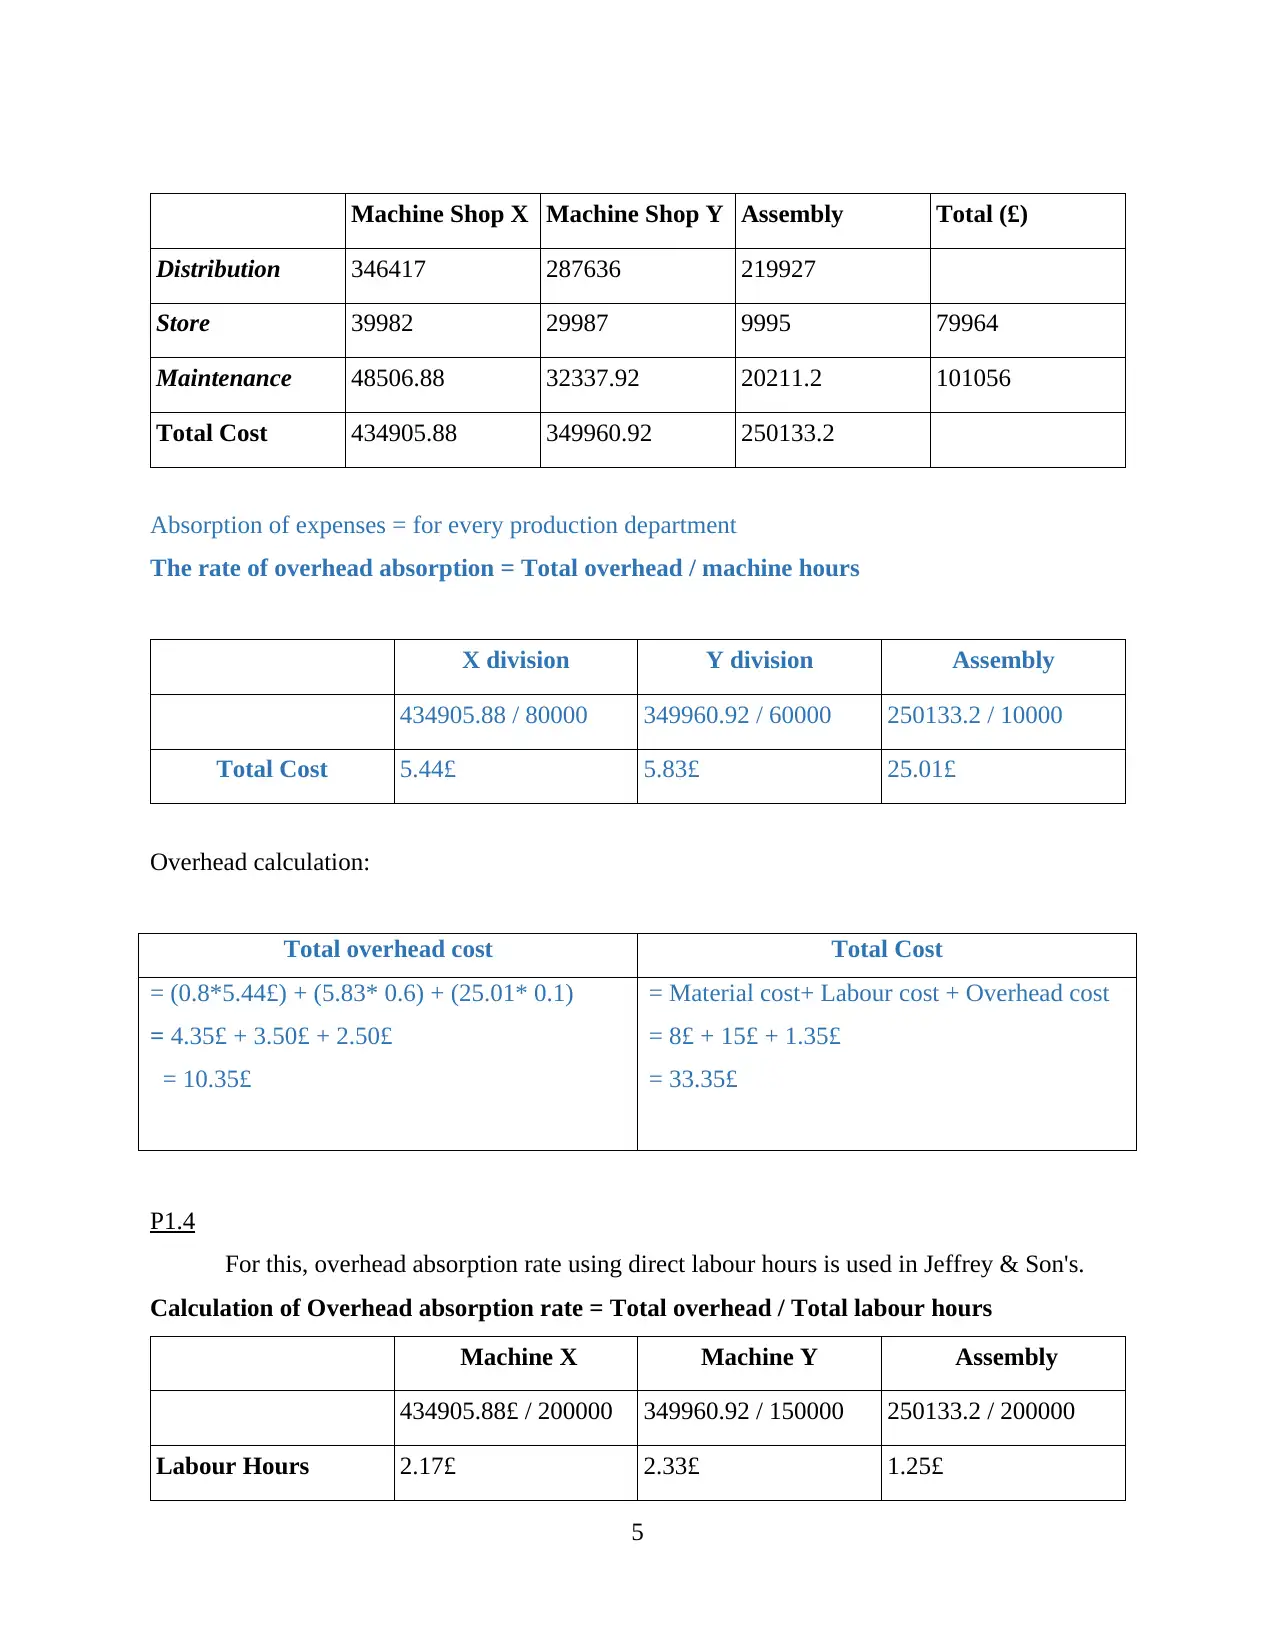
Machine Shop X Machine Shop Y Assembly Total (£)
Distribution 346417 287636 219927
Store 39982 29987 9995 79964
Maintenance 48506.88 32337.92 20211.2 101056
Total Cost 434905.88 349960.92 250133.2
Absorption of expenses = for every production department
The rate of overhead absorption = Total overhead / machine hours
X division Y division Assembly
434905.88 / 80000 349960.92 / 60000 250133.2 / 10000
Total Cost 5.44£ 5.83£ 25.01£
Overhead calculation:
Total overhead cost Total Cost
= (0.8*5.44£) + (5.83* 0.6) + (25.01* 0.1)
= 4.35£ + 3.50£ + 2.50£
= 10.35£
= Material cost+ Labour cost + Overhead cost
= 8£ + 15£ + 1.35£
= 33.35£
P1.4
For this, overhead absorption rate using direct labour hours is used in Jeffrey & Son's.
Calculation of Overhead absorption rate = Total overhead / Total labour hours
Machine X Machine Y Assembly
434905.88£ / 200000 349960.92 / 150000 250133.2 / 200000
Labour Hours 2.17£ 2.33£ 1.25£
5
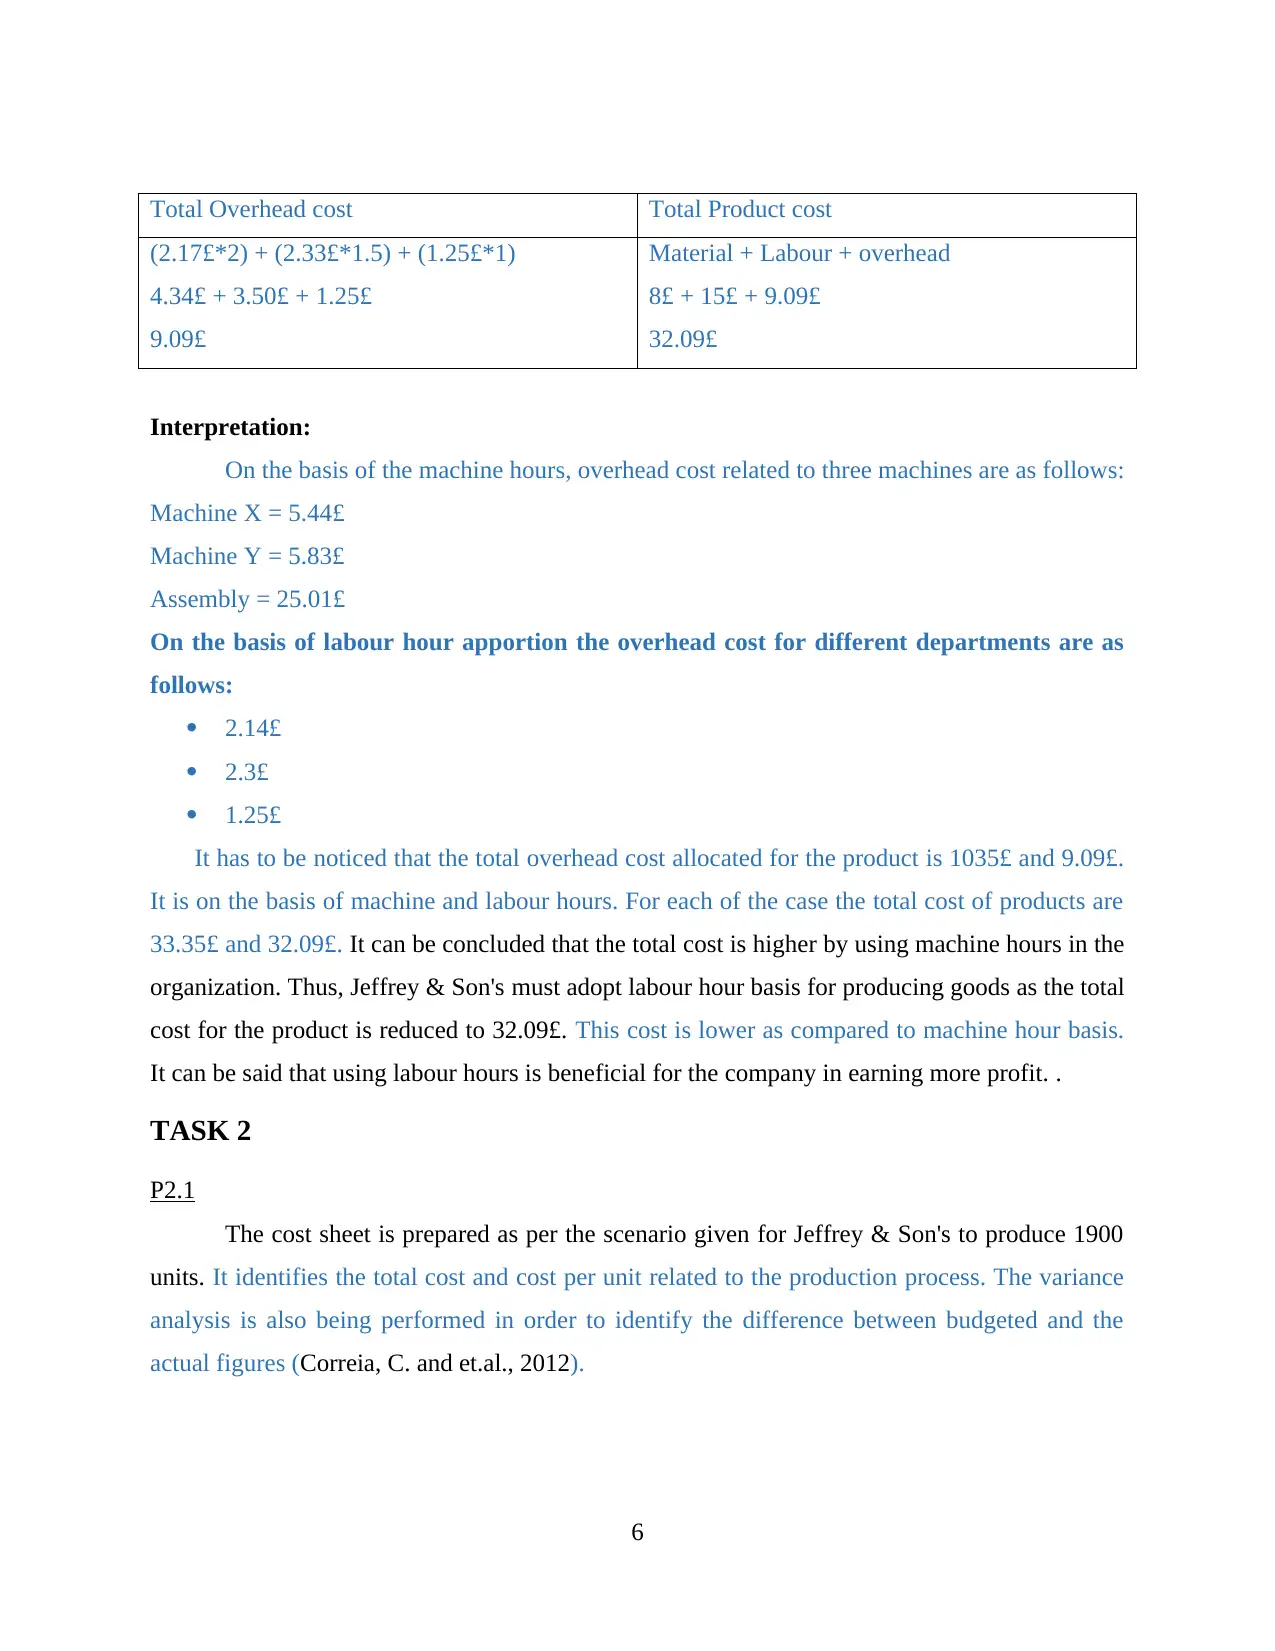
Total Overhead cost Total Product cost
(2.17£*2) + (2.33£*1.5) + (1.25£*1)
4.34£ + 3.50£ + 1.25£
9.09£
Material + Labour + overhead
8£ + 15£ + 9.09£
32.09£
Interpretation:
On the basis of the machine hours, overhead cost related to three machines are as follows:
Machine X = 5.44£
Machine Y = 5.83£
Assembly = 25.01£
On the basis of labour hour apportion the overhead cost for different departments are as
follows:
2.14£
2.3£
1.25£
It has to be noticed that the total overhead cost allocated for the product is 1035£ and 9.09£.
It is on the basis of machine and labour hours. For each of the case the total cost of products are
33.35£ and 32.09£. It can be concluded that the total cost is higher by using machine hours in the
organization. Thus, Jeffrey & Son's must adopt labour hour basis for producing goods as the total
cost for the product is reduced to 32.09£. This cost is lower as compared to machine hour basis.
It can be said that using labour hours is beneficial for the company in earning more profit. .
TASK 2
P2.1
The cost sheet is prepared as per the scenario given for Jeffrey & Son's to produce 1900
units. It identifies the total cost and cost per unit related to the production process. The variance
analysis is also being performed in order to identify the difference between budgeted and the
actual figures (Correia, C. and et.al., 2012).
6
⊘ This is a preview!⊘
Do you want full access?
Subscribe today to unlock all pages.
Trusted by 1+ million students worldwide
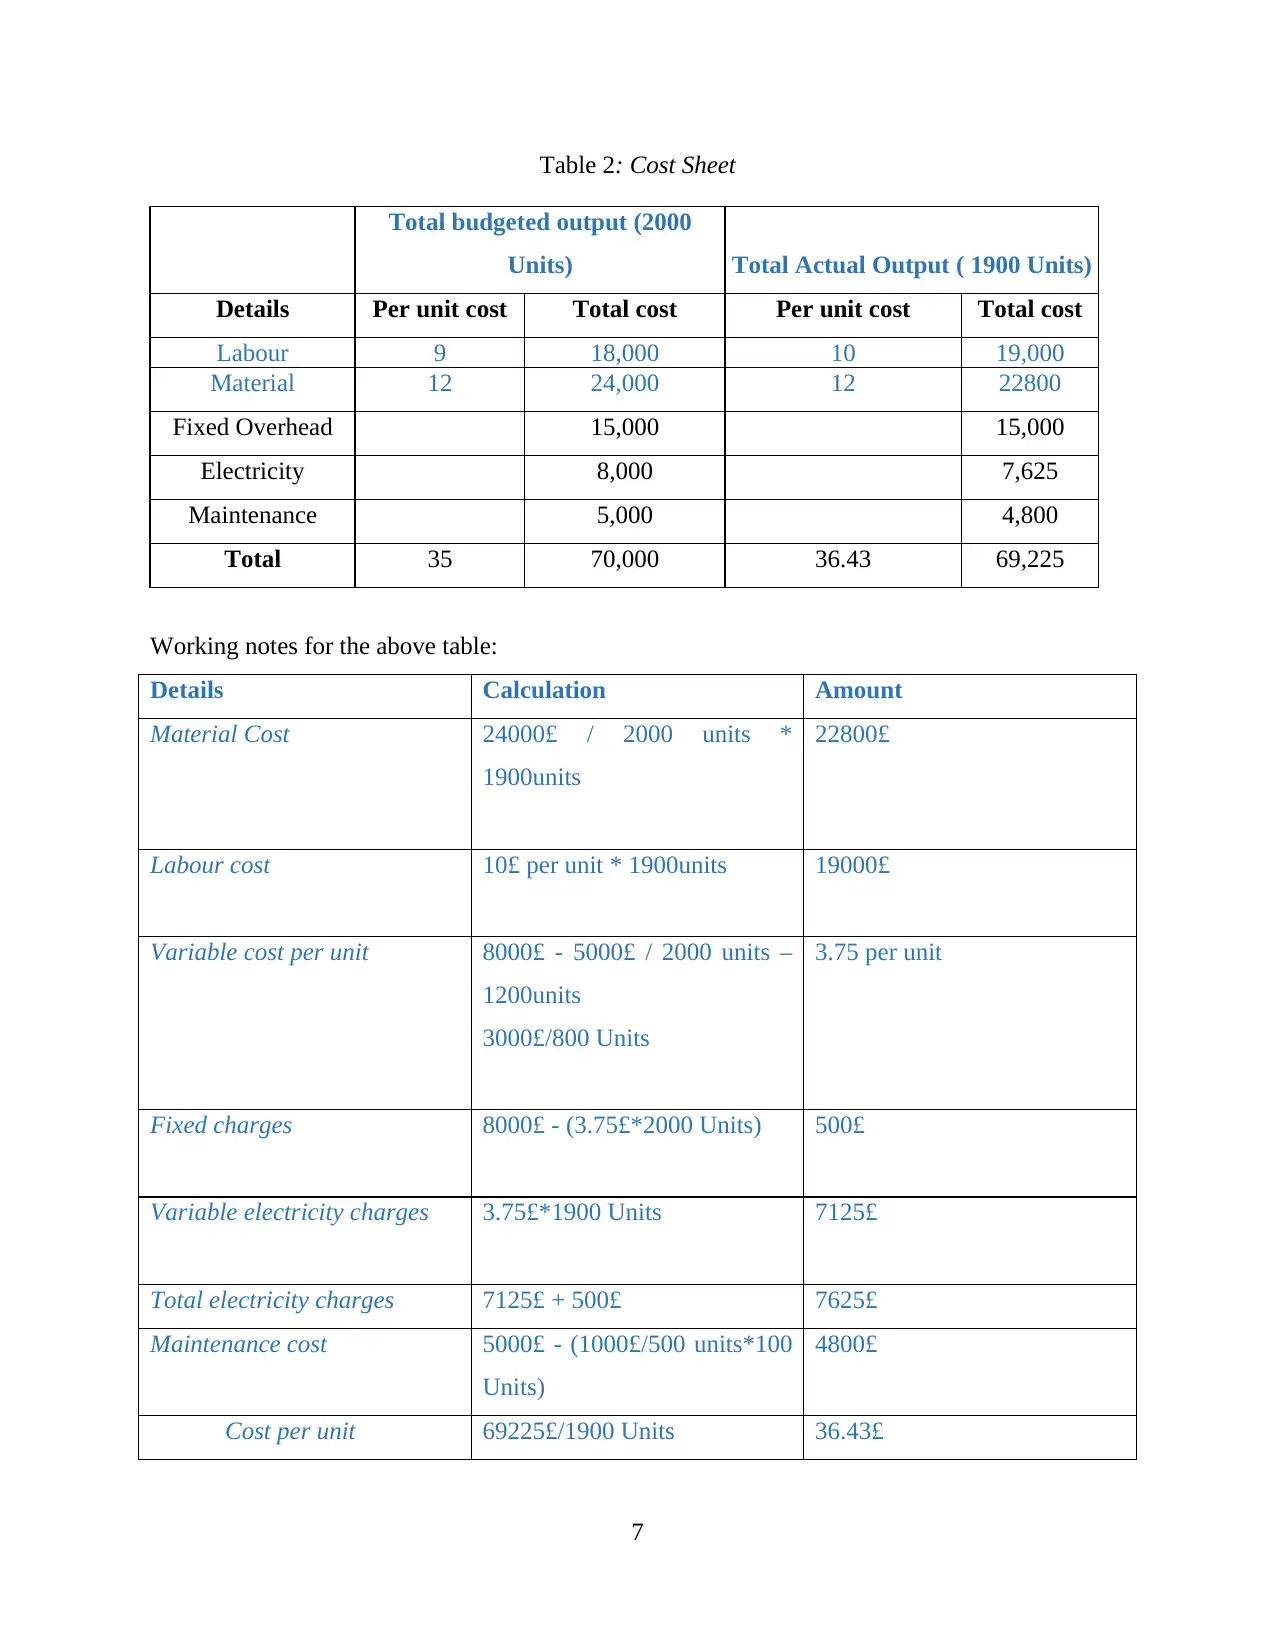
Table 2: Cost Sheet
Total budgeted output (2000
Units) Total Actual Output ( 1900 Units)
Details Per unit cost Total cost Per unit cost Total cost
Labour 9 18,000 10 19,000
Material 12 24,000 12 22800
Fixed Overhead 15,000 15,000
Electricity 8,000 7,625
Maintenance 5,000 4,800
Total 35 70,000 36.43 69,225
Working notes for the above table:
Details Calculation Amount
Material Cost 24000£ / 2000 units *
1900units
22800£
Labour cost 10£ per unit * 1900units 19000£
Variable cost per unit 8000£ - 5000£ / 2000 units –
1200units
3000£/800 Units
3.75 per unit
Fixed charges 8000£ - (3.75£*2000 Units) 500£
Variable electricity charges 3.75£*1900 Units 7125£
Total electricity charges 7125£ + 500£ 7625£
Maintenance cost 5000£ - (1000£/500 units*100
Units)
4800£
Cost per unit 69225£/1900 Units 36.43£
7
Paraphrase This Document
Need a fresh take? Get an instant paraphrase of this document with our AI Paraphraser
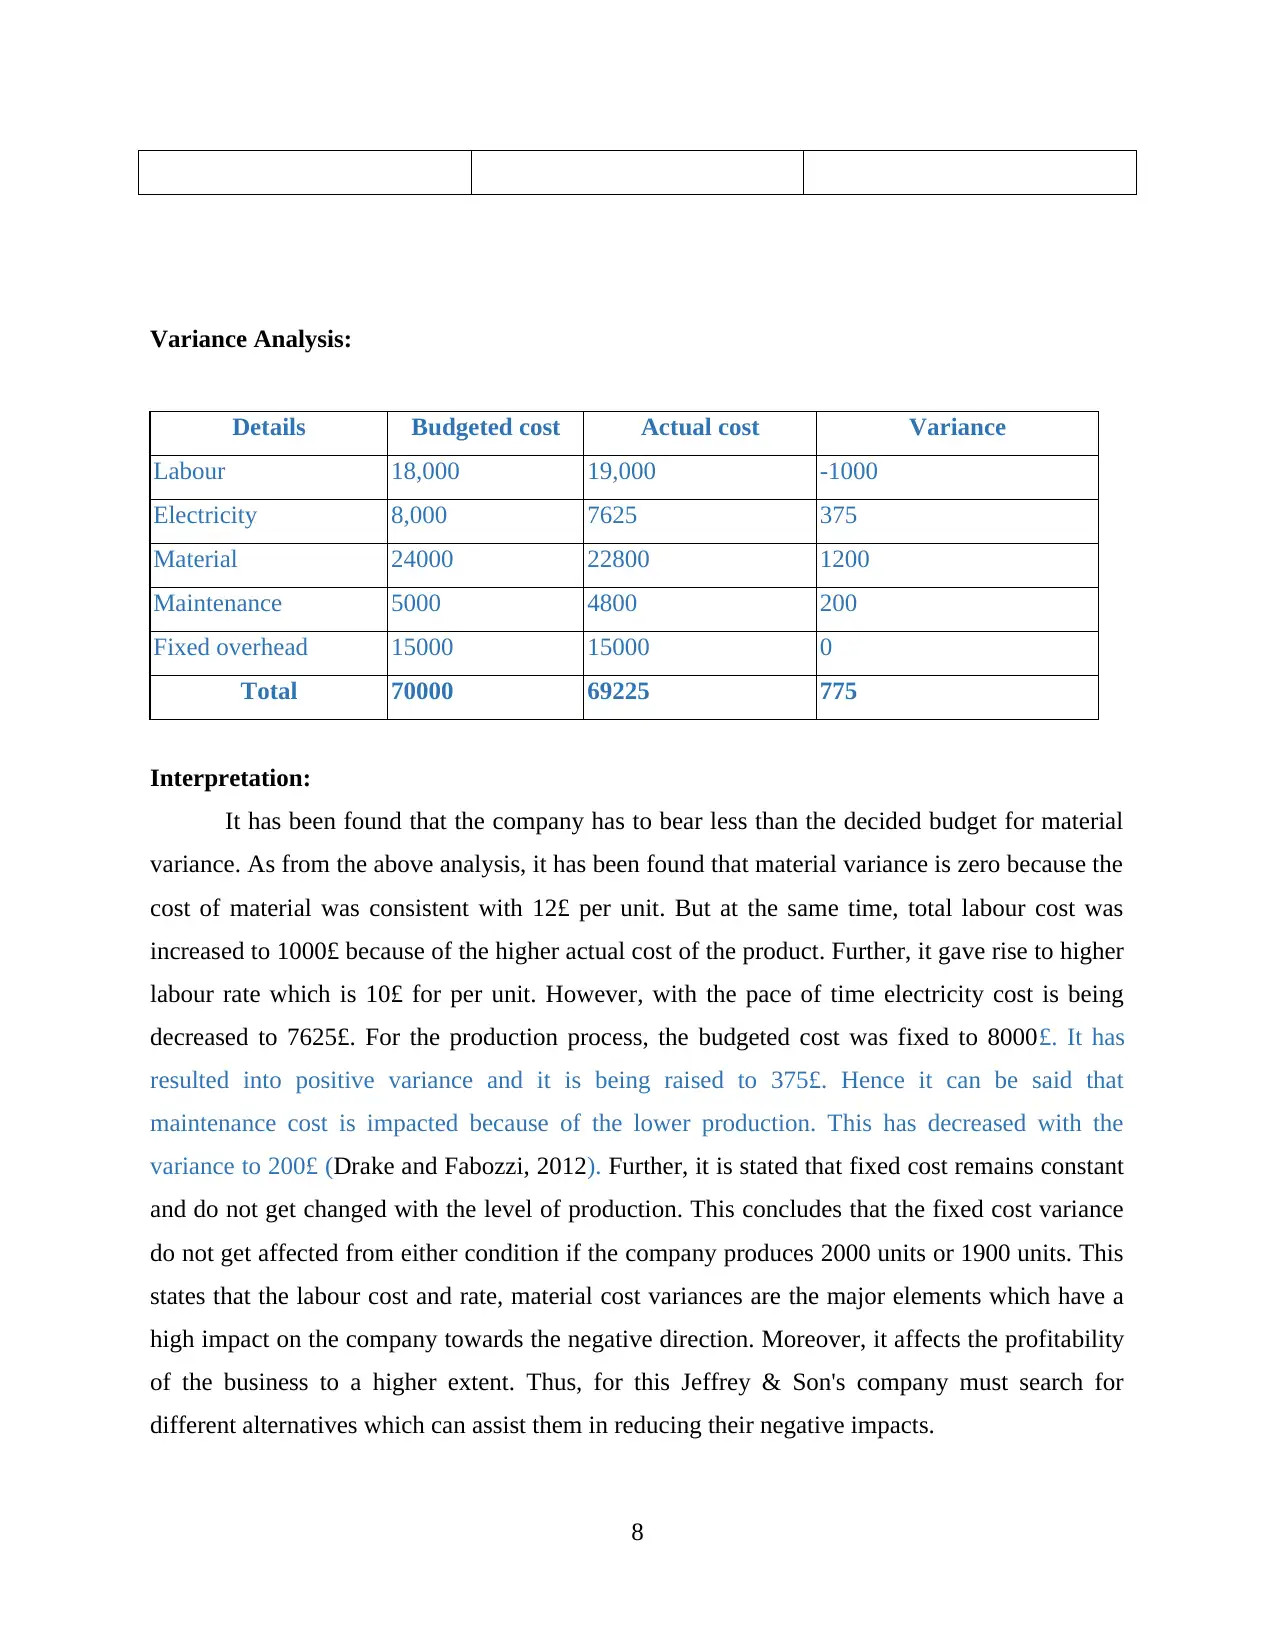
Variance Analysis:
Details Budgeted cost Actual cost Variance
Labour 18,000 19,000 -1000
Electricity 8,000 7625 375
Material 24000 22800 1200
Maintenance 5000 4800 200
Fixed overhead 15000 15000 0
Total 70000 69225 775
Interpretation:
It has been found that the company has to bear less than the decided budget for material
variance. As from the above analysis, it has been found that material variance is zero because the
cost of material was consistent with 12£ per unit. But at the same time, total labour cost was
increased to 1000£ because of the higher actual cost of the product. Further, it gave rise to higher
labour rate which is 10£ for per unit. However, with the pace of time electricity cost is being
decreased to 7625£. For the production process, the budgeted cost was fixed to 8000£. It has
resulted into positive variance and it is being raised to 375£. Hence it can be said that
maintenance cost is impacted because of the lower production. This has decreased with the
variance to 200£ (Drake and Fabozzi, 2012). Further, it is stated that fixed cost remains constant
and do not get changed with the level of production. This concludes that the fixed cost variance
do not get affected from either condition if the company produces 2000 units or 1900 units. This
states that the labour cost and rate, material cost variances are the major elements which have a
high impact on the company towards the negative direction. Moreover, it affects the profitability
of the business to a higher extent. Thus, for this Jeffrey & Son's company must search for
different alternatives which can assist them in reducing their negative impacts.
8
P2.2
In Jeffrey & Son's, they use different types of performance indicators which assist them
to evaluate potential improvements in the company. The following tools are used for identifying
performance:
Business sales- It is an efficient tool used to evaluate performance of the organization.
The increasing sales indicate that the company is enhancing its productivity and earning
more profits. With the increase in turnover, the firm can be improve its performance at
the higher extent (Gitman, Joehnk and Billingsley, 2013). This can be ensured by
providing the customers with high quality products at the adequate prices. Further,
Jeffrey & Son's must use effective advertising, sales promotion and after sales services to
the customers.
Business profitability- It is one of the most effective methods used to identify the
performance of company. It determines the clear view as higher the profit refers to
increase in the performance of the firm. For this, the organization prepares financial
statement which help to define the business operational results. Further, it also assist the
company to identify the areas which gives higher returns in terms of sales and profit and
make provisions to reduce the cost and earn maximum revenue (Iazzolino, Laise and
Marraro, 2012).
Business position- The performance of the organization can also be evaluated by
comparing its business position with the other competitors. It can be done by comparing
on the basis of total sales and profit of each industry. The higher contribution of the
company states the performance of the firm and vice-versa (Legutko and Klingler, 2011).
Further, customer feedback also helps in checking the satisfaction level of the customers
in regard to company's products. This also assists in analysing the performance of the
organization.
P2.3
Every business is established to earn maximum profit and grow in the market. For this it
requires to reduce the cost of production, enhancing the value and maintain the quality for
achieving the goals of the company in an efficient manner. It becomes crucial for Jeffrey & Son's
to use several measures to reduce the cost and get higher yield. For this, the company must
reduce the business cost by using better and upgraded technology, cutting down the unnecessary
9
⊘ This is a preview!⊘
Do you want full access?
Subscribe today to unlock all pages.
Trusted by 1+ million students worldwide
1 out of 23
Related Documents


Your All-in-One AI-Powered Toolkit for Academic Success.
+13062052269
info@desklib.com
Available 24*7 on WhatsApp / Email
![[object Object]](/_next/static/media/star-bottom.7253800d.svg)
Unlock your academic potential
Copyright © 2020–2026 A2Z Services. All Rights Reserved. Developed and managed by ZUCOL.