Management Accounting: Costing, Budgeting, and Inventory Analysis
VerifiedAdded on 2020/06/06
|17
|3923
|62
Report
AI Summary
This report delves into the fundamentals of management accounting, crucial for organizational growth and decision-making. It explores cost classification, differentiating between fixed, variable, and semi-variable costs, along with other classification methods. The report includes calculations of costs at various production levels and their graphical analysis. Inventory valuation methods, specifically FIFO, LIFO, and the average inventory method, are examined with detailed calculations. A January month report is prepared using these inventory methods. Furthermore, the report discusses diverse performance indicators, emphasizing cost reduction and value enhancement within an organization. The second part of the report focuses on budgeting, including its objectives and the process of budget preparation, followed by the preparation of different budgets and a cash budget. The final section covers the computation of budgeted statements.
Management Accounting:
Costing and Budgeting
Costing and Budgeting
Paraphrase This Document
Need a fresh take? Get an instant paraphrase of this document with our AI Paraphraser
Table of Contents
INTRODUCTION...........................................................................................................................1
TASK 1............................................................................................................................................1
Q1................................................................................................................................................1
a). Cost classification into Fixed, variable and semi-variable costs:..........................................1
b). Explain other ways of classifying costs:................................................................................2
Q2. ..............................................................................................................................................3
A). Calculation of costs at various level:....................................................................................3
B). Analysis the cost via graphs..................................................................................................4
Q3 Calculation of inventory by using FIFO,LIFO and average inventory method:...................4
Q4 Preparation of January month report through using inventory methods:..............................6
Q5. ..............................................................................................................................................6
a). Diverse performance indicators:............................................................................................6
b).................................................................................................................................................7
1. To reduce costs:.......................................................................................................................7
2. To enhance value:...................................................................................................................7
TASK 2............................................................................................................................................8
Q6................................................................................................................................................8
a). Budget:...................................................................................................................................8
B). Objectives of budget formulation:........................................................................................8
c). Process of budget preparation:...............................................................................................8
Q7: Preparation of different budgets...........................................................................................9
Q8.Cash Budget .......................................................................................................................10
TASK 3..........................................................................................................................................10
Q9. Computation of budgeted statements.................................................................................10
Q10............................................................................................................................................11
CONCLUSION..............................................................................................................................12
REFERENCES..............................................................................................................................13

⊘ This is a preview!⊘
Do you want full access?
Subscribe today to unlock all pages.
Trusted by 1+ million students worldwide
INTRODUCTION
Management accounting tools are an essential aspect for growing the firm's development
and likewise support firm's management. In order to make decision for short term as well as long
term, managers should need to prepare management reports and accounts to get accurate result
and provide financial and statistical information (Renz, 2016). The main aim of this report is to
know that how management accounting uses financial data in order to making planning,
monitoring and control of the finance within organisation. Therefore it is necessary to introduce
the fundamentals of management accounting which applies within the organisation in order to
operate business environment. Therefore the methods and techniques and tools should need to be
implemented in order to control the usage of finance which help an organisation to face the
financial problems (Suomala, Lyly-Yrjänäinen and Lukka, 2014).
TASK 1
Q1
a). Cost classification into Fixed, variable and semi-variable costs:
Cost: This is the main aspect for producing a good. If the management of the smart look
Ltd effectively implement management accounting tools in a firm the company could get the
sustainable development in the firm. Cost is divided into three parts which are namely: fixed,
variable and semi-variable costs.
Costs are divided into two parts; direct and indirect costs. Direct costs are those which are
directly connected to producing of units. While indirect costs are those which are ultimately not
related to the cost of production but indirectly contribute to the costs of production (Ward,
2012).
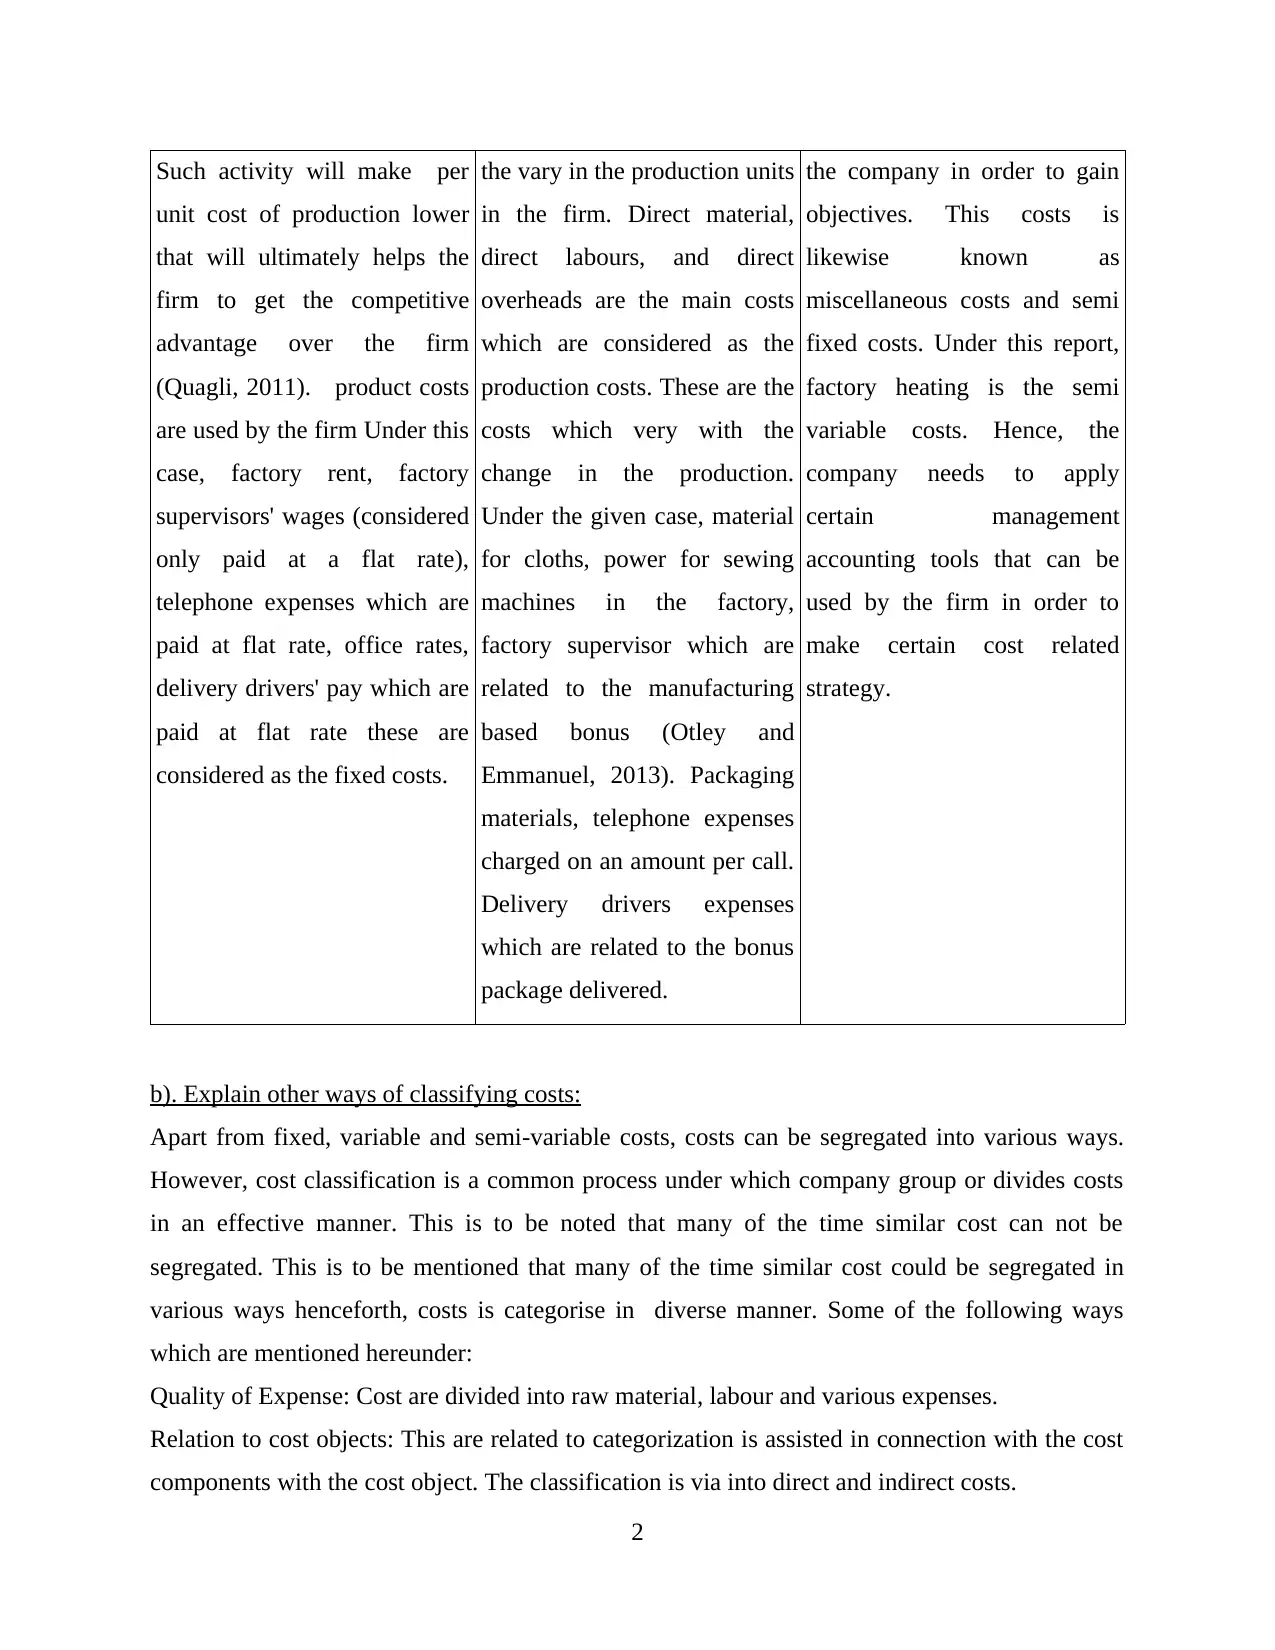
Cost are namely divided as follows:
Fixed costs Variable costs Semi-variable costs
This is the cost that constantly
fixed irrespective of change in
the output or sales revenue.
These are optimum used if
production is highly produced.
This is the cost which vary as
per the change in the cost of
production. This makes does
not effect on the cost of
production as this change with
A semi- variable costs are
those which are half variable
and half fixed. However, there
is a need to apportioned these
costs that are totally used by
1
Management accounting tools are an essential aspect for growing the firm's development
and likewise support firm's management. In order to make decision for short term as well as long
term, managers should need to prepare management reports and accounts to get accurate result
and provide financial and statistical information (Renz, 2016). The main aim of this report is to
know that how management accounting uses financial data in order to making planning,
monitoring and control of the finance within organisation. Therefore it is necessary to introduce
the fundamentals of management accounting which applies within the organisation in order to
operate business environment. Therefore the methods and techniques and tools should need to be
implemented in order to control the usage of finance which help an organisation to face the
financial problems (Suomala, Lyly-Yrjänäinen and Lukka, 2014).
TASK 1
Q1
a). Cost classification into Fixed, variable and semi-variable costs:
Cost: This is the main aspect for producing a good. If the management of the smart look
Ltd effectively implement management accounting tools in a firm the company could get the
sustainable development in the firm. Cost is divided into three parts which are namely: fixed,
variable and semi-variable costs.
Costs are divided into two parts; direct and indirect costs. Direct costs are those which are
directly connected to producing of units. While indirect costs are those which are ultimately not
related to the cost of production but indirectly contribute to the costs of production (Ward,
2012).
Cost are namely divided as follows:
Fixed costs Variable costs Semi-variable costs
This is the cost that constantly
fixed irrespective of change in
the output or sales revenue.
These are optimum used if
production is highly produced.
This is the cost which vary as
per the change in the cost of
production. This makes does
not effect on the cost of
production as this change with
A semi- variable costs are
those which are half variable
and half fixed. However, there
is a need to apportioned these
costs that are totally used by
1
Paraphrase This Document
Need a fresh take? Get an instant paraphrase of this document with our AI Paraphraser
Such activity will make per
unit cost of production lower
that will ultimately helps the
firm to get the competitive
advantage over the firm
(Quagli, 2011). product costs
are used by the firm Under this
case, factory rent, factory
supervisors' wages (considered
only paid at a flat rate),
telephone expenses which are
paid at flat rate, office rates,
delivery drivers' pay which are
paid at flat rate these are
considered as the fixed costs.
the vary in the production units
in the firm. Direct material,
direct labours, and direct
overheads are the main costs
which are considered as the
production costs. These are the
costs which very with the
change in the production.
Under the given case, material
for cloths, power for sewing
machines in the factory,
factory supervisor which are
related to the manufacturing
based bonus (Otley and
Emmanuel, 2013). Packaging
materials, telephone expenses
charged on an amount per call.
Delivery drivers expenses
which are related to the bonus
package delivered.
the company in order to gain
objectives. This costs is
likewise known as
miscellaneous costs and semi
fixed costs. Under this report,
factory heating is the semi
variable costs. Hence, the
company needs to apply
certain management
accounting tools that can be
used by the firm in order to
make certain cost related
strategy.
b). Explain other ways of classifying costs:
Apart from fixed, variable and semi-variable costs, costs can be segregated into various ways.
However, cost classification is a common process under which company group or divides costs
in an effective manner. This is to be noted that many of the time similar cost can not be
segregated. This is to be mentioned that many of the time similar cost could be segregated in
various ways henceforth, costs is categorise in diverse manner. Some of the following ways
which are mentioned hereunder:
Quality of Expense: Cost are divided into raw material, labour and various expenses.
Relation to cost objects: This are related to categorization is assisted in connection with the cost
components with the cost object. The classification is via into direct and indirect costs.
2
Purpose: Cost can be divided into various purposes.
Components of Production costs,
Relation to time,
Avoidable and unavoidable
Manageable and unmanageable
Real and notional costs
Relevant costs
Sunk costs
Q2.
A). Calculation of costs at various level:
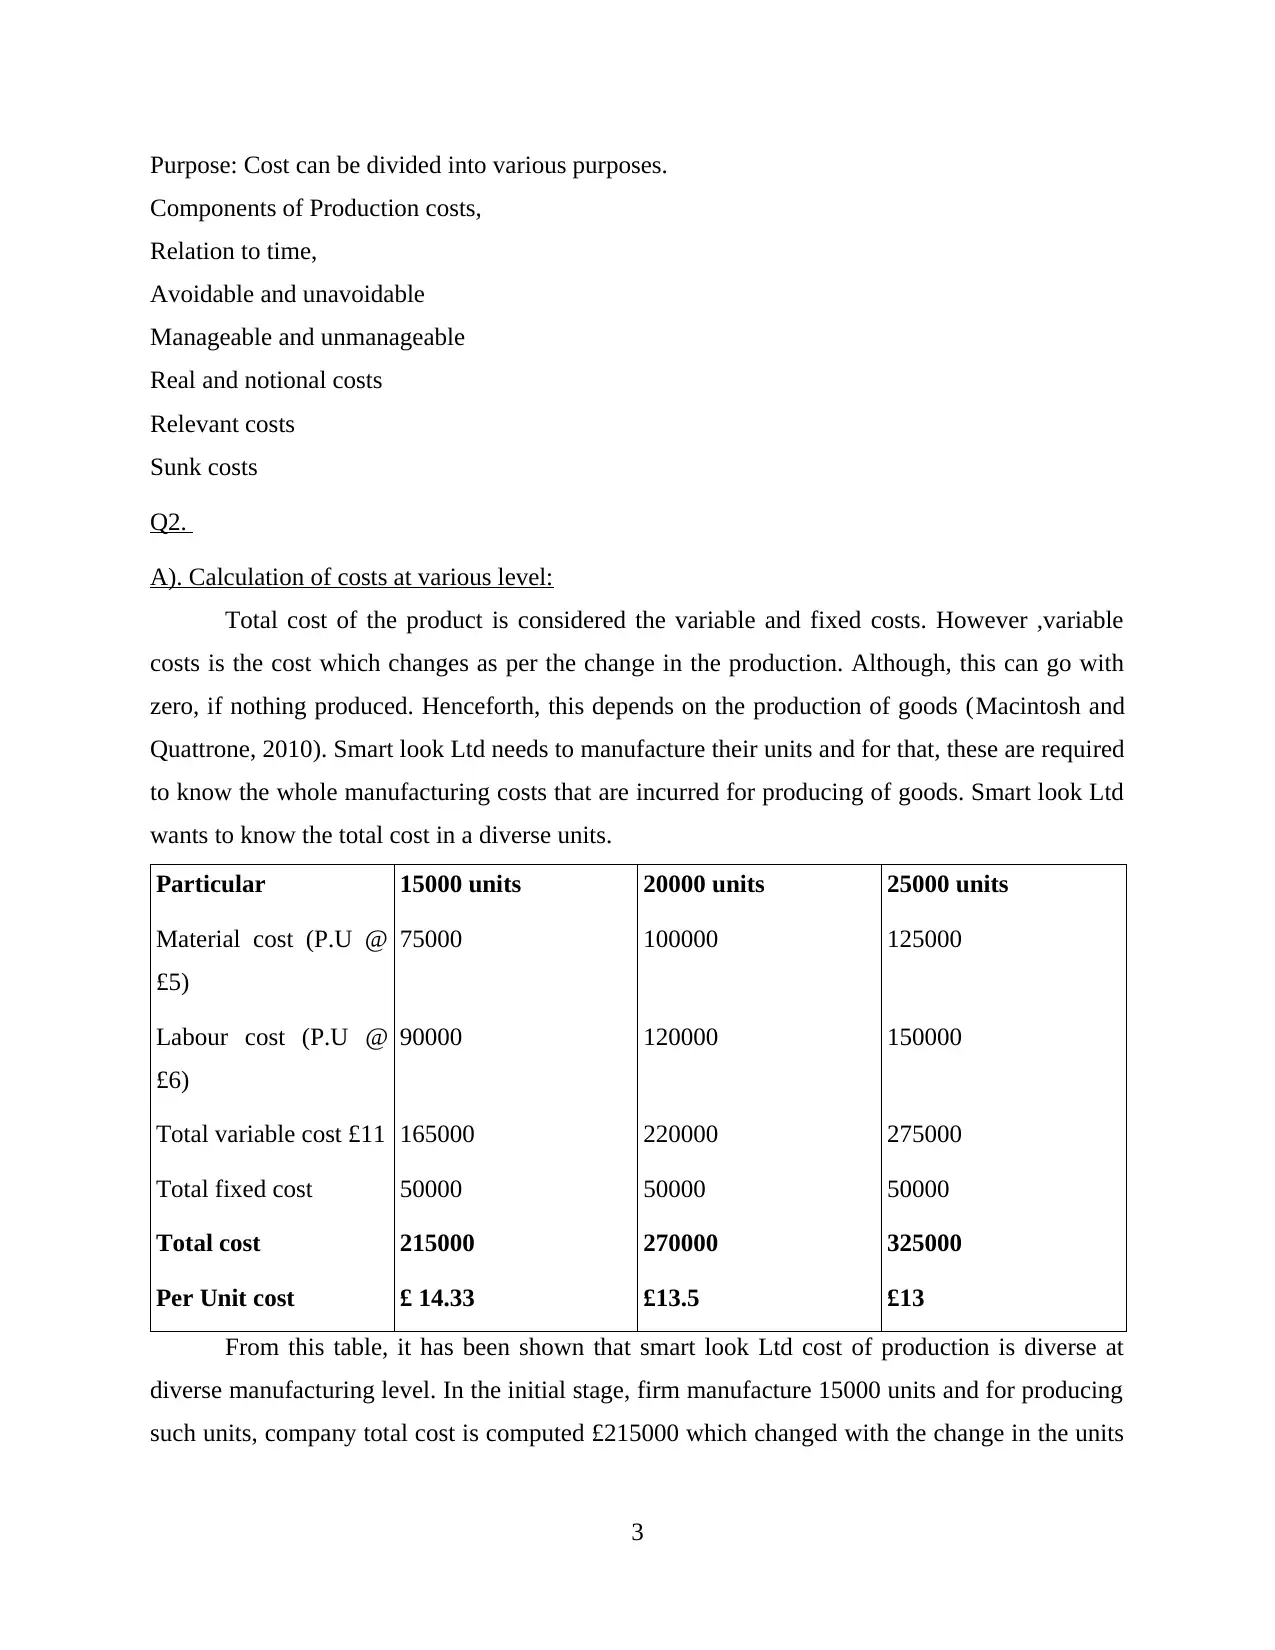
Total cost of the product is considered the variable and fixed costs. However ,variable
costs is the cost which changes as per the change in the production. Although, this can go with
zero, if nothing produced. Henceforth, this depends on the production of goods (Macintosh and
Quattrone, 2010). Smart look Ltd needs to manufacture their units and for that, these are required
to know the whole manufacturing costs that are incurred for producing of goods. Smart look Ltd
wants to know the total cost in a diverse units.
Particular 15000 units 20000 units 25000 units
Material cost (P.U @
£5)
75000 100000 125000
Labour cost (P.U @
£6)
90000 120000 150000
Total variable cost £11 165000 220000 275000
Total fixed cost 50000 50000 50000
Total cost 215000 270000 325000
Per Unit cost £ 14.33 £13.5 £13
From this table, it has been shown that smart look Ltd cost of production is diverse at
diverse manufacturing level. In the initial stage, firm manufacture 15000 units and for producing
such units, company total cost is computed £215000 which changed with the change in the units
3
Components of Production costs,
Relation to time,
Avoidable and unavoidable
Manageable and unmanageable
Real and notional costs
Relevant costs
Sunk costs
Q2.
A). Calculation of costs at various level:
Total cost of the product is considered the variable and fixed costs. However ,variable
costs is the cost which changes as per the change in the production. Although, this can go with
zero, if nothing produced. Henceforth, this depends on the production of goods (Macintosh and
Quattrone, 2010). Smart look Ltd needs to manufacture their units and for that, these are required
to know the whole manufacturing costs that are incurred for producing of goods. Smart look Ltd
wants to know the total cost in a diverse units.
Particular 15000 units 20000 units 25000 units
Material cost (P.U @
£5)
75000 100000 125000
Labour cost (P.U @
£6)
90000 120000 150000
Total variable cost £11 165000 220000 275000
Total fixed cost 50000 50000 50000
Total cost 215000 270000 325000
Per Unit cost £ 14.33 £13.5 £13
From this table, it has been shown that smart look Ltd cost of production is diverse at
diverse manufacturing level. In the initial stage, firm manufacture 15000 units and for producing
such units, company total cost is computed £215000 which changed with the change in the units
3
⊘ This is a preview!⊘
Do you want full access?
Subscribe today to unlock all pages.
Trusted by 1+ million students worldwide
of production, for producing 20000 units, the total cost is calculated as £270000. while
producing 250000 units, the total cost is reached to £325000.
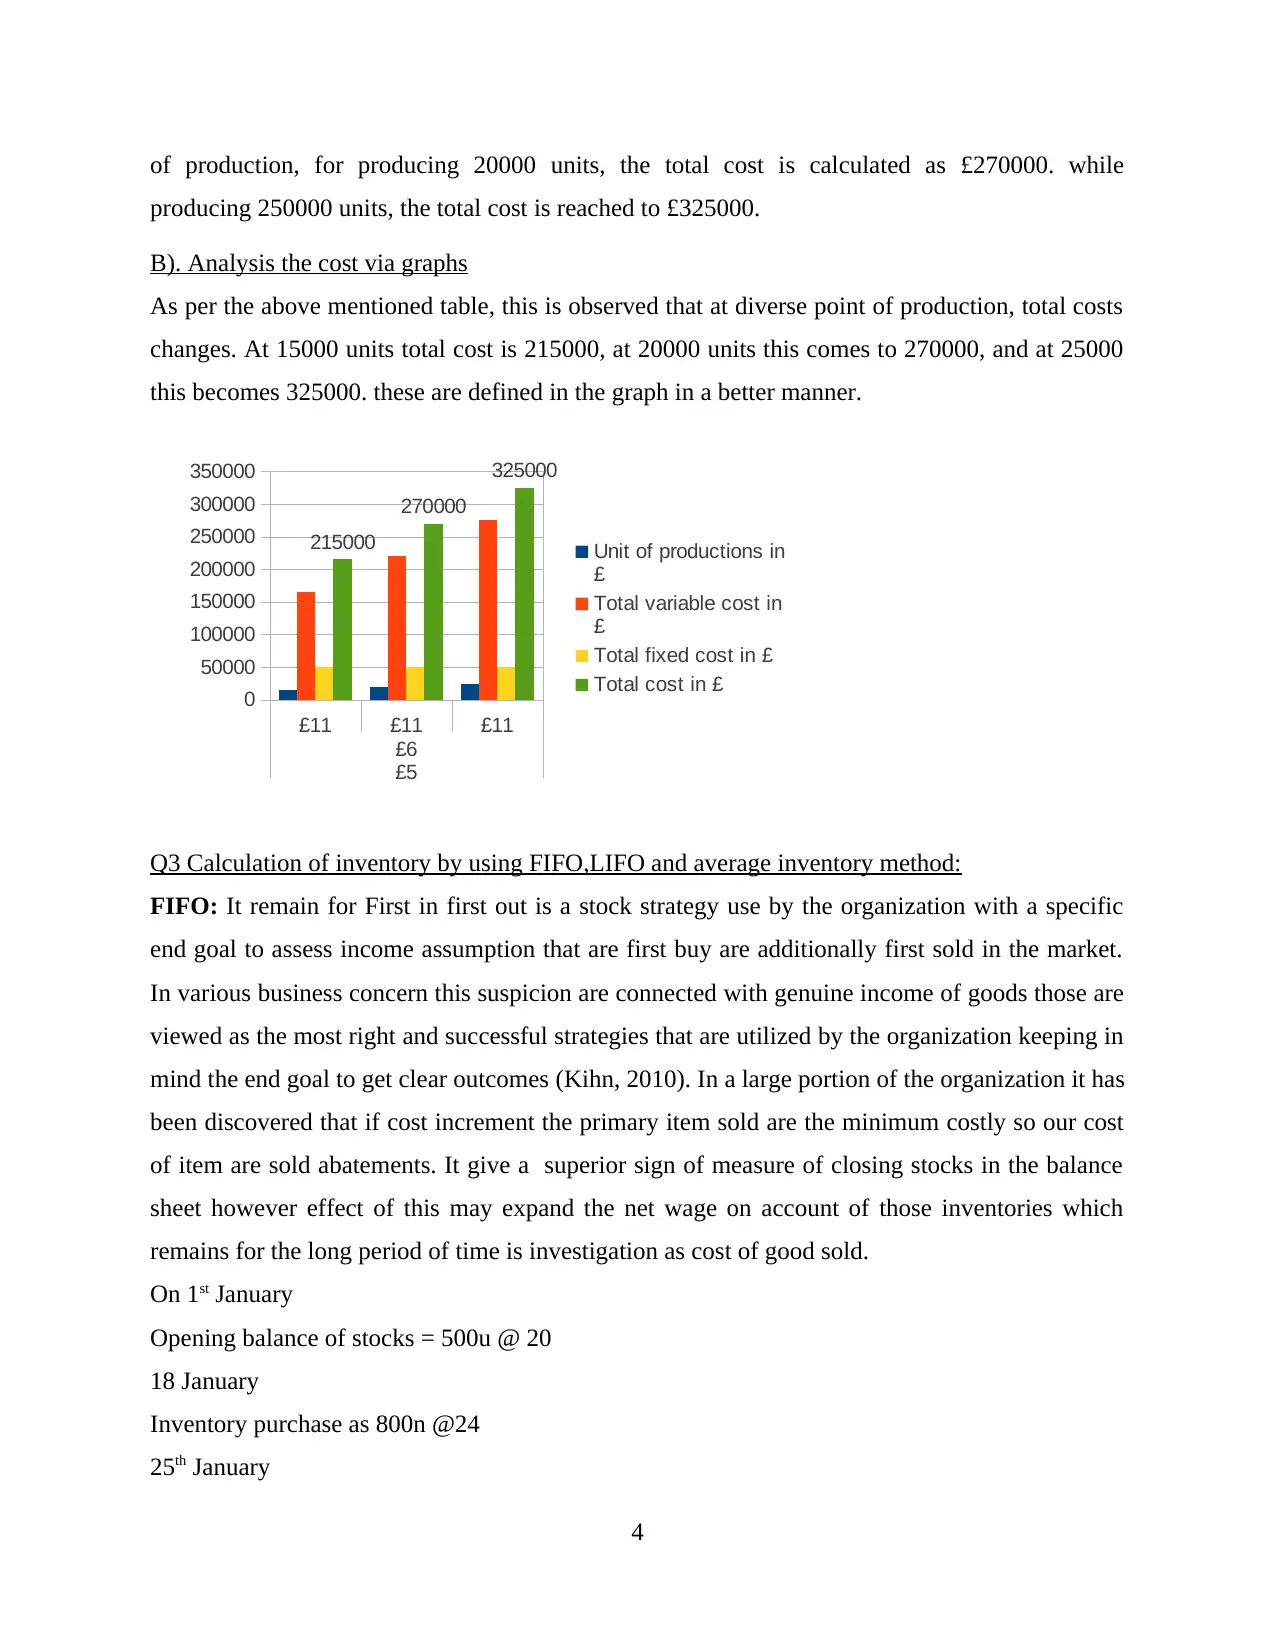
B). Analysis the cost via graphs
As per the above mentioned table, this is observed that at diverse point of production, total costs
changes. At 15000 units total cost is 215000, at 20000 units this comes to 270000, and at 25000
this becomes 325000. these are defined in the graph in a better manner.
£11 £11 £11
£6
£5
0
50000
100000
150000
200000
250000
300000
350000
215000
270000
325000
Unit of productions in
£
Total variable cost in
£
Total fixed cost in £
Total cost in £
Q3 Calculation of inventory by using FIFO,LIFO and average inventory method:
FIFO: It remain for First in first out is a stock strategy use by the organization with a specific
end goal to assess income assumption that are first buy are additionally first sold in the market.
In various business concern this suspicion are connected with genuine income of goods those are
viewed as the most right and successful strategies that are utilized by the organization keeping in
mind the end goal to get clear outcomes (Kihn, 2010). In a large portion of the organization it has
been discovered that if cost increment the primary item sold are the minimum costly so our cost
of item are sold abatements. It give a superior sign of measure of closing stocks in the balance
sheet however effect of this may expand the net wage on account of those inventories which
remains for the long period of time is investigation as cost of good sold.
On 1st January
Opening balance of stocks = 500u @ 20
18 January
Inventory purchase as 800n @24
25th January
4
producing 250000 units, the total cost is reached to £325000.
B). Analysis the cost via graphs
As per the above mentioned table, this is observed that at diverse point of production, total costs
changes. At 15000 units total cost is 215000, at 20000 units this comes to 270000, and at 25000
this becomes 325000. these are defined in the graph in a better manner.
£11 £11 £11
£6
£5
0
50000
100000
150000
200000
250000
300000
350000
215000
270000
325000
Unit of productions in
£
Total variable cost in
£
Total fixed cost in £
Total cost in £
Q3 Calculation of inventory by using FIFO,LIFO and average inventory method:
FIFO: It remain for First in first out is a stock strategy use by the organization with a specific
end goal to assess income assumption that are first buy are additionally first sold in the market.
In various business concern this suspicion are connected with genuine income of goods those are
viewed as the most right and successful strategies that are utilized by the organization keeping in
mind the end goal to get clear outcomes (Kihn, 2010). In a large portion of the organization it has
been discovered that if cost increment the primary item sold are the minimum costly so our cost
of item are sold abatements. It give a superior sign of measure of closing stocks in the balance
sheet however effect of this may expand the net wage on account of those inventories which
remains for the long period of time is investigation as cost of good sold.
On 1st January
Opening balance of stocks = 500u @ 20
18 January
Inventory purchase as 800n @24
25th January
4
Paraphrase This Document
Need a fresh take? Get an instant paraphrase of this document with our AI Paraphraser
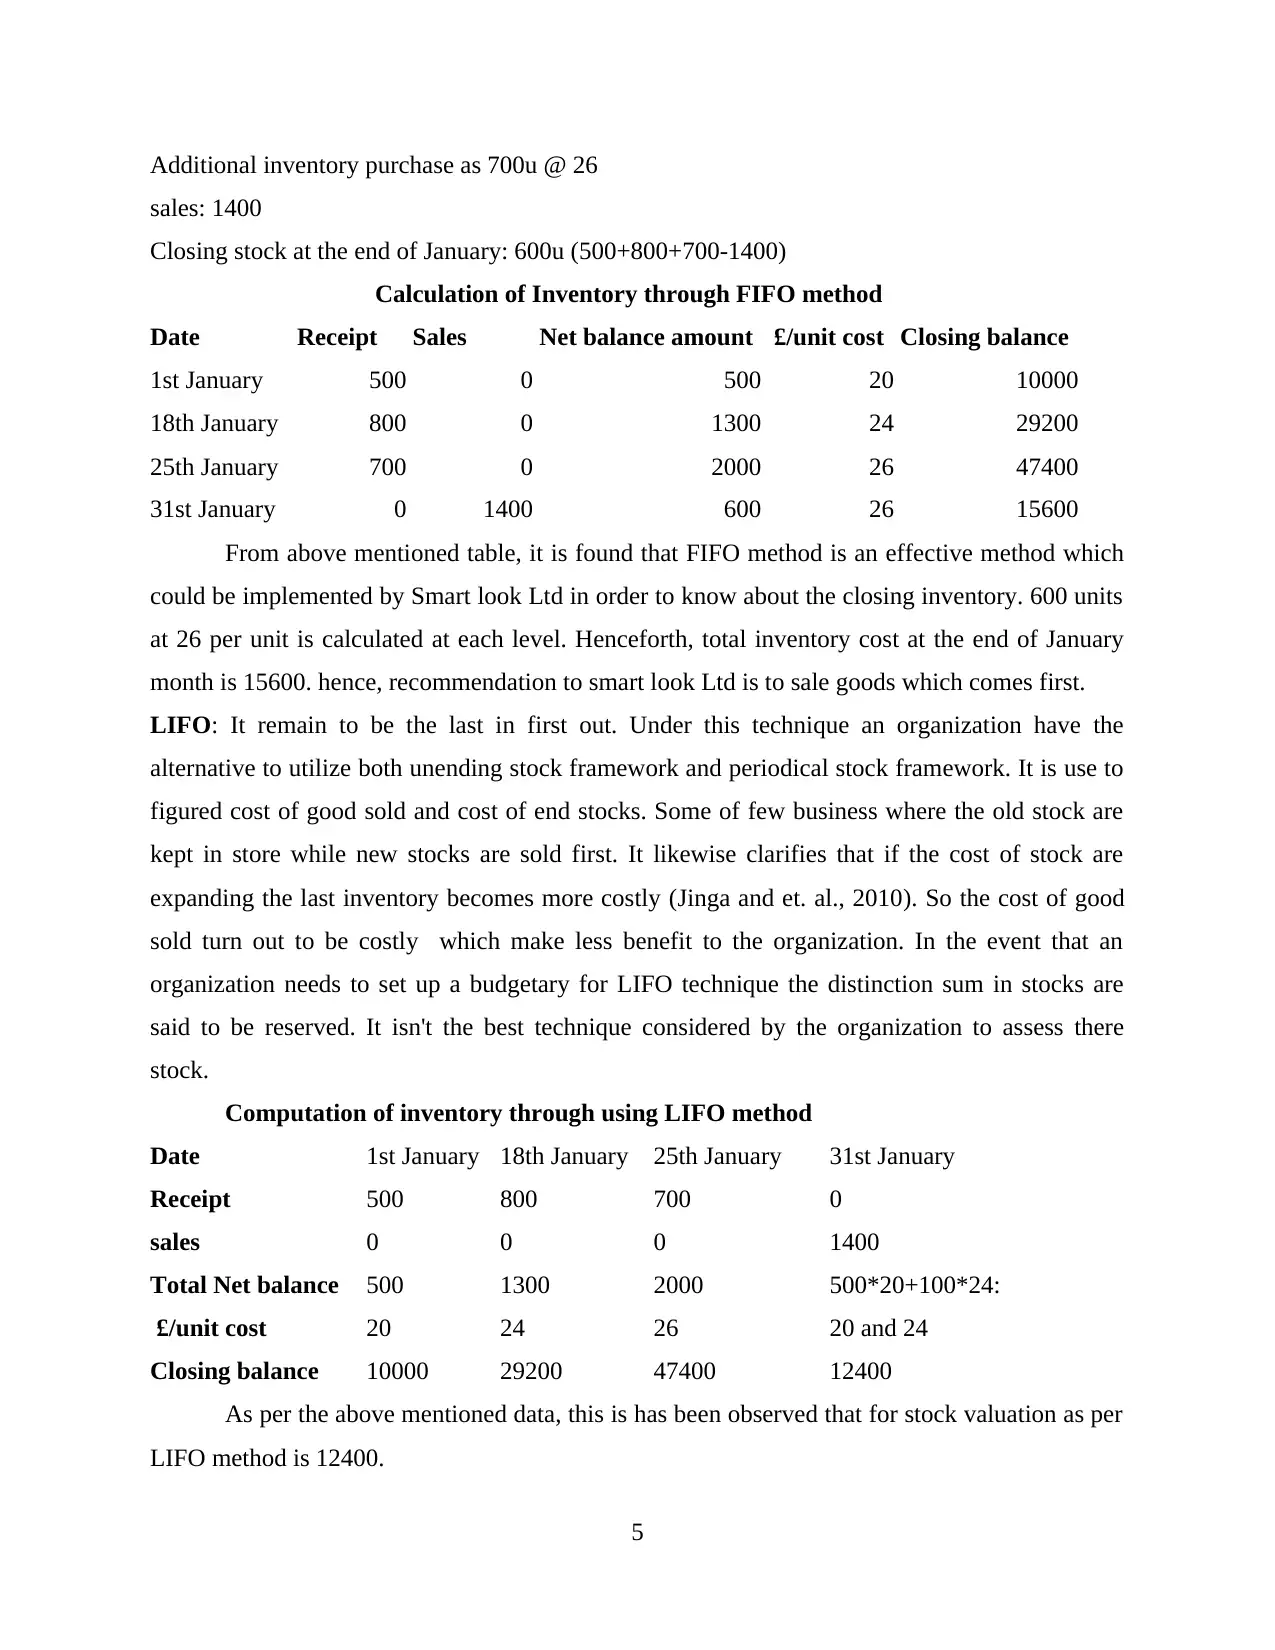
Additional inventory purchase as 700u @ 26
sales: 1400
Closing stock at the end of January: 600u (500+800+700-1400)
Calculation of Inventory through FIFO method
Date Receipt Sales Net balance amount £/unit cost Closing balance
1st January 500 0 500 20 10000
18th January 800 0 1300 24 29200
25th January 700 0 2000 26 47400
31st January 0 1400 600 26 15600
From above mentioned table, it is found that FIFO method is an effective method which
could be implemented by Smart look Ltd in order to know about the closing inventory. 600 units
at 26 per unit is calculated at each level. Henceforth, total inventory cost at the end of January
month is 15600. hence, recommendation to smart look Ltd is to sale goods which comes first.
LIFO: It remain to be the last in first out. Under this technique an organization have the
alternative to utilize both unending stock framework and periodical stock framework. It is use to
figured cost of good sold and cost of end stocks. Some of few business where the old stock are
kept in store while new stocks are sold first. It likewise clarifies that if the cost of stock are
expanding the last inventory becomes more costly (Jinga and et. al., 2010). So the cost of good
sold turn out to be costly which make less benefit to the organization. In the event that an
organization needs to set up a budgetary for LIFO technique the distinction sum in stocks are
said to be reserved. It isn't the best technique considered by the organization to assess there
stock.
Computation of inventory through using LIFO method
Date 1st January 18th January 25th January 31st January
Receipt 500 800 700 0
sales 0 0 0 1400
Total Net balance 500 1300 2000 500*20+100*24:
£/unit cost 20 24 26 20 and 24
Closing balance 10000 29200 47400 12400
As per the above mentioned data, this is has been observed that for stock valuation as per
LIFO method is 12400.
5
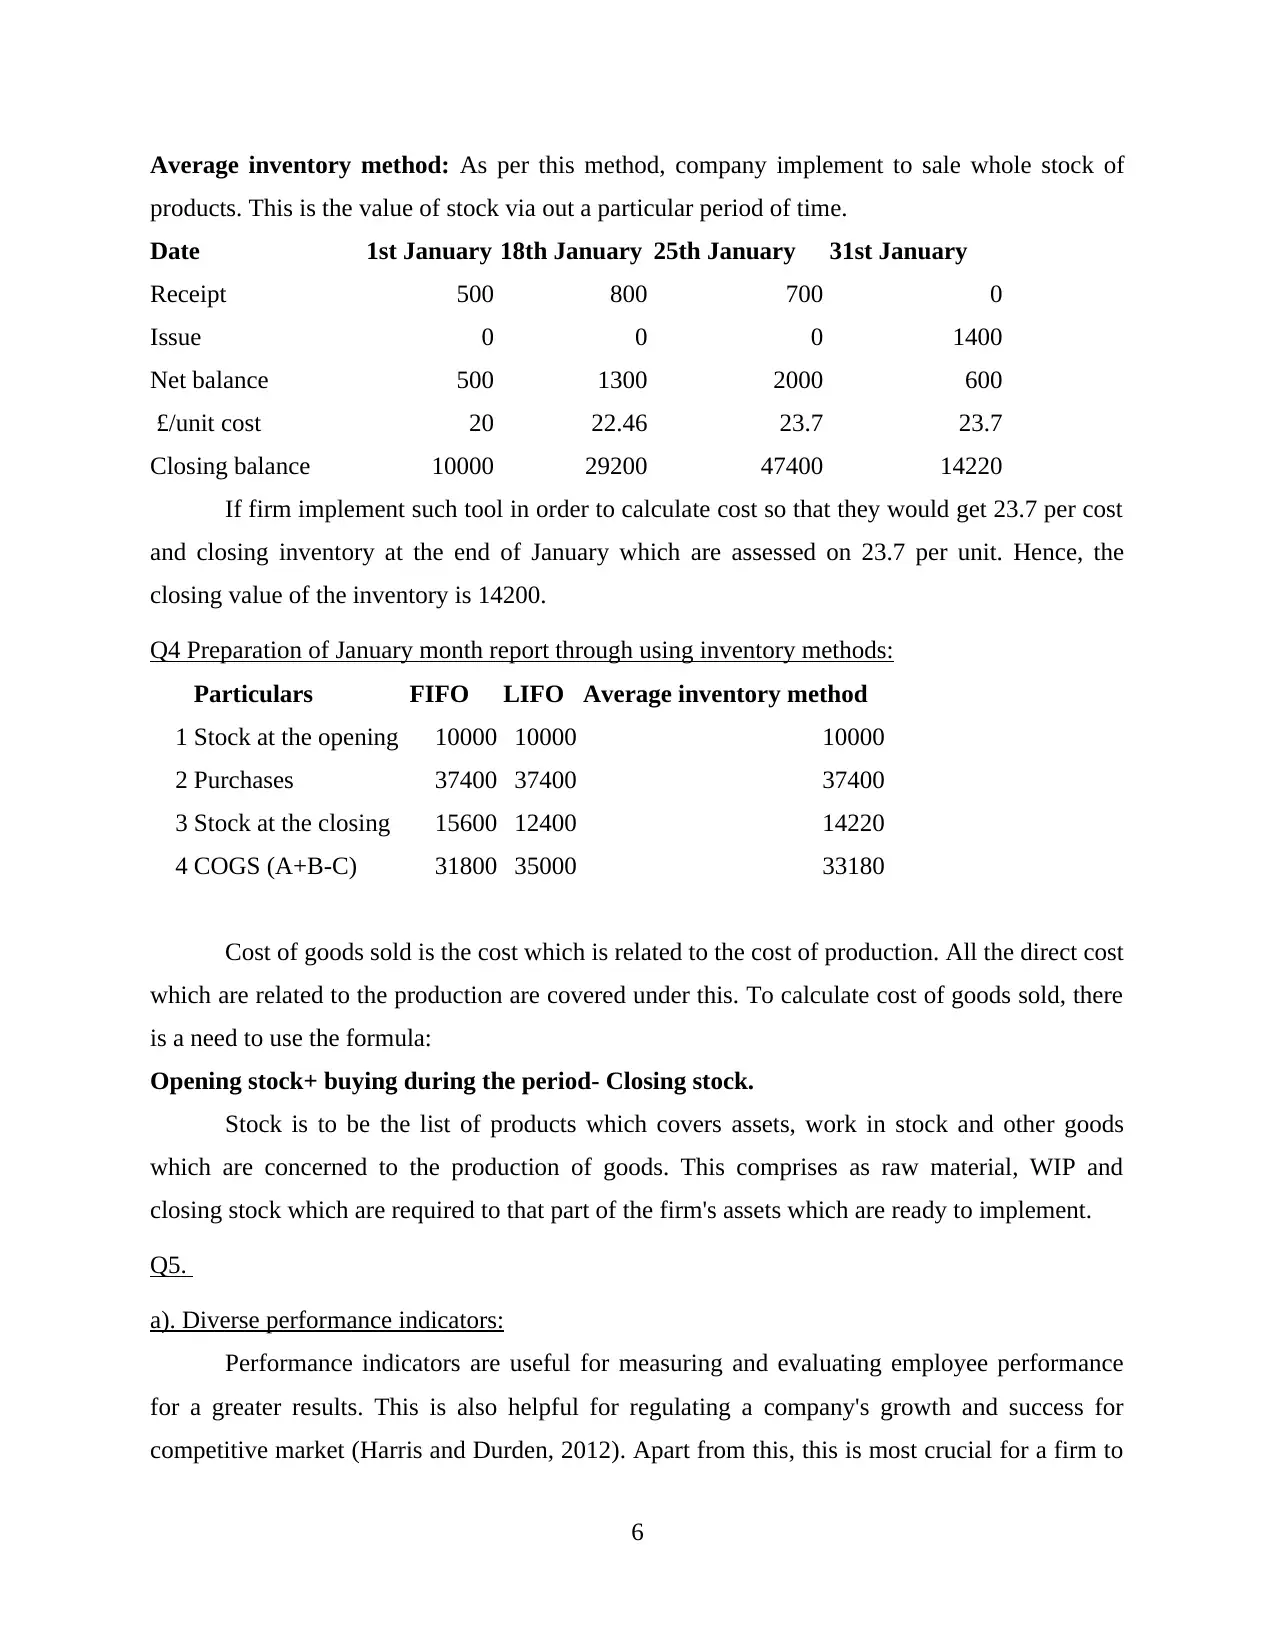
Average inventory method: As per this method, company implement to sale whole stock of
products. This is the value of stock via out a particular period of time.
Date 1st January 18th January 25th January 31st January
Receipt 500 800 700 0
Issue 0 0 0 1400
Net balance 500 1300 2000 600
£/unit cost 20 22.46 23.7 23.7
Closing balance 10000 29200 47400 14220
If firm implement such tool in order to calculate cost so that they would get 23.7 per cost
and closing inventory at the end of January which are assessed on 23.7 per unit. Hence, the
closing value of the inventory is 14200.
Q4 Preparation of January month report through using inventory methods:
Particulars FIFO LIFO Average inventory method
1 Stock at the opening 10000 10000 10000
2 Purchases 37400 37400 37400
3 Stock at the closing 15600 12400 14220
4 COGS (A+B-C) 31800 35000 33180
Cost of goods sold is the cost which is related to the cost of production. All the direct cost
which are related to the production are covered under this. To calculate cost of goods sold, there
is a need to use the formula:
Opening stock+ buying during the period- Closing stock.
Stock is to be the list of products which covers assets, work in stock and other goods
which are concerned to the production of goods. This comprises as raw material, WIP and
closing stock which are required to that part of the firm's assets which are ready to implement.
Q5.
a). Diverse performance indicators:
Performance indicators are useful for measuring and evaluating employee performance
for a greater results. This is also helpful for regulating a company's growth and success for
competitive market (Harris and Durden, 2012). Apart from this, this is most crucial for a firm to
6
⊘ This is a preview!⊘
Do you want full access?
Subscribe today to unlock all pages.
Trusted by 1+ million students worldwide

determine the key components that are covered in its performance. This covers requirement of
productivity measurement and such kind of techniques are implemented under this. There are
followings tools which are accountable for analysing performance of employees under a firm.
These are mentioned hereunder:
Customer experiences:- customers are the major tool who supports the firm for
identifying its success. A firm is likewise assess its performance level by taking
feedbacks from customers feedbacks. This assists managers to address whether they are
meeting market demands and trends.
Supplier and product quality:- If a firm supplies value added goods to its buyers and if
such buyers would satisfy their needs then the company would able to make certain
assumptions effectively (Faÿ, Introna and Puyou, 2010).
Soundness of operations:- This is an ethical accountability of the higher authorities which
aims to enhance its operations in an effective manner. Such would assist the firm to
expand the area of production materials or products.
Reducing maintenance budgeting:- there are so many avoidable expenses which occurs
during production. Which gives adverse impacts on the firm performance. There is a need
to make plan by which such kinds of costs eliminates in an effective manner (Zainun
Tuanmat and Smith, 2011).
b).
1. To reduce costs:
Cost is the main tool for making the product. However, management of the Smart Look
Ltd eliminate wastage costs which helps the firm in order to make optimise the profits.
Regarding such process, management implement various diverse process which ultimately used
for maximising the profits and minimising the costs of the cost of production. Although, this can
be said that the company is always implementing diverse tools that could totally helpful for
reducing the costs of production while making product (Bodie, Kane and Marcus, 2014). These
tools are used by the firm in order to reduce costs which are usually connected with the
manufacturing process covers the following:
1. Enhanced strategies and processes: Taking a fresh, strategic approach to processes is the
first steps for determining various ways to reduce costs throughout the production process. This
permits an advance manner for evaluating staff, resources and various processes.
7
Paraphrase This Document
Need a fresh take? Get an instant paraphrase of this document with our AI Paraphraser
2. Enhanced Customer understanding and services: The quality system assist the
management to limit the costs with the help of rendering a great understanding of customer
needs.
2. To enhance value:
Within a firm, this has been observed that the owners of the firm are facing diverse
problems for providing great quality of product to its customers. However, few of them could
achieve success for getting set of targets. As, they are the risk taker. For enhancing value of the
firm, management is requires to follow its pre-set objectives and frame a plan. Few of them are
as follows:
Find out mistakes: the senior manager are accountable to analysis the performance in order to
know whether it is going in the right ways for gaining their pre-set targets.
Development of training: Management needs to give more attention in terms of money and time
in order to make training program more effective and efficient.
TASK 2
Q6
a). Budget:
This is the estimation of whole income which a firm is generate and expenditure are done
at the given period of time (Callahan, Stetz and Brooks, 2011). The main objective of budget is
to incorporate an entire framework for making efficient implementation of funds. There are
various types of budgets which can be used by the firm for making efficient operations.
Zero base budgeting: this is the method under which a firm manage their expenses. This
always starts with the base. That is the reason, this is called zero base budgeting.
Flexible budget: This is the budget which changes according to the activities. This is
totally different from the static budget as these remains constant .
B). Objectives of budget formulation:
This is observed that divers firms uses budgets in an effective manner that are to be
evaluated with the actual outcome and then the firm compare them so that the if any deviation
occurs, will eliminates effectively. Budget assist the firm for making effective strategies as per
the budgeted plan.
8
c). Process of budget preparation:
Budget preparation is the main tool which are used by the firm for estimating inflows and
outflows for a given period of time. There are diverse methods which are used for preparation of
budgets:
Zero-based Budgeting: This is the performance of budgeting under which whole
distribution for each advance time (Baldvinsdottir, Mitchell and Nørreklit, 2010). This
emerge from zero base and whole role is analysed.
Fixed budget: This is the budget which remains constant and does not change with the
change in the other factors. Usually, this kind of budget is avoided by many firms as this
is fixed and does not change.
Variable budget: This is the budget which change as per the change in the production.
This is the most effective budget and change as per the change in the cost (Bennett,
Schaltegger and Zvezdov, 2011).
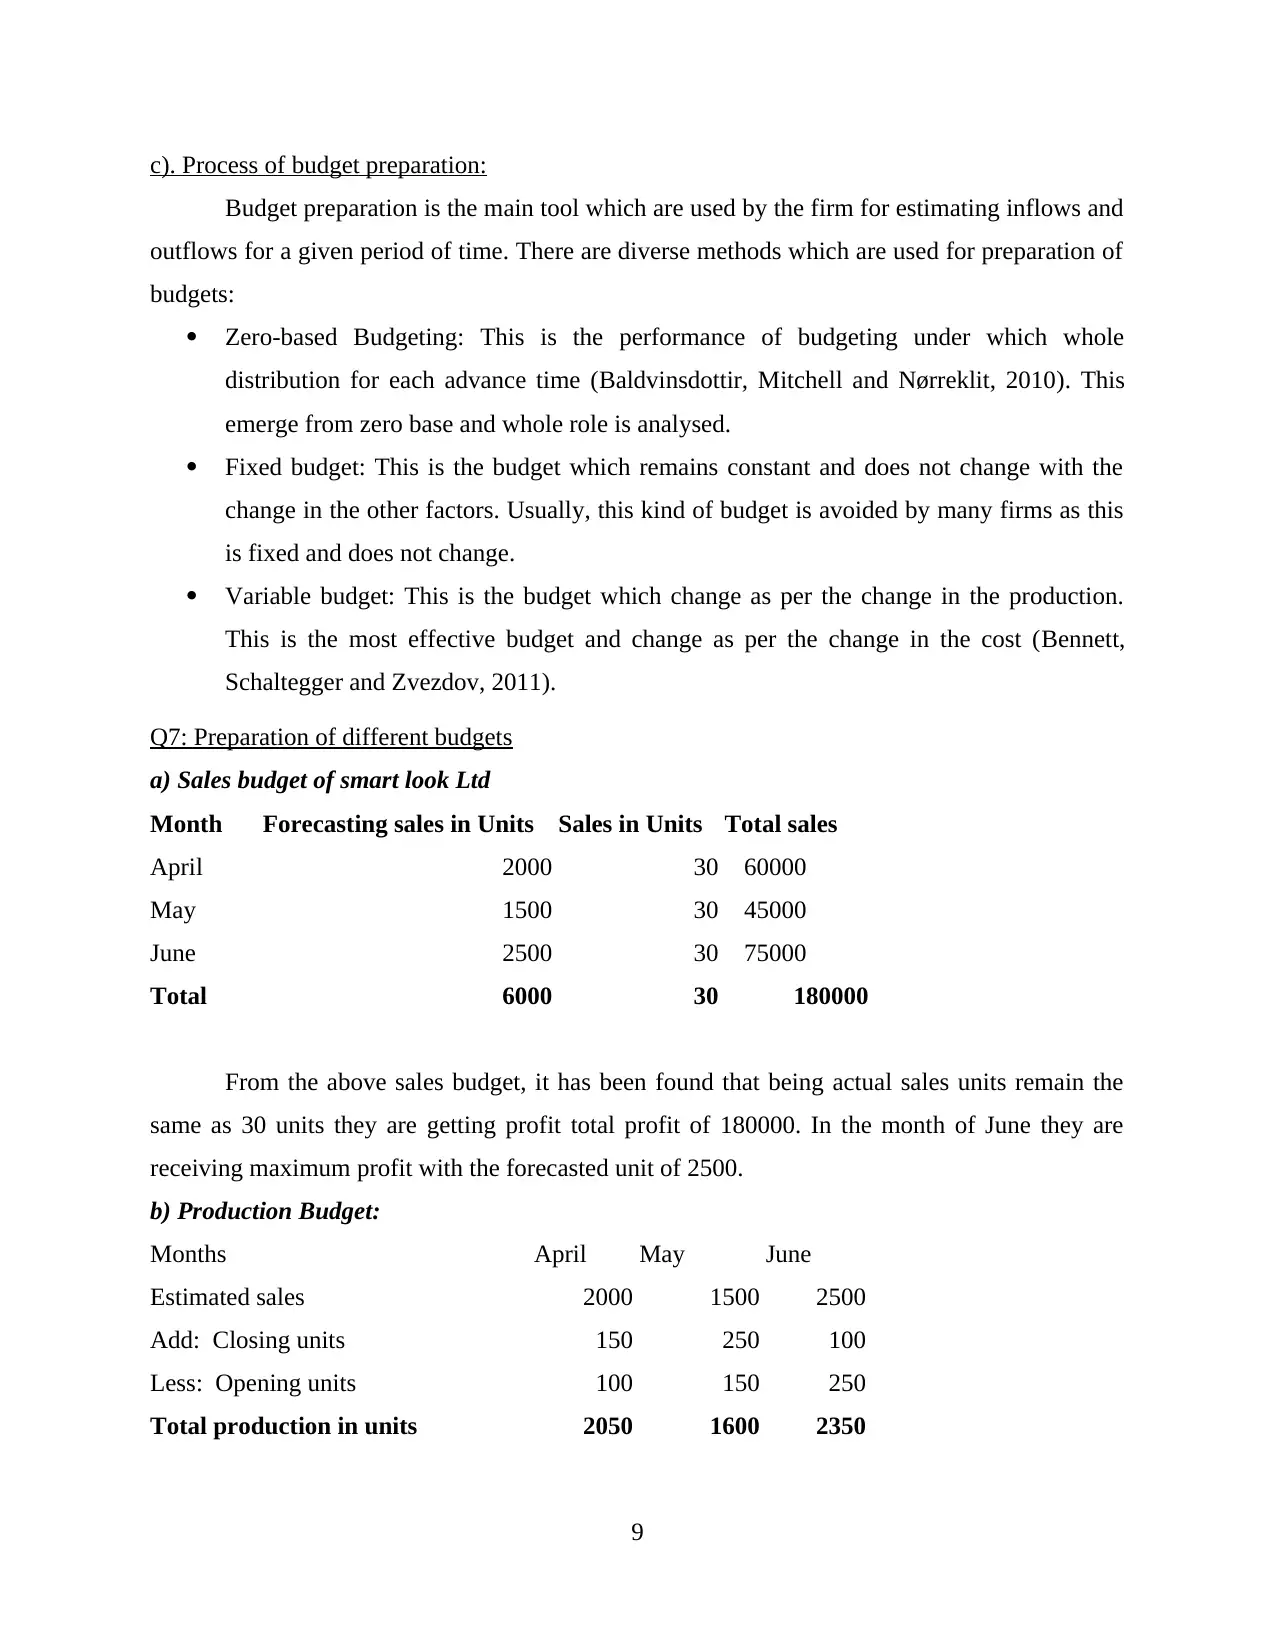
Q7: Preparation of different budgets
a) Sales budget of smart look Ltd
Month Forecasting sales in Units Sales in Units Total sales
April 2000 30 £60000
May 1500 30 £45000
June 2500 30 £75000
Total 6000 30 180000
From the above sales budget, it has been found that being actual sales units remain the
same as 30 units they are getting profit total profit of 180000. In the month of June they are
receiving maximum profit with the forecasted unit of 2500.
b) Production Budget:
Months April May June
Estimated sales 2000 1500 2500
Add: Closing units 150 250 100
Less: Opening units 100 150 250
Total production in units 2050 1600 2350
9
Budget preparation is the main tool which are used by the firm for estimating inflows and
outflows for a given period of time. There are diverse methods which are used for preparation of
budgets:
Zero-based Budgeting: This is the performance of budgeting under which whole
distribution for each advance time (Baldvinsdottir, Mitchell and Nørreklit, 2010). This
emerge from zero base and whole role is analysed.
Fixed budget: This is the budget which remains constant and does not change with the
change in the other factors. Usually, this kind of budget is avoided by many firms as this
is fixed and does not change.
Variable budget: This is the budget which change as per the change in the production.
This is the most effective budget and change as per the change in the cost (Bennett,
Schaltegger and Zvezdov, 2011).
Q7: Preparation of different budgets
a) Sales budget of smart look Ltd
Month Forecasting sales in Units Sales in Units Total sales
April 2000 30 £60000
May 1500 30 £45000
June 2500 30 £75000
Total 6000 30 180000
From the above sales budget, it has been found that being actual sales units remain the
same as 30 units they are getting profit total profit of 180000. In the month of June they are
receiving maximum profit with the forecasted unit of 2500.
b) Production Budget:
Months April May June
Estimated sales 2000 1500 2500
Add: Closing units 150 250 100
Less: Opening units 100 150 250
Total production in units 2050 1600 2350
9
⊘ This is a preview!⊘
Do you want full access?
Subscribe today to unlock all pages.
Trusted by 1+ million students worldwide
1 out of 17
Related Documents


Your All-in-One AI-Powered Toolkit for Academic Success.
+13062052269
info@desklib.com
Available 24*7 on WhatsApp / Email
![[object Object]](/_next/static/media/star-bottom.7253800d.svg)
Unlock your academic potential
Copyright © 2020–2026 A2Z Services. All Rights Reserved. Developed and managed by ZUCOL.