Management Accounting: Costing and Budgeting
VerifiedAdded on 2020/02/19
|18
|4938
|121
Report
AI Summary
This report delves into management accounting, specifically focusing on costing and budgeting. It covers various aspects such as cost identification, classification, and performance measures for a clothing company named Smart Looks. The report includes detailed analyses of production costs, inventory methods, and budget preparation, providing insights into effective financial management and operational efficiency.
Management Accounting
Costing and Budgeting
Costing and Budgeting
Paraphrase This Document
Need a fresh take? Get an instant paraphrase of this document with our AI Paraphraser
Task 1
Question 1
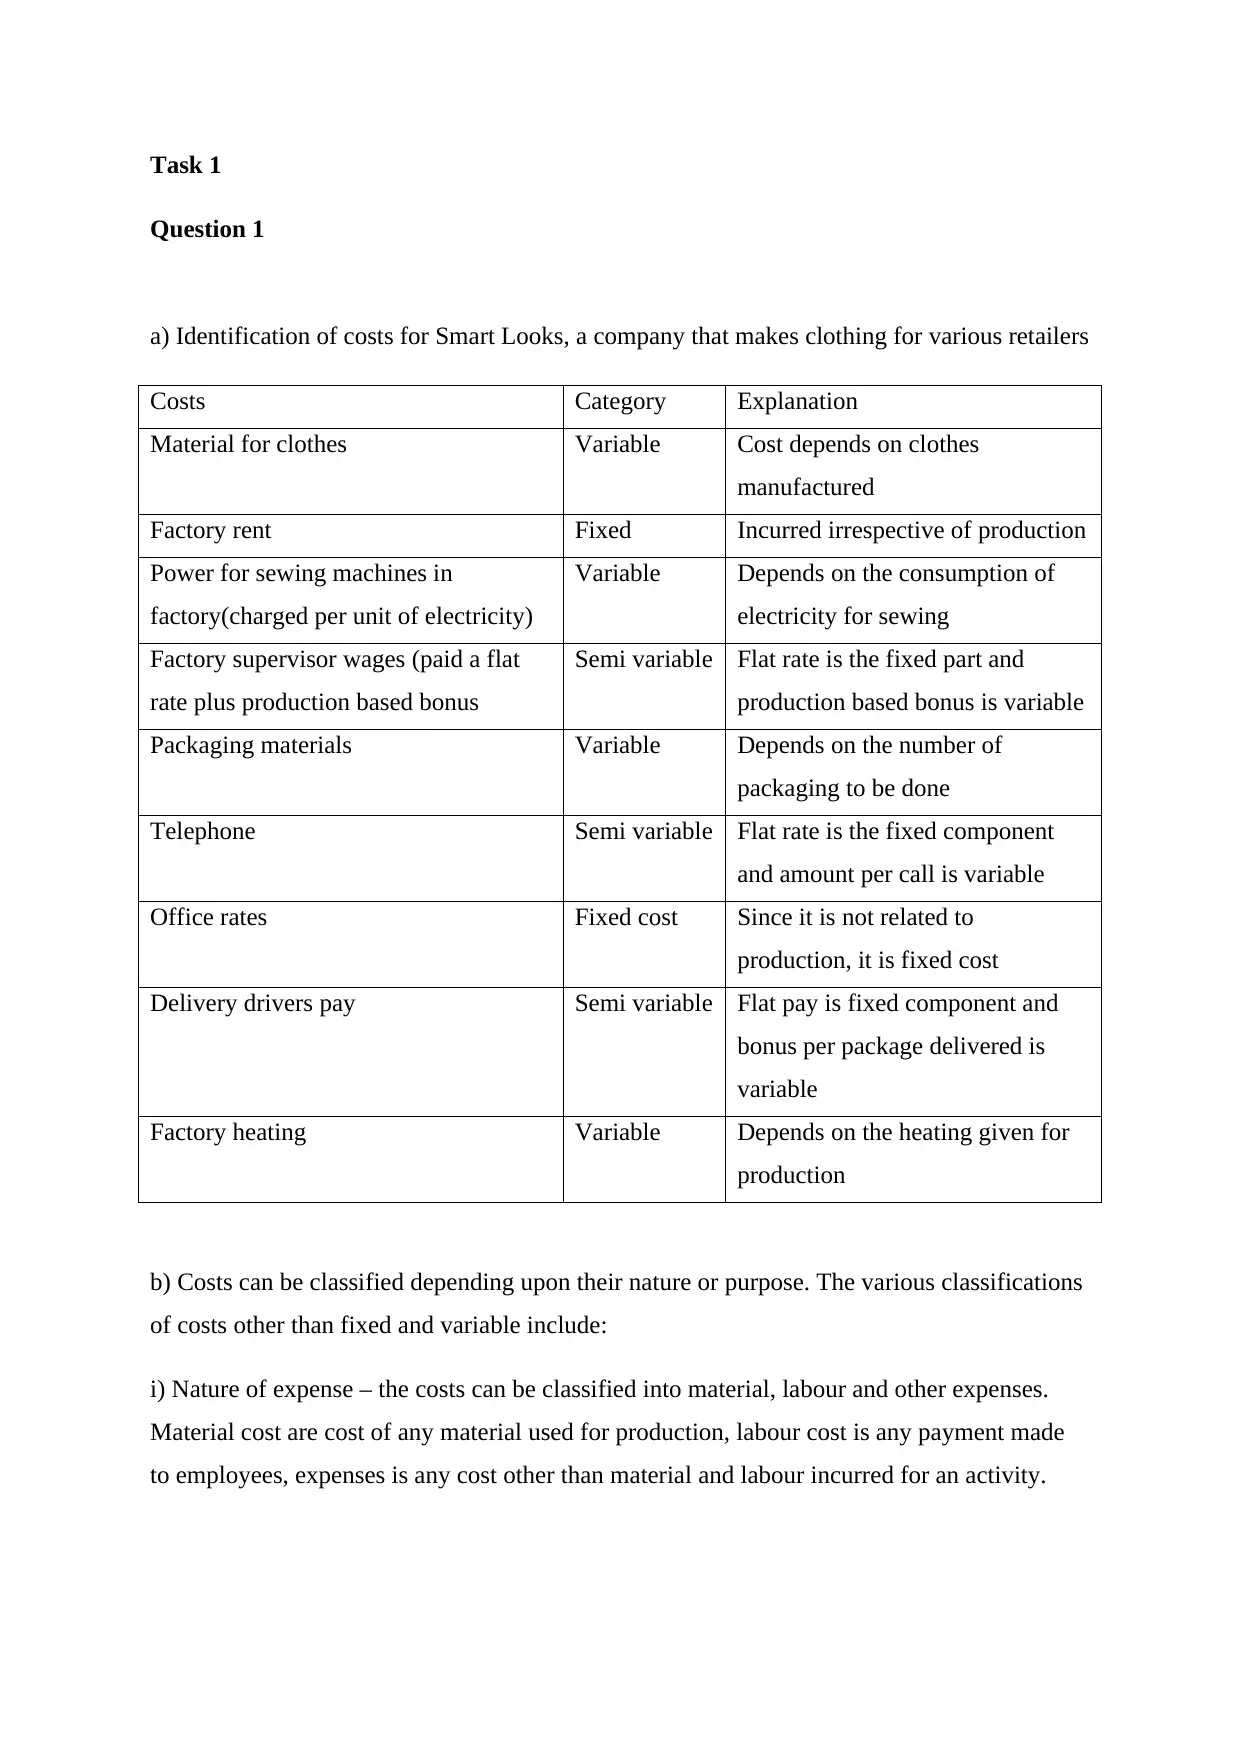
a) Identification of costs for Smart Looks, a company that makes clothing for various retailers
Costs Category Explanation
Material for clothes Variable Cost depends on clothes
manufactured
Factory rent Fixed Incurred irrespective of production
Power for sewing machines in
factory(charged per unit of electricity)
Variable Depends on the consumption of
electricity for sewing
Factory supervisor wages (paid a flat
rate plus production based bonus
Semi variable Flat rate is the fixed part and
production based bonus is variable
Packaging materials Variable Depends on the number of
packaging to be done
Telephone Semi variable Flat rate is the fixed component
and amount per call is variable
Office rates Fixed cost Since it is not related to
production, it is fixed cost
Delivery drivers pay Semi variable Flat pay is fixed component and
bonus per package delivered is
variable
Factory heating Variable Depends on the heating given for
production
b) Costs can be classified depending upon their nature or purpose. The various classifications
of costs other than fixed and variable include:
i) Nature of expense – the costs can be classified into material, labour and other expenses.
Material cost are cost of any material used for production, labour cost is any payment made
to employees, expenses is any cost other than material and labour incurred for an activity.
Question 1
a) Identification of costs for Smart Looks, a company that makes clothing for various retailers
Costs Category Explanation
Material for clothes Variable Cost depends on clothes
manufactured
Factory rent Fixed Incurred irrespective of production
Power for sewing machines in
factory(charged per unit of electricity)
Variable Depends on the consumption of
electricity for sewing
Factory supervisor wages (paid a flat
rate plus production based bonus
Semi variable Flat rate is the fixed part and
production based bonus is variable
Packaging materials Variable Depends on the number of
packaging to be done
Telephone Semi variable Flat rate is the fixed component
and amount per call is variable
Office rates Fixed cost Since it is not related to
production, it is fixed cost
Delivery drivers pay Semi variable Flat pay is fixed component and
bonus per package delivered is
variable
Factory heating Variable Depends on the heating given for
production
b) Costs can be classified depending upon their nature or purpose. The various classifications
of costs other than fixed and variable include:
i) Nature of expense – the costs can be classified into material, labour and other expenses.
Material cost are cost of any material used for production, labour cost is any payment made
to employees, expenses is any cost other than material and labour incurred for an activity.
ii) By relation to cost centre – the costs are classified into direct or indirect. Direct costs can
be directly allocated to a cost centre whereas indirect cost cannot be allocated to a cost centre
or cost object.
iii) By function – the costs can be classified on the basis of function which includes
production, administration, selling, distribution, and research and development.
iv) By management decision making – the costs are classified differently under different
circumstances and for the purpose of management decision making. The various costs
include marginal cost, opportunity cost, sunk cost, differential cost, replacement cost,
avoidable cost, unavoidable cost, normal cost and abnormal cost (M. Oberholzer, 2004)
v) By nature of production process – the costs are classified on the basis of nature of
production process and can be categorized into batch cost, process cost, conversion cost, joint
cost, contract cost.
vi) By time – the costs can be classified depending on specific time period to which it relates
like historical cost, standard cost, estimated cost and pre-determined cost (Kumar)
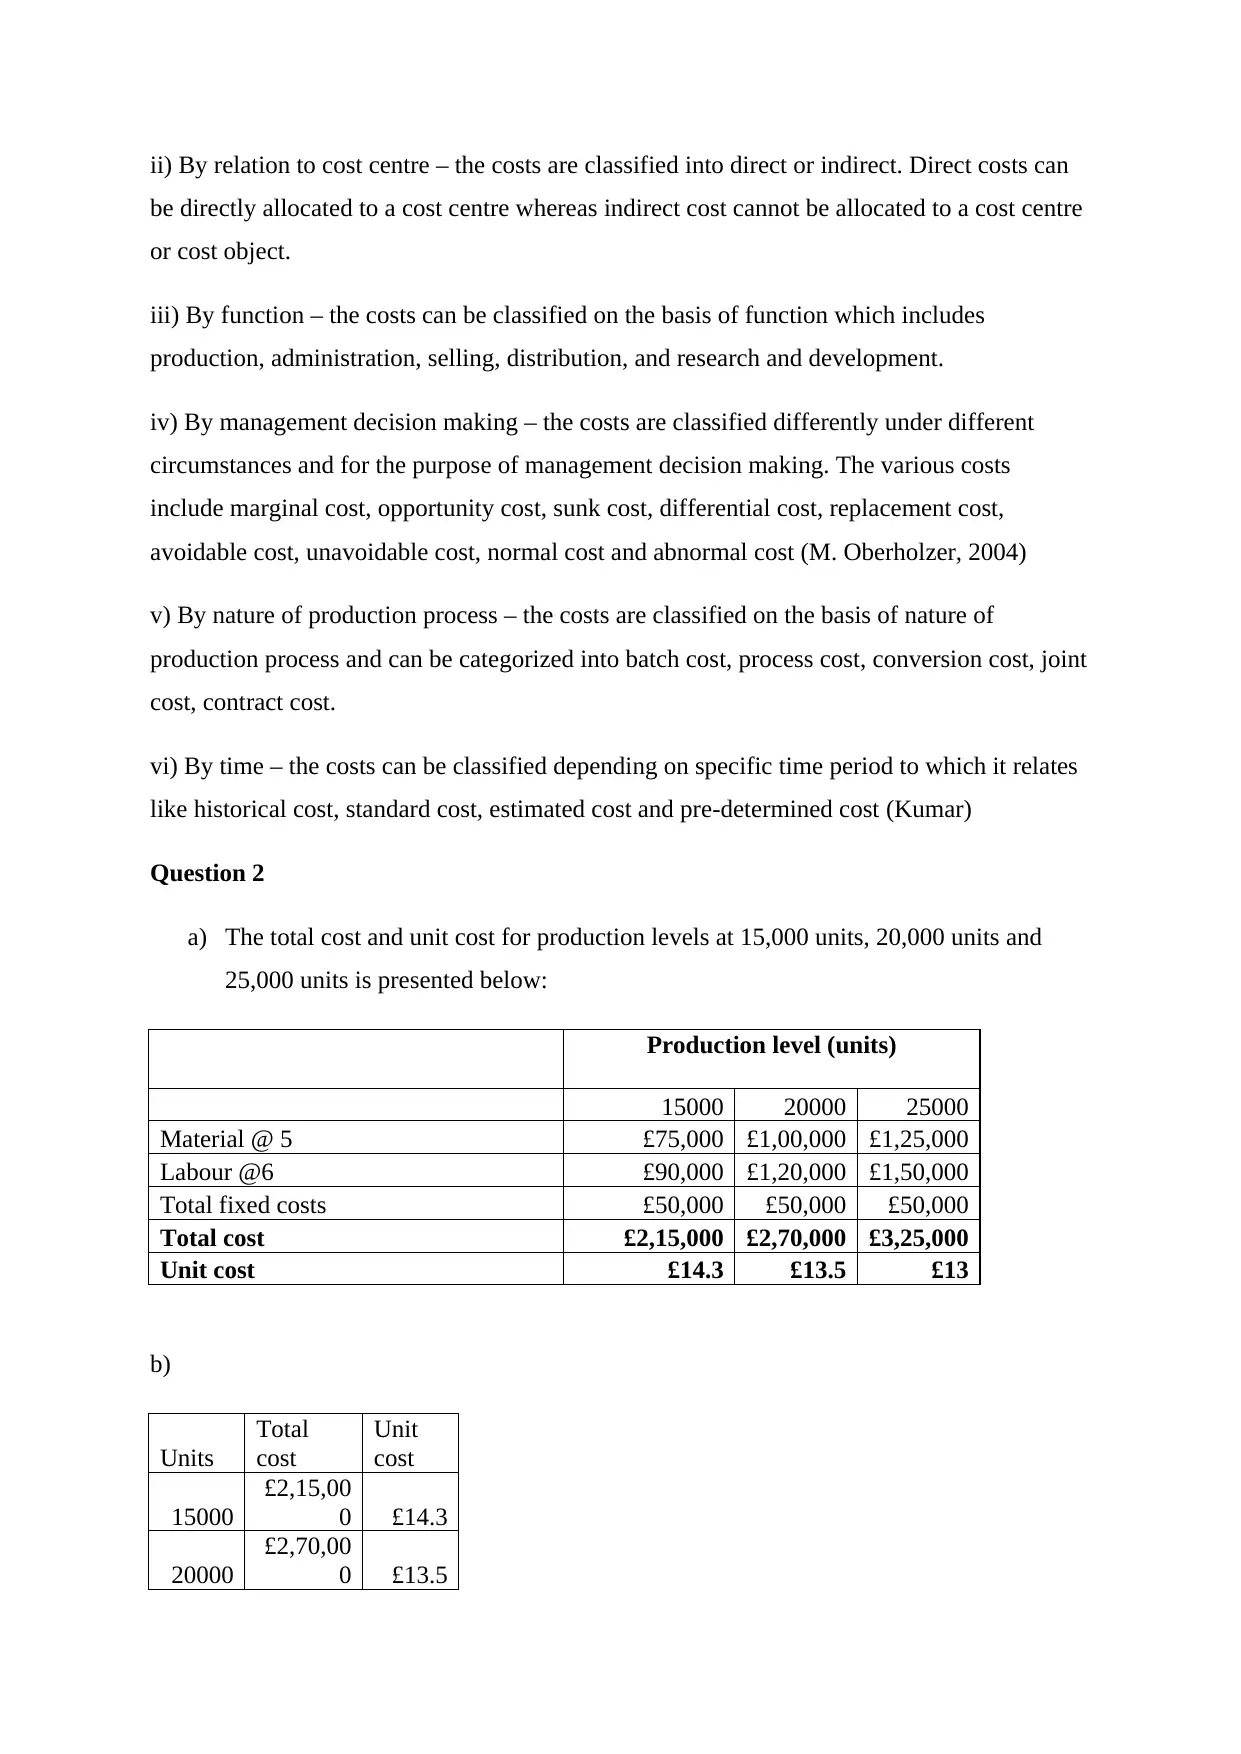
Question 2
a) The total cost and unit cost for production levels at 15,000 units, 20,000 units and
25,000 units is presented below:
Production level (units)
15000 20000 25000
Material @ 5 £75,000 £1,00,000 £1,25,000
Labour @6 £90,000 £1,20,000 £1,50,000
Total fixed costs £50,000 £50,000 £50,000
Total cost £2,15,000 £2,70,000 £3,25,000
Unit cost £14.3 £13.5 £13
b)
Units
Total
cost
Unit
cost
15000
£2,15,00
0 £14.3
20000
£2,70,00
0 £13.5
be directly allocated to a cost centre whereas indirect cost cannot be allocated to a cost centre
or cost object.
iii) By function – the costs can be classified on the basis of function which includes
production, administration, selling, distribution, and research and development.
iv) By management decision making – the costs are classified differently under different
circumstances and for the purpose of management decision making. The various costs
include marginal cost, opportunity cost, sunk cost, differential cost, replacement cost,
avoidable cost, unavoidable cost, normal cost and abnormal cost (M. Oberholzer, 2004)
v) By nature of production process – the costs are classified on the basis of nature of
production process and can be categorized into batch cost, process cost, conversion cost, joint
cost, contract cost.
vi) By time – the costs can be classified depending on specific time period to which it relates
like historical cost, standard cost, estimated cost and pre-determined cost (Kumar)
Question 2
a) The total cost and unit cost for production levels at 15,000 units, 20,000 units and
25,000 units is presented below:
Production level (units)
15000 20000 25000
Material @ 5 £75,000 £1,00,000 £1,25,000
Labour @6 £90,000 £1,20,000 £1,50,000
Total fixed costs £50,000 £50,000 £50,000
Total cost £2,15,000 £2,70,000 £3,25,000
Unit cost £14.3 £13.5 £13
b)
Units
Total
cost
Unit
cost
15000
£2,15,00
0 £14.3
20000
£2,70,00
0 £13.5
⊘ This is a preview!⊘
Do you want full access?
Subscribe today to unlock all pages.
Trusted by 1+ million students worldwide
25000
£3,25,00
0 £13.0
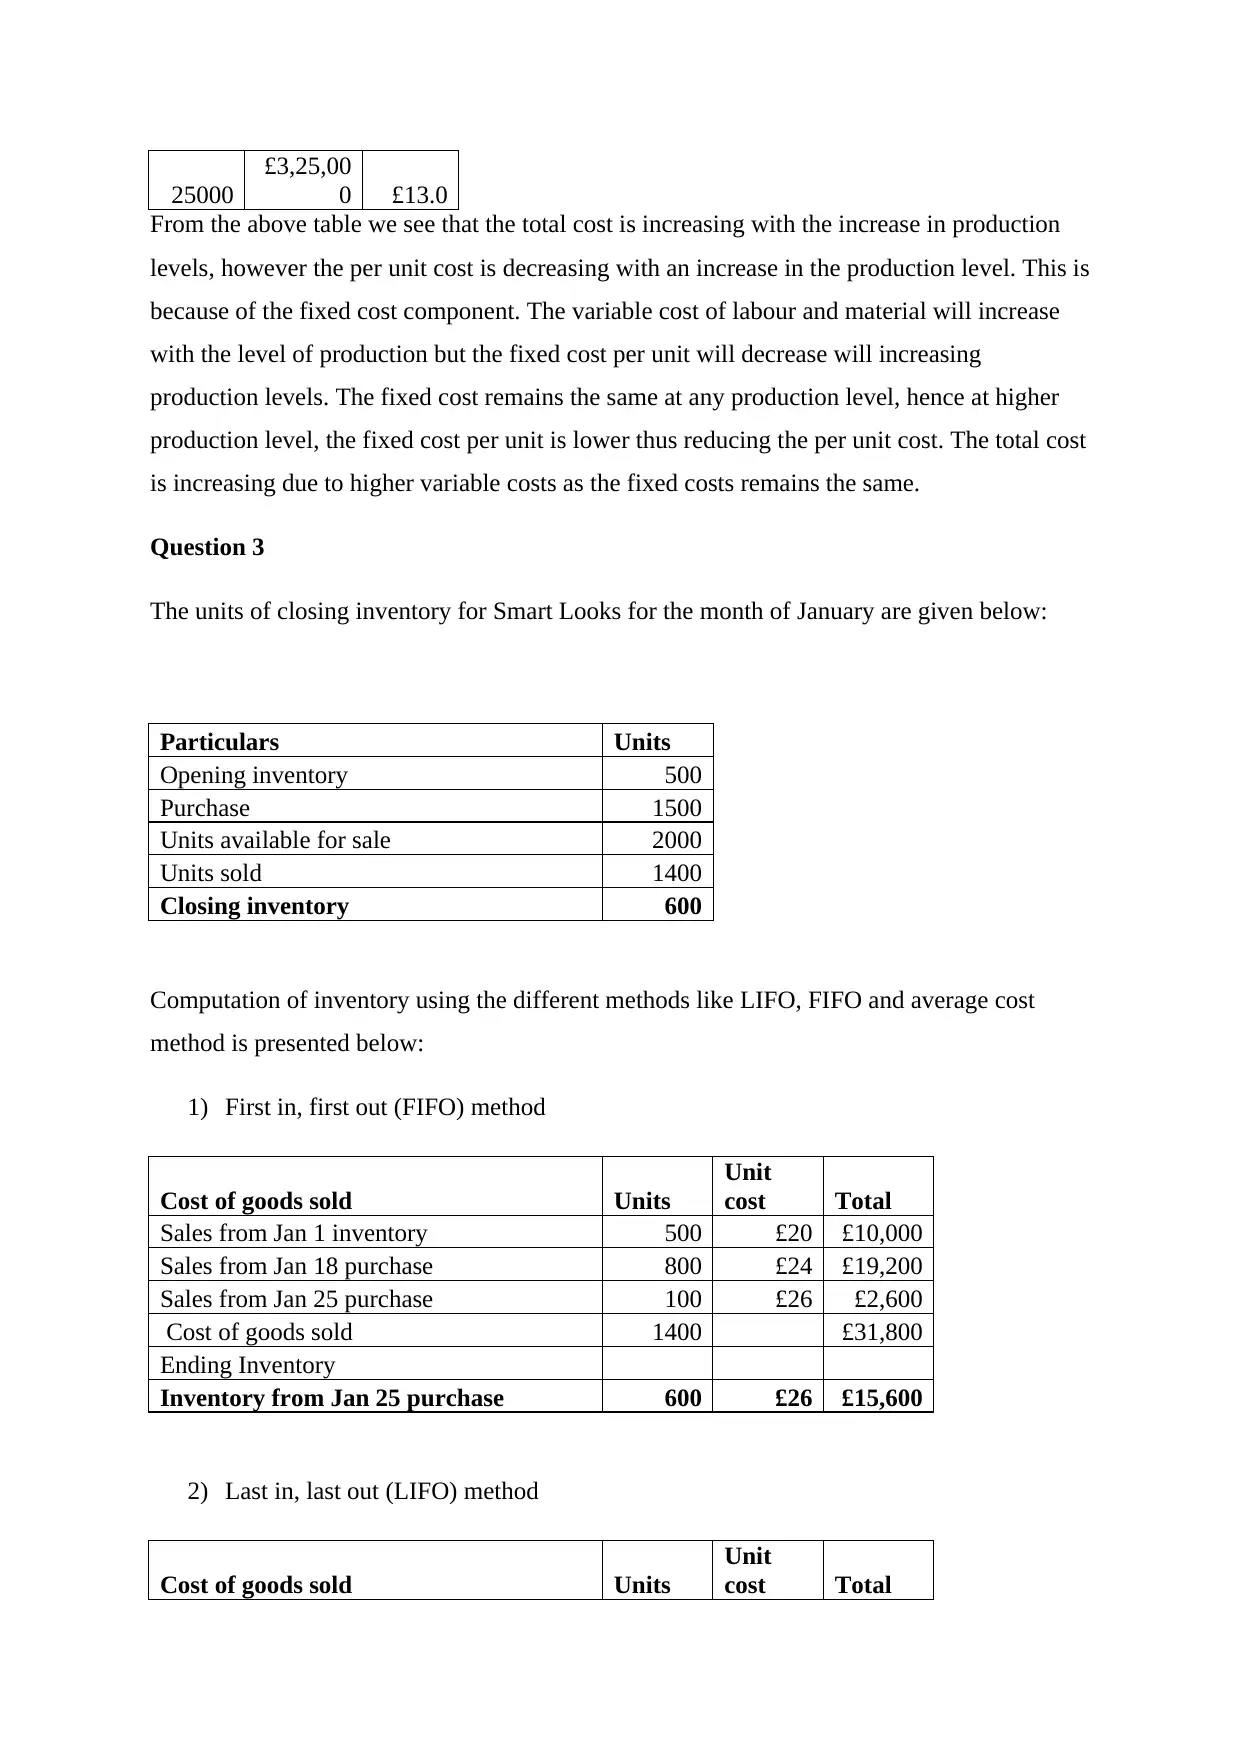
From the above table we see that the total cost is increasing with the increase in production
levels, however the per unit cost is decreasing with an increase in the production level. This is
because of the fixed cost component. The variable cost of labour and material will increase
with the level of production but the fixed cost per unit will decrease will increasing
production levels. The fixed cost remains the same at any production level, hence at higher
production level, the fixed cost per unit is lower thus reducing the per unit cost. The total cost
is increasing due to higher variable costs as the fixed costs remains the same.
Question 3
The units of closing inventory for Smart Looks for the month of January are given below:
Particulars Units
Opening inventory 500
Purchase 1500
Units available for sale 2000
Units sold 1400
Closing inventory 600
Computation of inventory using the different methods like LIFO, FIFO and average cost
method is presented below:
1) First in, first out (FIFO) method
Cost of goods sold Units
Unit
cost Total
Sales from Jan 1 inventory 500 £20 £10,000
Sales from Jan 18 purchase 800 £24 £19,200
Sales from Jan 25 purchase 100 £26 £2,600
Cost of goods sold 1400 £31,800
Ending Inventory
Inventory from Jan 25 purchase 600 £26 £15,600
2) Last in, last out (LIFO) method
Cost of goods sold Units
Unit
cost Total
£3,25,00
0 £13.0
From the above table we see that the total cost is increasing with the increase in production
levels, however the per unit cost is decreasing with an increase in the production level. This is
because of the fixed cost component. The variable cost of labour and material will increase
with the level of production but the fixed cost per unit will decrease will increasing
production levels. The fixed cost remains the same at any production level, hence at higher
production level, the fixed cost per unit is lower thus reducing the per unit cost. The total cost
is increasing due to higher variable costs as the fixed costs remains the same.
Question 3
The units of closing inventory for Smart Looks for the month of January are given below:
Particulars Units
Opening inventory 500
Purchase 1500
Units available for sale 2000
Units sold 1400
Closing inventory 600
Computation of inventory using the different methods like LIFO, FIFO and average cost
method is presented below:
1) First in, first out (FIFO) method
Cost of goods sold Units
Unit
cost Total
Sales from Jan 1 inventory 500 £20 £10,000
Sales from Jan 18 purchase 800 £24 £19,200
Sales from Jan 25 purchase 100 £26 £2,600
Cost of goods sold 1400 £31,800
Ending Inventory
Inventory from Jan 25 purchase 600 £26 £15,600
2) Last in, last out (LIFO) method
Cost of goods sold Units
Unit
cost Total
Paraphrase This Document
Need a fresh take? Get an instant paraphrase of this document with our AI Paraphraser
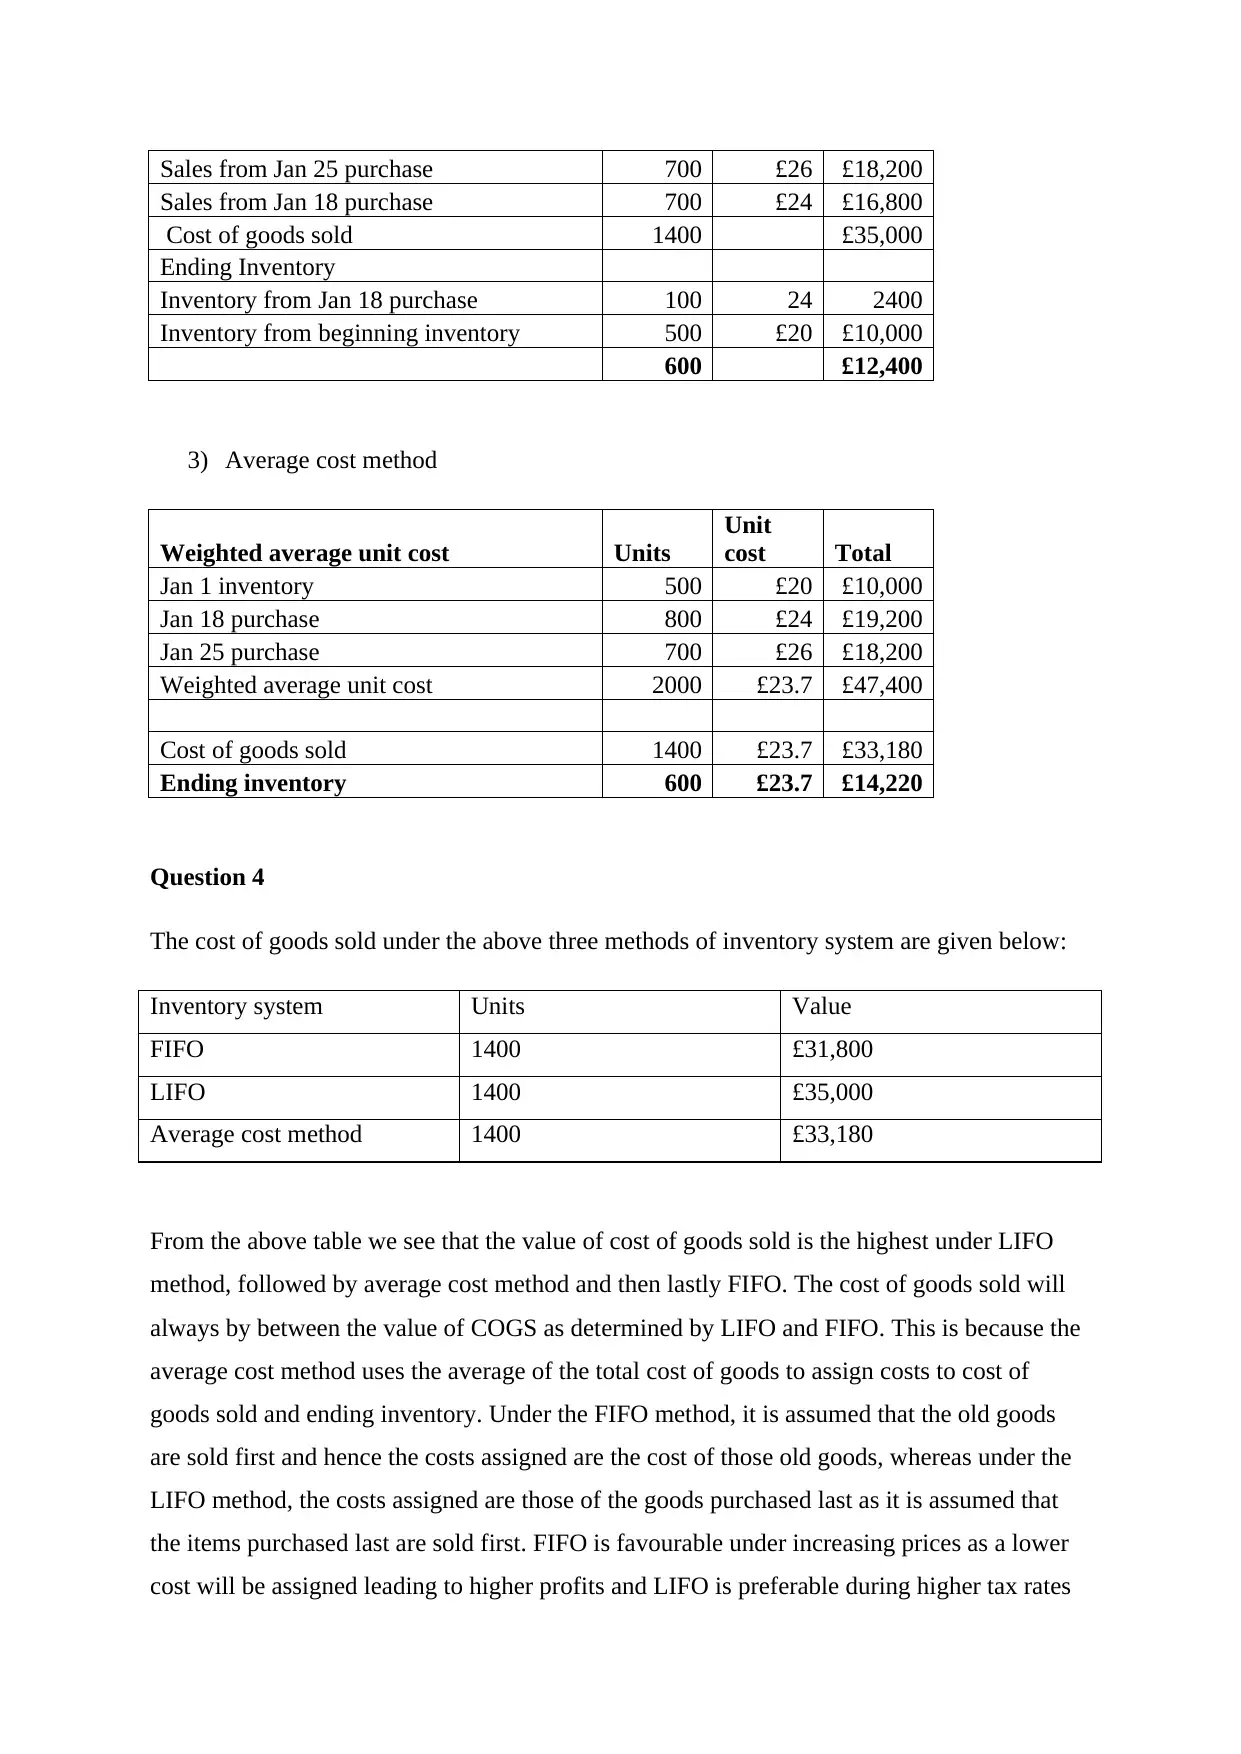
Sales from Jan 25 purchase 700 £26 £18,200
Sales from Jan 18 purchase 700 £24 £16,800
Cost of goods sold 1400 £35,000
Ending Inventory
Inventory from Jan 18 purchase 100 24 2400
Inventory from beginning inventory 500 £20 £10,000
600 £12,400
3) Average cost method
Weighted average unit cost Units
Unit
cost Total
Jan 1 inventory 500 £20 £10,000
Jan 18 purchase 800 £24 £19,200
Jan 25 purchase 700 £26 £18,200
Weighted average unit cost 2000 £23.7 £47,400
Cost of goods sold 1400 £23.7 £33,180
Ending inventory 600 £23.7 £14,220
Question 4
The cost of goods sold under the above three methods of inventory system are given below:
Inventory system Units Value
FIFO 1400 £31,800
LIFO 1400 £35,000
Average cost method 1400 £33,180
From the above table we see that the value of cost of goods sold is the highest under LIFO
method, followed by average cost method and then lastly FIFO. The cost of goods sold will
always by between the value of COGS as determined by LIFO and FIFO. This is because the
average cost method uses the average of the total cost of goods to assign costs to cost of
goods sold and ending inventory. Under the FIFO method, it is assumed that the old goods
are sold first and hence the costs assigned are the cost of those old goods, whereas under the
LIFO method, the costs assigned are those of the goods purchased last as it is assumed that
the items purchased last are sold first. FIFO is favourable under increasing prices as a lower
cost will be assigned leading to higher profits and LIFO is preferable during higher tax rates
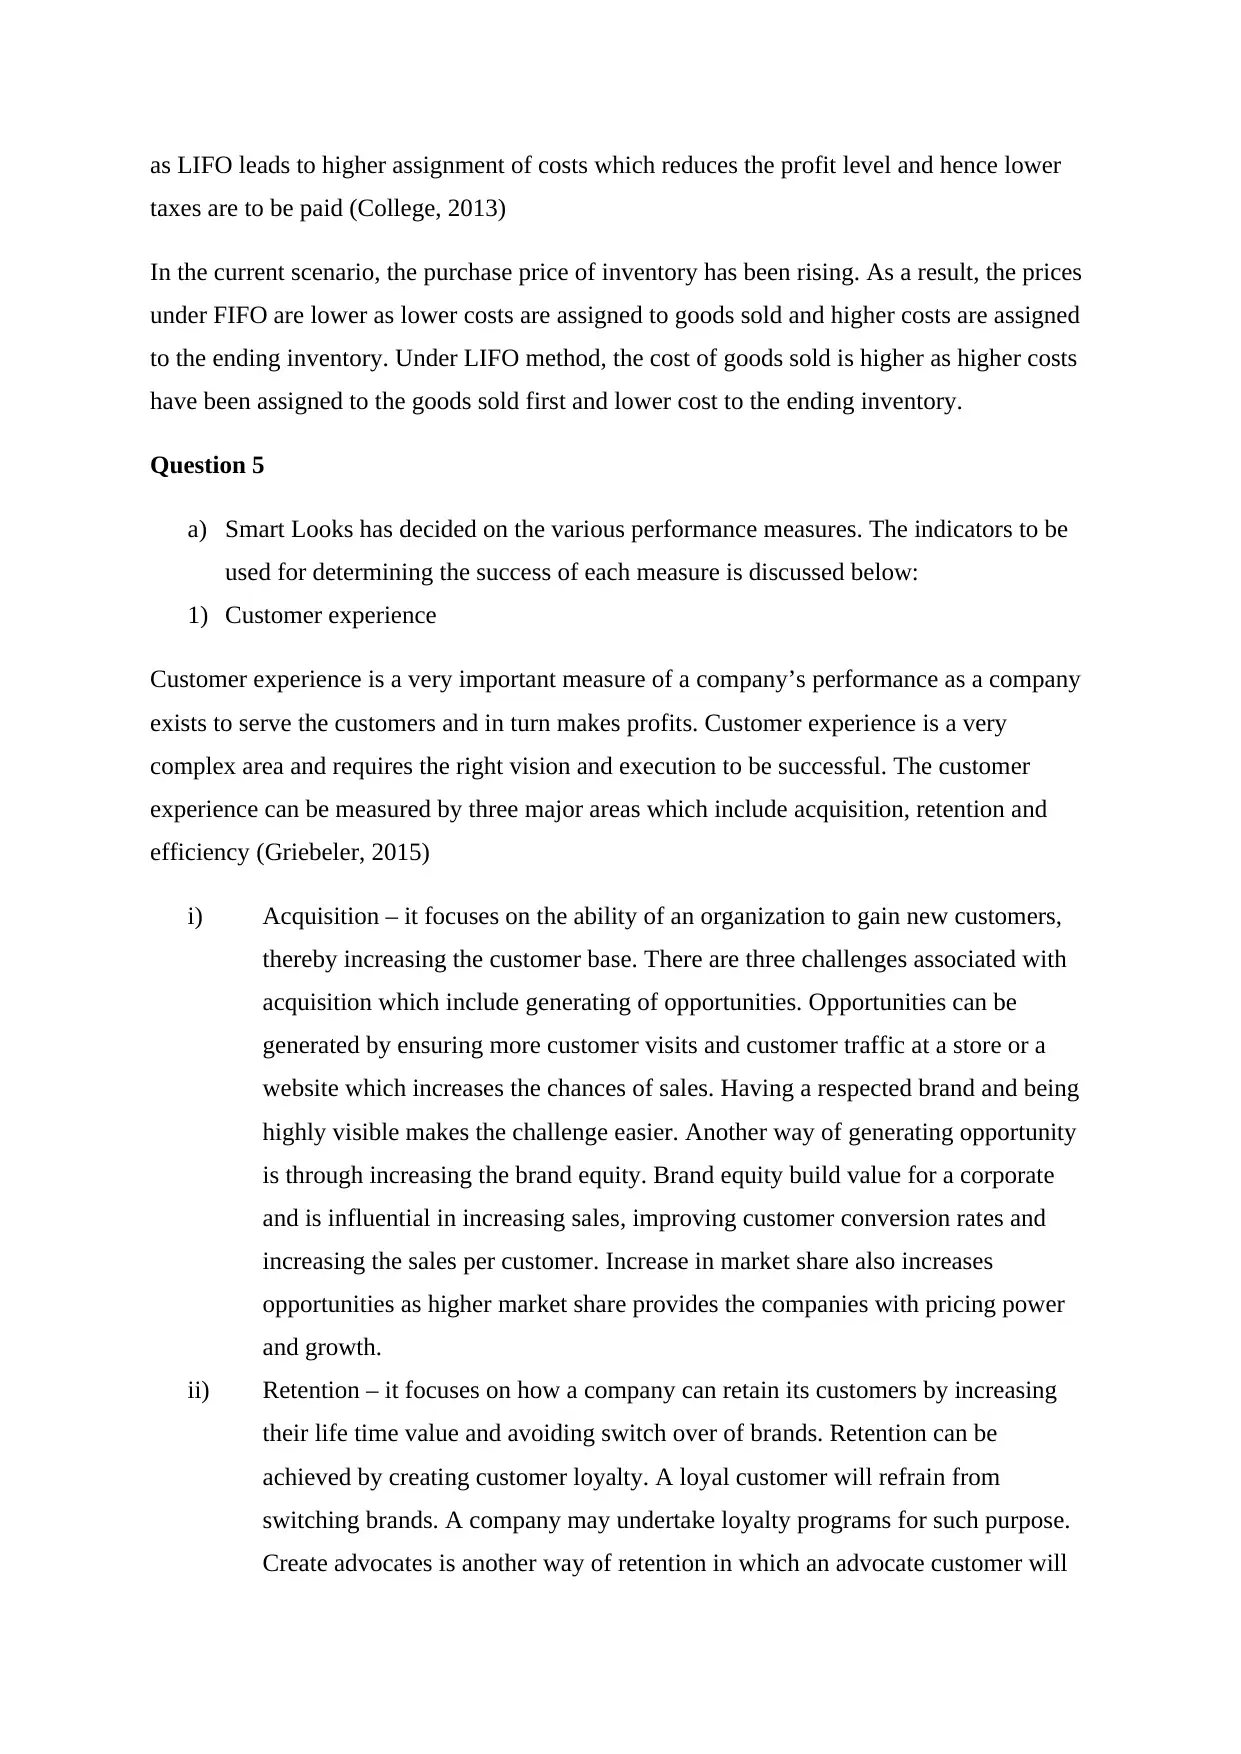
as LIFO leads to higher assignment of costs which reduces the profit level and hence lower
taxes are to be paid (College, 2013)
In the current scenario, the purchase price of inventory has been rising. As a result, the prices
under FIFO are lower as lower costs are assigned to goods sold and higher costs are assigned
to the ending inventory. Under LIFO method, the cost of goods sold is higher as higher costs
have been assigned to the goods sold first and lower cost to the ending inventory.
Question 5
a) Smart Looks has decided on the various performance measures. The indicators to be
used for determining the success of each measure is discussed below:
1) Customer experience
Customer experience is a very important measure of a company’s performance as a company
exists to serve the customers and in turn makes profits. Customer experience is a very
complex area and requires the right vision and execution to be successful. The customer
experience can be measured by three major areas which include acquisition, retention and
efficiency (Griebeler, 2015)
i) Acquisition – it focuses on the ability of an organization to gain new customers,
thereby increasing the customer base. There are three challenges associated with
acquisition which include generating of opportunities. Opportunities can be
generated by ensuring more customer visits and customer traffic at a store or a
website which increases the chances of sales. Having a respected brand and being
highly visible makes the challenge easier. Another way of generating opportunity
is through increasing the brand equity. Brand equity build value for a corporate
and is influential in increasing sales, improving customer conversion rates and
increasing the sales per customer. Increase in market share also increases
opportunities as higher market share provides the companies with pricing power
and growth.
ii) Retention – it focuses on how a company can retain its customers by increasing
their life time value and avoiding switch over of brands. Retention can be
achieved by creating customer loyalty. A loyal customer will refrain from
switching brands. A company may undertake loyalty programs for such purpose.
Create advocates is another way of retention in which an advocate customer will
⊘ This is a preview!⊘
Do you want full access?
Subscribe today to unlock all pages.
Trusted by 1+ million students worldwide
influence his family or friends in doing business with the organization. Having as
many advocates measures the company’s success management. While increasing
the customer base, a company also focuses on increasing the size of the wallet per
customer in order to drive higher profits per customer.
2) Supplier and product quality
Supply chain performance indicators are important tools for monitoring and improving the
performance of supply chain in order to gain competitive advantage. Such indicators also
provide useful information for decision making. Three types of performance indicators
necessary for measurement of supply chain performance are flexibility, resource and output
(Ambe, 2014)
i) Percentage of defective parts per million – it measures the quantity of defective
parts out of the total units produced. This KPI measures the quality of the process
and the product before the product is shipped. The tracking of the defective parts
is done on a control chart with a lower and upper limit in most of the
organizations. The organization has to figure out the reason of the defective part
which can be due to the assemble of defective material or the wrong use of the
part making it defective. This helps in identifying whether the supplier of the
defective part is supplying wrong parts or is there any other issue. Based on the
above analysis, an organization can decide whether it would go for a more
expensive supplier to reduce the defective parts per million (Londe, 2016)
ii) Performance of the supplier – monitoring the supplier performance is crucial to
improved performance. The supplier performance can be measured by gathering
their performance information like lead times from order, compliance of pricing
and other things in the contract, meeting of quality standards. Also customer
experience in respect of response rates, services and attitude can be used to assess
the supplier performance. It is also important to assess the experience of the
supplier of working with the buying organization as the suppliers may be facing
difficulties in dealing with the people of the organization leading to poor
performance (Knowledge, 2013)
3) Operations Efficiency
It is essential for an organization to measures its productivity. Many companies are investing
a lot of money to track their operational efficiencies. People involved in designing such
Paraphrase This Document
Need a fresh take? Get an instant paraphrase of this document with our AI Paraphraser
measurement systems are cost accountants, economists and statistician (Chew, 1988). The
various indicators of operational efficiency include:
i) Budgets – organizations mostly set budgets for their operations. There is a master
budget followed by other operational budgets. The various operational budgets are
sales budget, production budget, material budget, labour budget, etc. A comparison of
the actual results with the above budgets helps in identifying the variances as to where
the results are not being achieved. On the basis of such variances, corrective action
can be taken.
ii) Customer performance – includes metrics for customer satisfaction, speed of
customer issue resolution, and accuracy of customer issue resolution and customer
retention rate (Hatch, 2008)
4) Reducing Maintenance Spending
The maintenance KPIs help in making the maintenance more effective and efficient.
Effective maintenance helps in reducing operational risks and increases equipment reliability.
Efficient maintenance brings equipment reliability and risk reduction with the least possible
resources (Sondalini)
i) Equipment reliability – it can be measured by two ways which are asset MTBF
(mean time between failure) and Production MTBF. The asset MTBF is the time
between unplanned outages of an asset and production MTBF is the time between
unplanned break down of equipment. The data on equipment reliability should be
accurately measured and reported.
ii) Maintenance costs – the various ways of measuring the maintenance costs include
maintenance cost component in the cost of production, difference in the actual and
budgeted maintenance cost, maintenance cost per asset, maintenance cost per
maintenance strategy.
5) Cost reduction and profitability increase
Profitability can be ensured by focusing on four important areas which are reducing costs,
increasing productivity and efficiency and increasing the revenue.
i) Profit margins – a measurement of the profit margins is an indicator of
increasing profitability. The various ratios that can be used include gross
profit margin, net profit margin, return on capital employed, and return on
equity, EBITDA. An increase in the above ratio signifies increasing
profitability (Vrabel)
ii) Operating margin – a measurement of the operating margin is an indicator
of the increase or decrease in costs. An increase in the operating margin
means the costs have reduced and vice versa.
b) The metrics discussed above have been agreed upon for use as they will measure the
performance and in the process lead to reduction in costs and enhance the value and
quality.
1) The costs can be reduced by maintaining operational efficiency, reducing
maintenance spending and cost reduction measures. Operational efficiency will help
in reducing operation costs. Reduced maintenance spending will help in reducing
maintenance costs.
2) The value of the company can be enhanced through rich customer experience. A
satisfied customer will be loyal to the company and can also become the advocate foe
the company thus increasing its value. By ensuring supplier and product quality, the
company can ensure quality goods being supplied by the supplier which will in turn
improve product quality. Also cost efficient suppliers help in reducing costs. By
providing quality products, the company can increase its market value.
Task 2
Question 6
Budget is a short term financial plan where an estimation of the costs, revenues and resources
are made for a specific period and the same are reviewed over a period of time. Budget is a
planning document which comprises of financial and non-financial information of the future
activities to be undertaken by a company (Mirela-Oana Pintea)
Purpose of Budgets
Budgets are important for an effective management as they are a very good control system.
The advantages of budgets include:
a) Setting short term targets – setting targets are great means of implementing goals. The
set targets are objective and action oriented. The targets have a time dimension. Like
at a broader level, the target can be to earn $500000 in the first quarter of next year, at
a lower level it can be have maximum of 5 defective parts per thousand. Through
⊘ This is a preview!⊘
Do you want full access?
Subscribe today to unlock all pages.
Trusted by 1+ million students worldwide
budgets also, management can set short term performance goals for a specified period
of time. All departments in an organisation can set their respective budgets, thus
helping in achieving overall company goals and objectives.
b) Monitoring business performance – a business can set its benchmark by comparing its
financial performance with the budgeted figures. In order to strengthen its business
performance, a business needs to identify and monitor its key drivers. These may be
called as key performance indicators (KPIs) and these KPIs will have strong impact
on the business. The performance if a business is affected by many factors, however it
important to focus on the most influential ones and monitor them carefully. Most
important key drivers for any business include sales, costs and working capital. When
these key drivers are measures against the budgets or forecasts, any problems relating
to low profitability or cash flow problems can be highlighted (Nibusinessinfo.co.uk)
c) Control measures – budgets help in performance evaluation. The targets set under the
budget are compared with the actual results and any deviation thereafter is notified.
Budgets act as control mechanisms. The control process is a continuous process as it
is not possible to ascertain the timing and effect of external factors of the environment
on the business. Managers exercise control by watching the actions of the employees
and also with the use of various reports provided either verbally or orally. These
reports may be provided daily, weekly, monthly or annually depending upon the
demand of the supervisor.
d) Motivation to achieve performance levels - employees should be involved in creating
a budget where their goals and performance expectation are defined. Rewards should
be linked to the attainment of the budgeted performance levels. This will motivate the
employees to perform better as rewards would be given for achieving desired results.
The employees should be continually updated about their adherence to the budgeted
performance levels so that they can be on the correct lines of achieving targeted
performance.
e) Monitoring relationship between revenue and costs at different activity levels – every
business has limited resources to be used for making products and generating revenue.
A budget estimates the revenues and costs associated with the particular department
for the specified period. While allocating resources to a particular cost centre or
department, an account of the various costs to be incurred and the resulting revenues
should be made to see if the right amount of resources have been allocated. Also a
close monitoring of the revenues being generated by the department and the costs
Paraphrase This Document
Need a fresh take? Get an instant paraphrase of this document with our AI Paraphraser
being incurred will help in identifying the profit making departments or products from
the non-profitable ones.
f) Aid to communication with the senior department – budgets act as formal channel of
communication between seniors and juniors. In the process of preparing a budget,
senior management takes the inputs from the employees also, thus facilitating
communication. Also once budgets are prepared, they are communicated to the whole
organisation.
There are various methods available for preparing budgets some of which are discussed
below:
a) Zero based budget – it is a method budgeting which starts from zero base. All the
expenses need to be justified every period as if they were being incurred for the first
time (Pidgeon, 2010). Zero based budgeting requires thorough knowledge of the
organisation and requires lot of time, effort and training. It puts a lot of pressure on
the manager to justify their spending from scratch (Portal, 2013)
b) Fixed budget – it is also called a static budget. It is based on the assumption that the
estimate of the sales and volume will not change over the specified period and on the
basis of the estimated sales and revenue, expenses and operations are planned.
However, this budget is not reliable as the estimation of sales is rarely accurate. Any
growth or decline in the industry is not taken into consideration and hence actual
performance cannot be compared to the budgeted ones. Though fixed budgets are not
reliable but they can be useful for companies with reliable annual trends.
c) Variable budget – also called flexible budget, is a financial plan of revenues and
expenses based on the current actual output. The budget takes into consideration the
effect on revenues and expenses of the change in volume. Under a flexible budget,
there are different budgeted costs for different levels of activity. Under the budget, all
expenses are classified into fixed, variable and semi variable (Lodha)
The most suitable budget for Smart Looks is flexible budget because the company has both
fixed and variable costs. The level of activity also may differ from time to time; hence it is
beneficial to use flexible budgeting.
Question 7
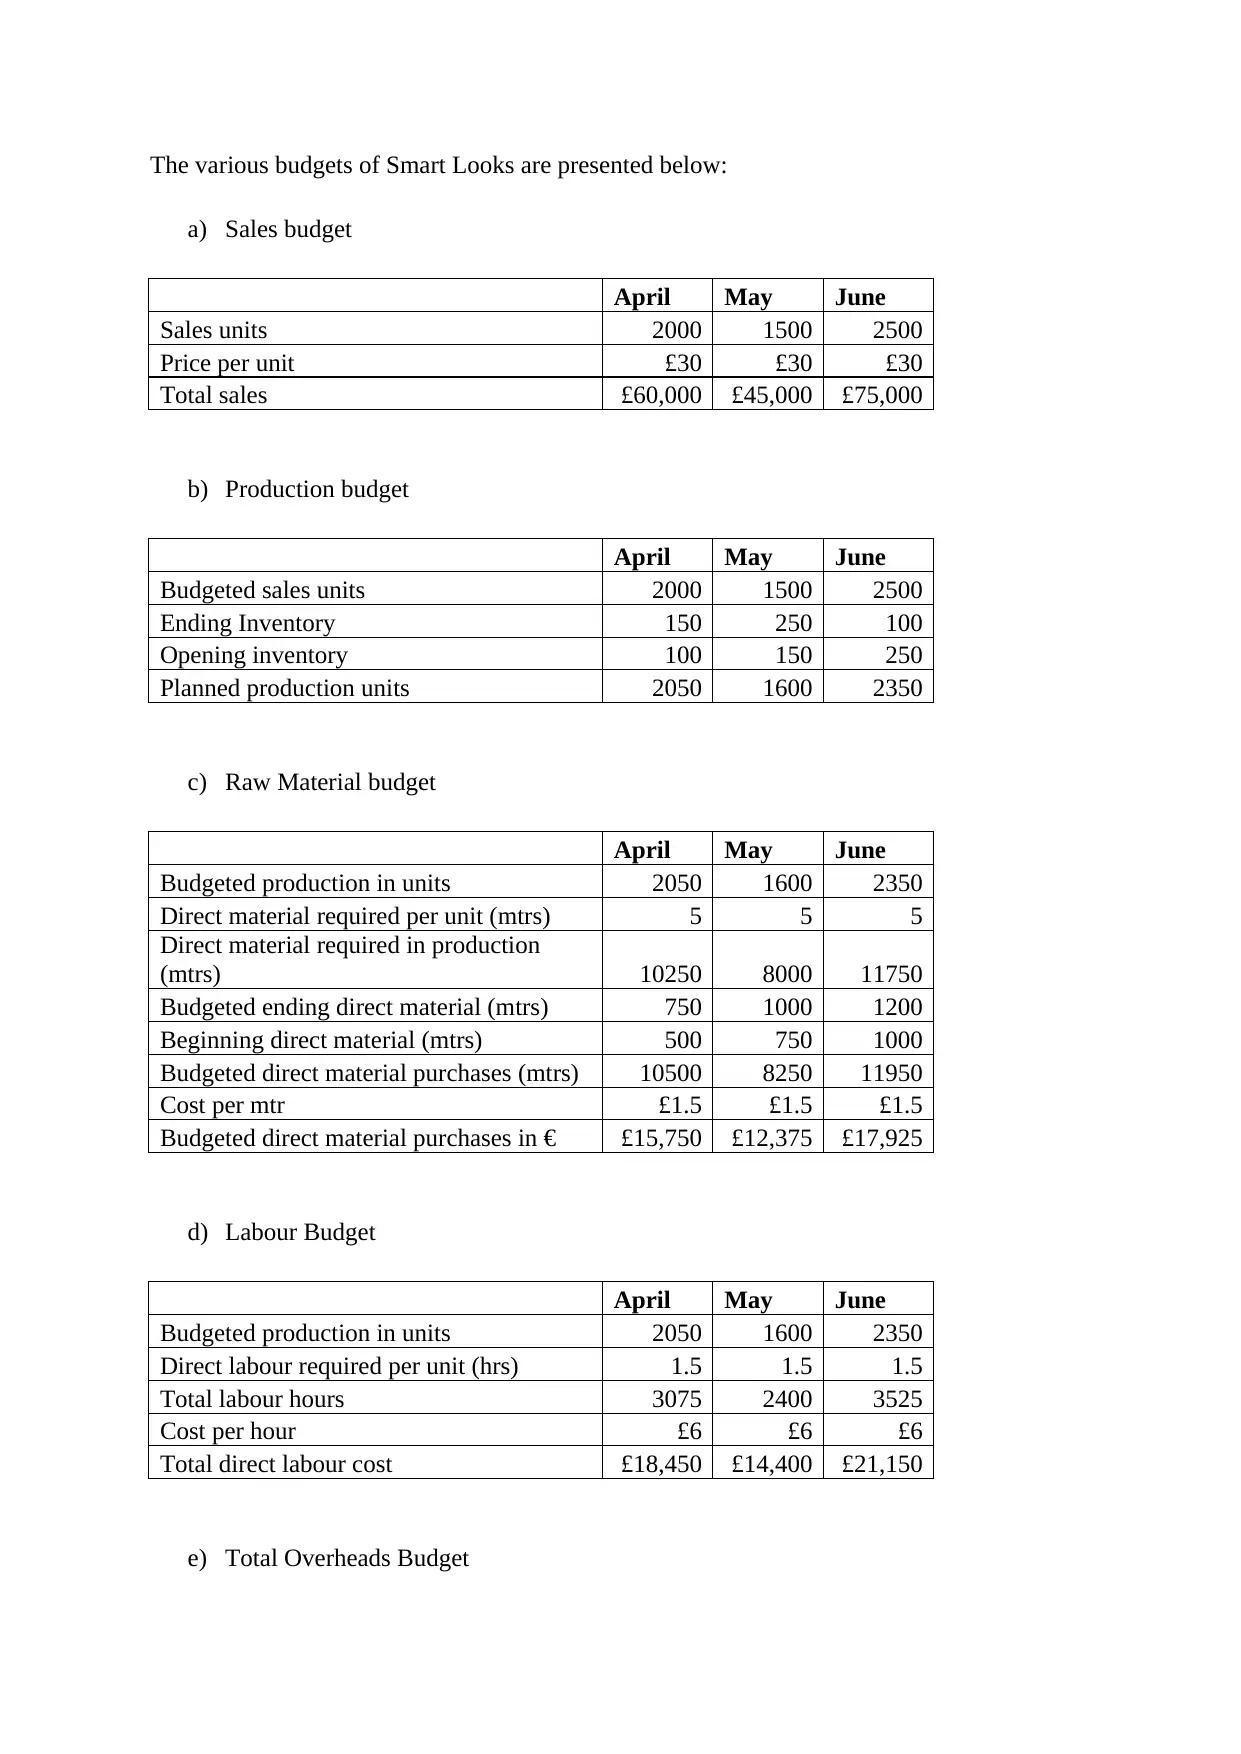
The various budgets of Smart Looks are presented below:
a) Sales budget
April May June
Sales units 2000 1500 2500
Price per unit £30 £30 £30
Total sales £60,000 £45,000 £75,000
b) Production budget
April May June
Budgeted sales units 2000 1500 2500
Ending Inventory 150 250 100
Opening inventory 100 150 250
Planned production units 2050 1600 2350
c) Raw Material budget
April May June
Budgeted production in units 2050 1600 2350
Direct material required per unit (mtrs) 5 5 5
Direct material required in production
(mtrs) 10250 8000 11750
Budgeted ending direct material (mtrs) 750 1000 1200
Beginning direct material (mtrs) 500 750 1000
Budgeted direct material purchases (mtrs) 10500 8250 11950
Cost per mtr £1.5 £1.5 £1.5
Budgeted direct material purchases in € £15,750 £12,375 £17,925
d) Labour Budget
April May June
Budgeted production in units 2050 1600 2350
Direct labour required per unit (hrs) 1.5 1.5 1.5
Total labour hours 3075 2400 3525
Cost per hour £6 £6 £6
Total direct labour cost £18,450 £14,400 £21,150
e) Total Overheads Budget
⊘ This is a preview!⊘
Do you want full access?
Subscribe today to unlock all pages.
Trusted by 1+ million students worldwide
1 out of 18
Related Documents


Your All-in-One AI-Powered Toolkit for Academic Success.
+13062052269
info@desklib.com
Available 24*7 on WhatsApp / Email
![[object Object]](/_next/static/media/star-bottom.7253800d.svg)
Unlock your academic potential
Copyright © 2020–2026 A2Z Services. All Rights Reserved. Developed and managed by ZUCOL.