Detailed Analysis: Management Accounting Homework Solution
VerifiedAdded on 2020/03/23
|18
|2694
|257
Homework Assignment
AI Summary
This document presents a comprehensive solution to a management accounting assignment, covering various aspects of cost analysis and financial modeling. The assignment is divided into multiple parts, starting with the development of cost functions for different business components like part-time dentists, receptionists, supplies, rent, and administration. It then proceeds to analyze these costs, calculate average fees, and project future profits. Part B focuses on regression analysis, examining the relationship between revenues and visits with supplies cost, and interpreting the results, including R-squared values and p-values. Part C delves into overhead cost analysis, developing a cost function based on hours worked and calculating predicted versus actual overhead costs. Finally, Part D presents a basic probability problem involving meal choices. The solution provides detailed calculations, interpretations, and analyses to address each requirement of the assignment.
Running head: MANAGEMENT ACCOUNTING
Management Accounting
Name of the Student:
Name of the University:
Author’s Note:
Management Accounting
Name of the Student:
Name of the University:
Author’s Note:
Paraphrase This Document
Need a fresh take? Get an instant paraphrase of this document with our AI Paraphraser
1MANAGEMENT ACCOUNTING
Table of Contents
Answer to PART A:.........................................................................................................................3
Requirement A1:..........................................................................................................................3
Requirement A2:..........................................................................................................................5
Requirement A3:..........................................................................................................................5
Answer to Part B:.............................................................................................................................6
Requirement B1:..........................................................................................................................6
Requirement B.1a:.......................................................................................................................7
Requirement B.1b:.......................................................................................................................8
Requirement B.1c:.......................................................................................................................8
Requirement B.2:.........................................................................................................................8
Requirement B.2a:.......................................................................................................................9
Requirement B.2b:.....................................................................................................................10
Requirement B.2c:.....................................................................................................................10
Requirement B.2:.......................................................................................................................10
Answer to Part C:...........................................................................................................................12
Requirement C.1:.......................................................................................................................12
Requirement C.2:.......................................................................................................................13
Requirement C.3:.......................................................................................................................13
Requirement C.4:.......................................................................................................................13
2MANAGEMENT ACCOUNTING
Answer to Part D:..........................................................................................................................14
Bibliography:.................................................................................................................................17
Answer to Part D:..........................................................................................................................14
Bibliography:.................................................................................................................................17
⊘ This is a preview!⊘
Do you want full access?
Subscribe today to unlock all pages.
Trusted by 1+ million students worldwide
3MANAGEMENT ACCOUNTING
Answer to PART A:
Requirement A1:
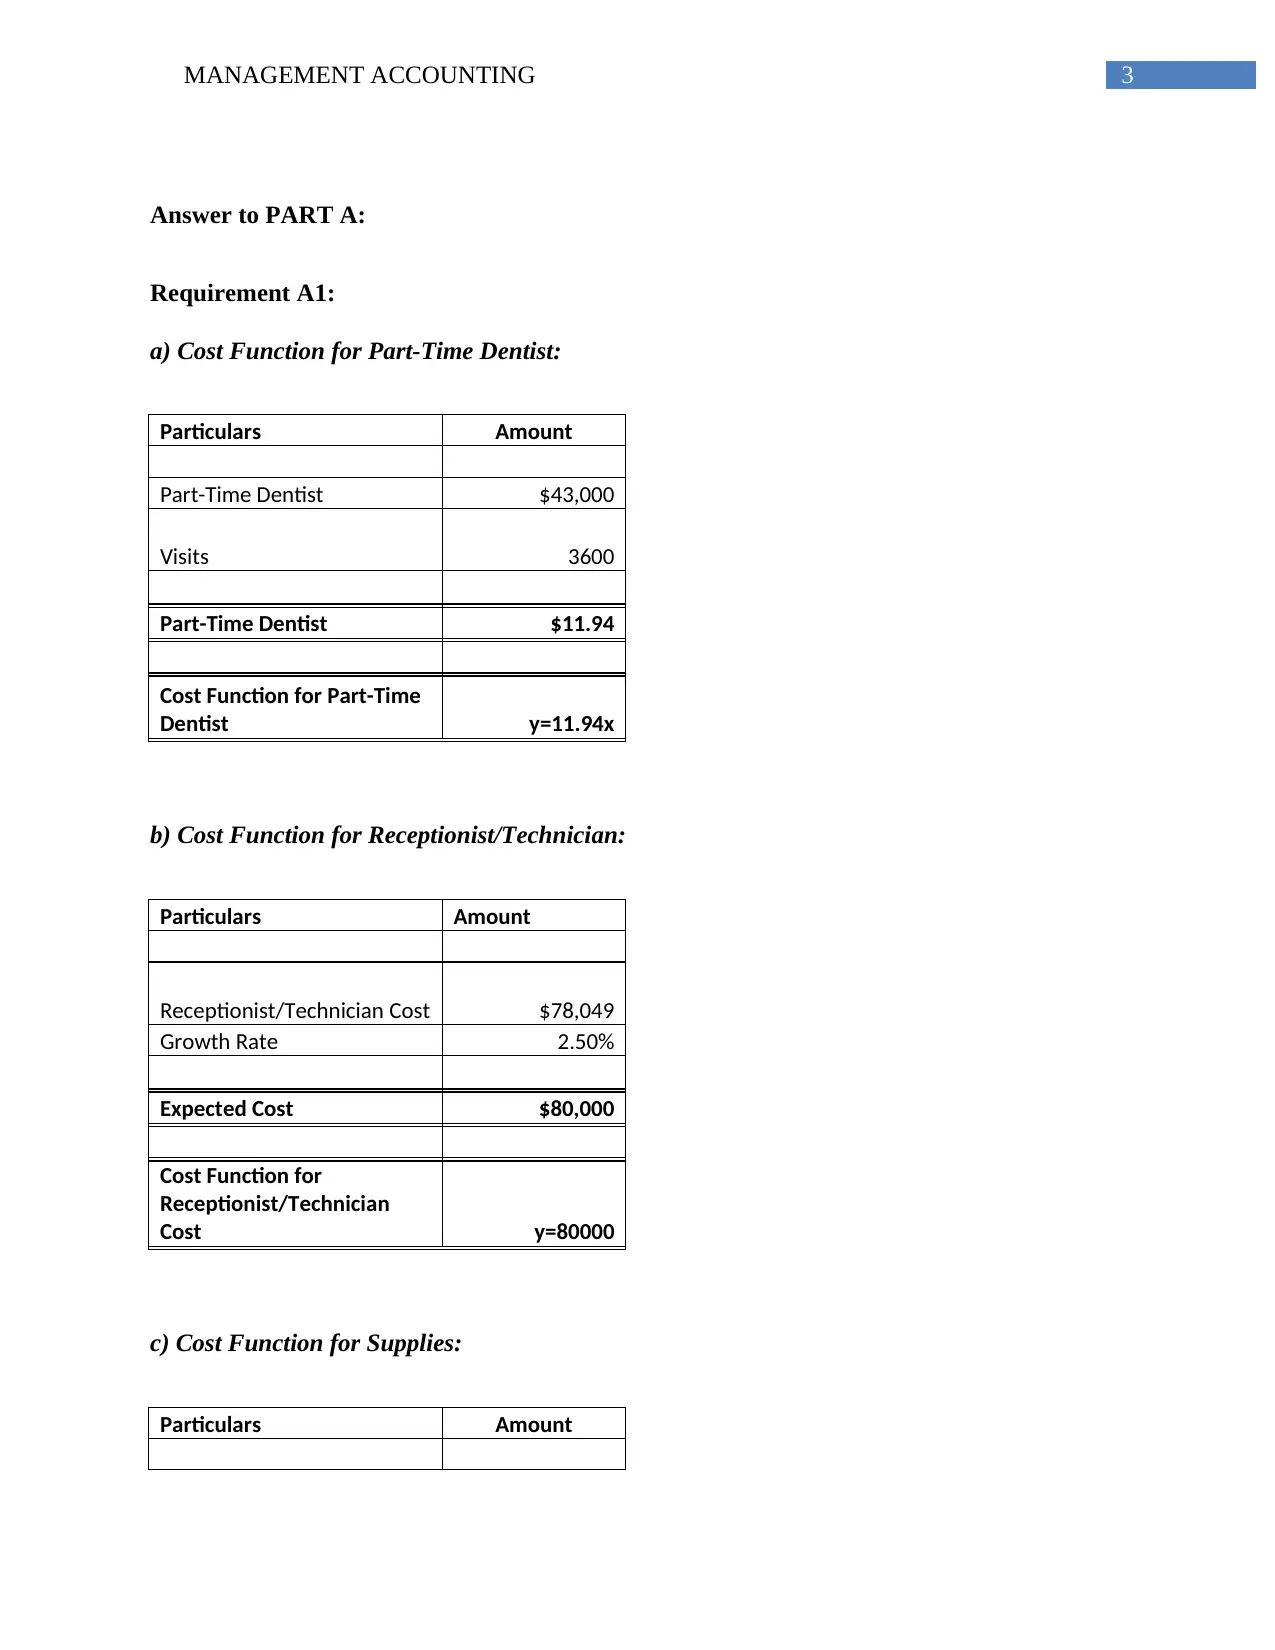
a) Cost Function for Part-Time Dentist:
Particulars Amount
Part-Time Dentist $43,000
Visits 3600
Part-Time Dentist $11.94
Cost Function for Part-Time
Dentist y=11.94x
b) Cost Function for Receptionist/Technician:
Particulars Amount
Receptionist/Technician Cost $78,049
Growth Rate 2.50%
Expected Cost $80,000
Cost Function for
Receptionist/Technician
Cost y=80000
c) Cost Function for Supplies:
Particulars Amount
Answer to PART A:
Requirement A1:
a) Cost Function for Part-Time Dentist:
Particulars Amount
Part-Time Dentist $43,000
Visits 3600
Part-Time Dentist $11.94
Cost Function for Part-Time
Dentist y=11.94x
b) Cost Function for Receptionist/Technician:
Particulars Amount
Receptionist/Technician Cost $78,049
Growth Rate 2.50%
Expected Cost $80,000
Cost Function for
Receptionist/Technician
Cost y=80000
c) Cost Function for Supplies:
Particulars Amount
Paraphrase This Document
Need a fresh take? Get an instant paraphrase of this document with our AI Paraphraser
4MANAGEMENT ACCOUNTING
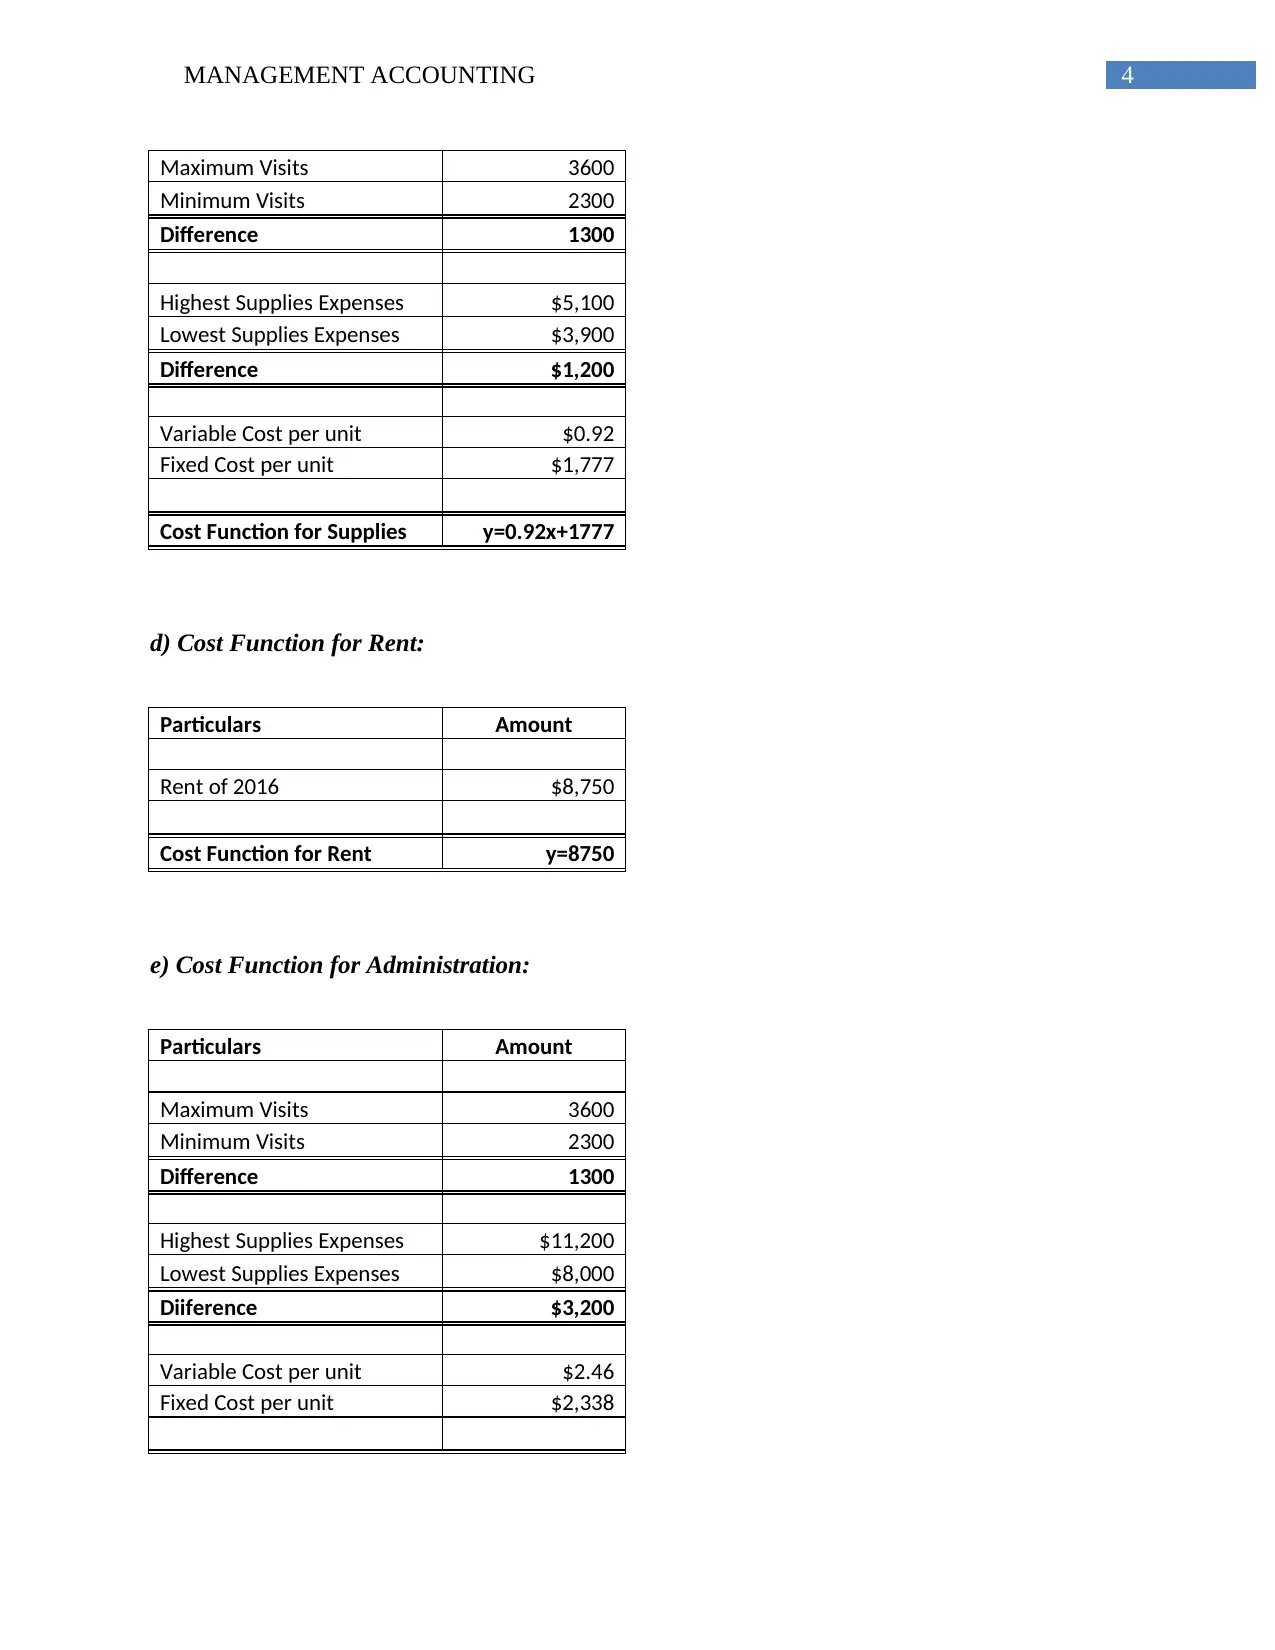
Maximum Visits 3600
Minimum Visits 2300
Difference 1300
Highest Supplies Expenses $5,100
Lowest Supplies Expenses $3,900
Difference $1,200
Variable Cost per unit $0.92
Fixed Cost per unit $1,777
Cost Function for Supplies y=0.92x+1777
d) Cost Function for Rent:
Particulars Amount
Rent of 2016 $8,750
Cost Function for Rent y=8750
e) Cost Function for Administration:
Particulars Amount
Maximum Visits 3600
Minimum Visits 2300
Difference 1300
Highest Supplies Expenses $11,200
Lowest Supplies Expenses $8,000
Diiference $3,200
Variable Cost per unit $2.46
Fixed Cost per unit $2,338
Maximum Visits 3600
Minimum Visits 2300
Difference 1300
Highest Supplies Expenses $5,100
Lowest Supplies Expenses $3,900
Difference $1,200
Variable Cost per unit $0.92
Fixed Cost per unit $1,777
Cost Function for Supplies y=0.92x+1777
d) Cost Function for Rent:
Particulars Amount
Rent of 2016 $8,750
Cost Function for Rent y=8750
e) Cost Function for Administration:
Particulars Amount
Maximum Visits 3600
Minimum Visits 2300
Difference 1300
Highest Supplies Expenses $11,200
Lowest Supplies Expenses $8,000
Diiference $3,200
Variable Cost per unit $2.46
Fixed Cost per unit $2,338
5MANAGEMENT ACCOUNTING
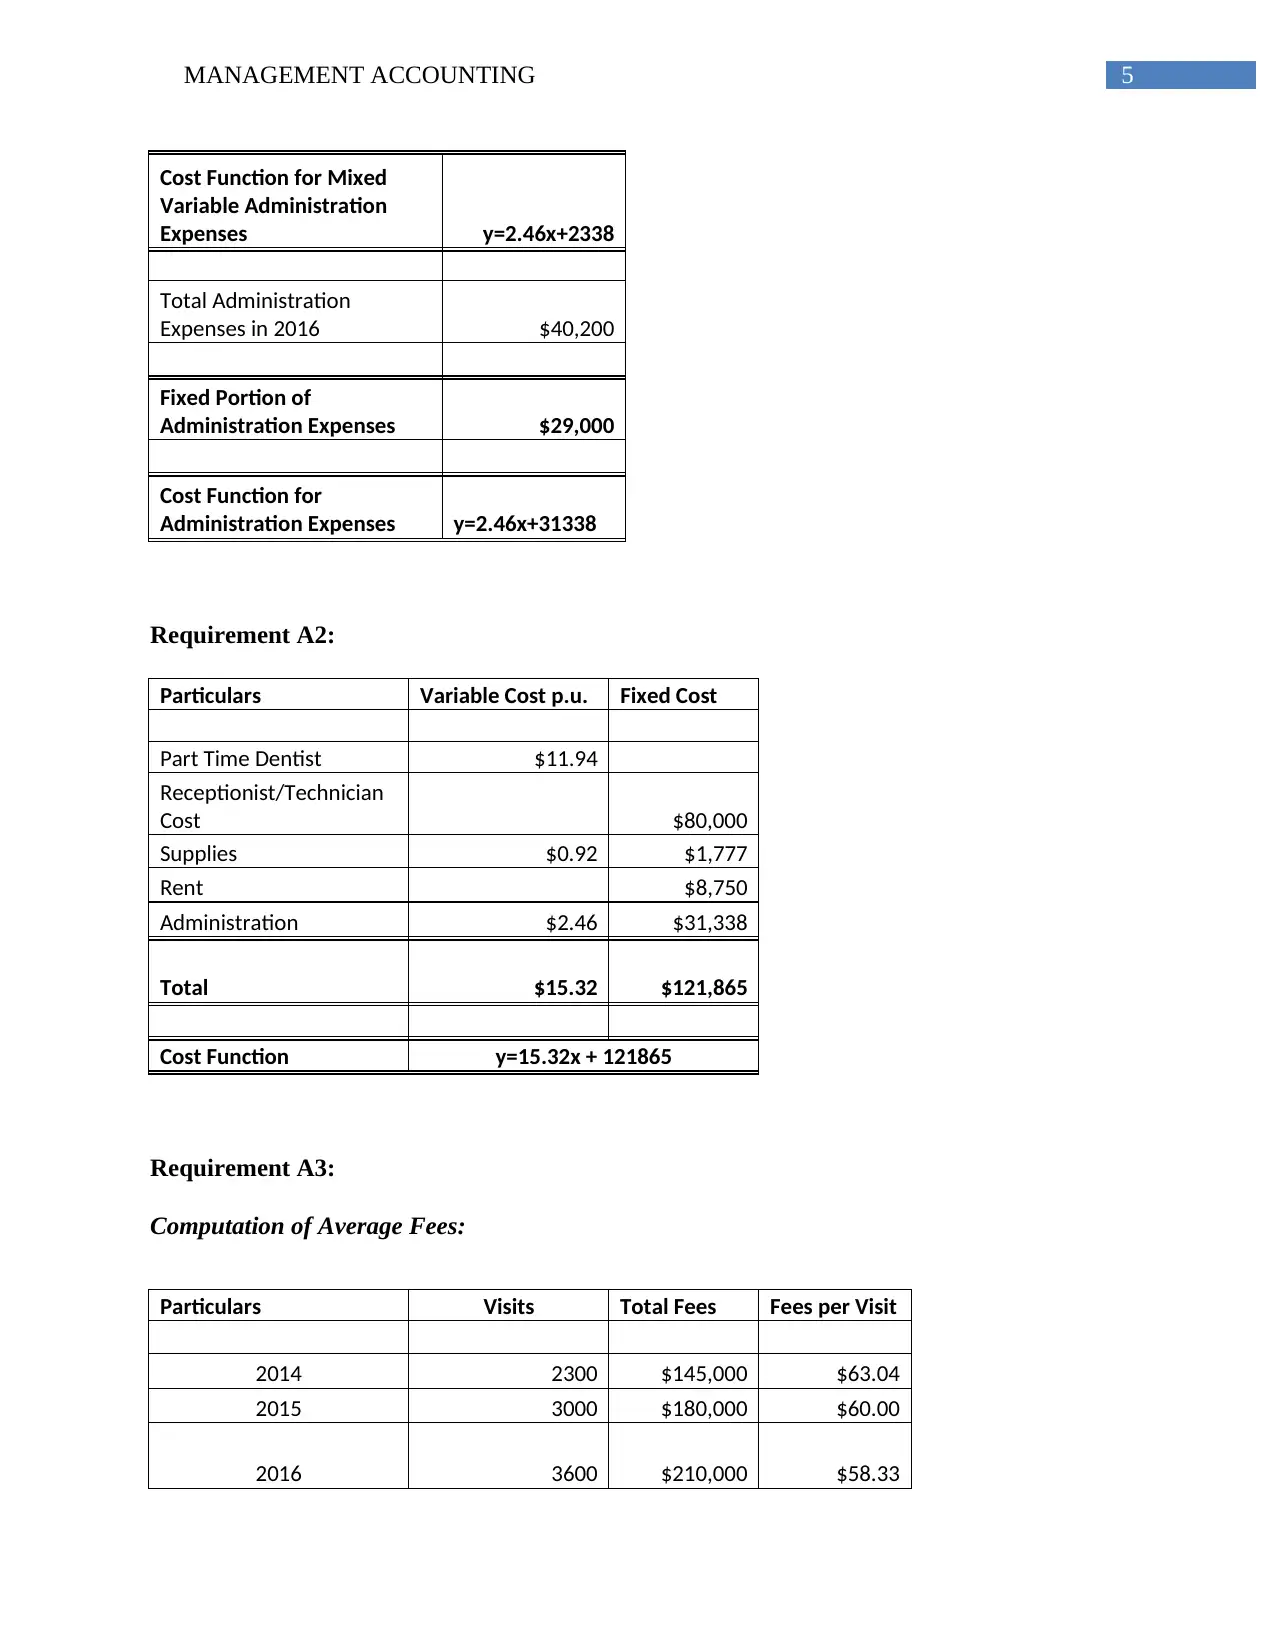
Cost Function for Mixed
Variable Administration
Expenses y=2.46x+2338
Total Administration
Expenses in 2016 $40,200
Fixed Portion of
Administration Expenses $29,000
Cost Function for
Administration Expenses y=2.46x+31338
Requirement A2:
Particulars Variable Cost p.u. Fixed Cost
Part Time Dentist $11.94
Receptionist/Technician
Cost $80,000
Supplies $0.92 $1,777
Rent $8,750
Administration $2.46 $31,338
Total $15.32 $121,865
Cost Function y=15.32x + 121865
Requirement A3:
Computation of Average Fees:
Particulars Visits Total Fees Fees per Visit
2014 2300 $145,000 $63.04
2015 3000 $180,000 $60.00
2016 3600 $210,000 $58.33
⊘ This is a preview!⊘
Do you want full access?
Subscribe today to unlock all pages.
Trusted by 1+ million students worldwide
6MANAGEMENT ACCOUNTING
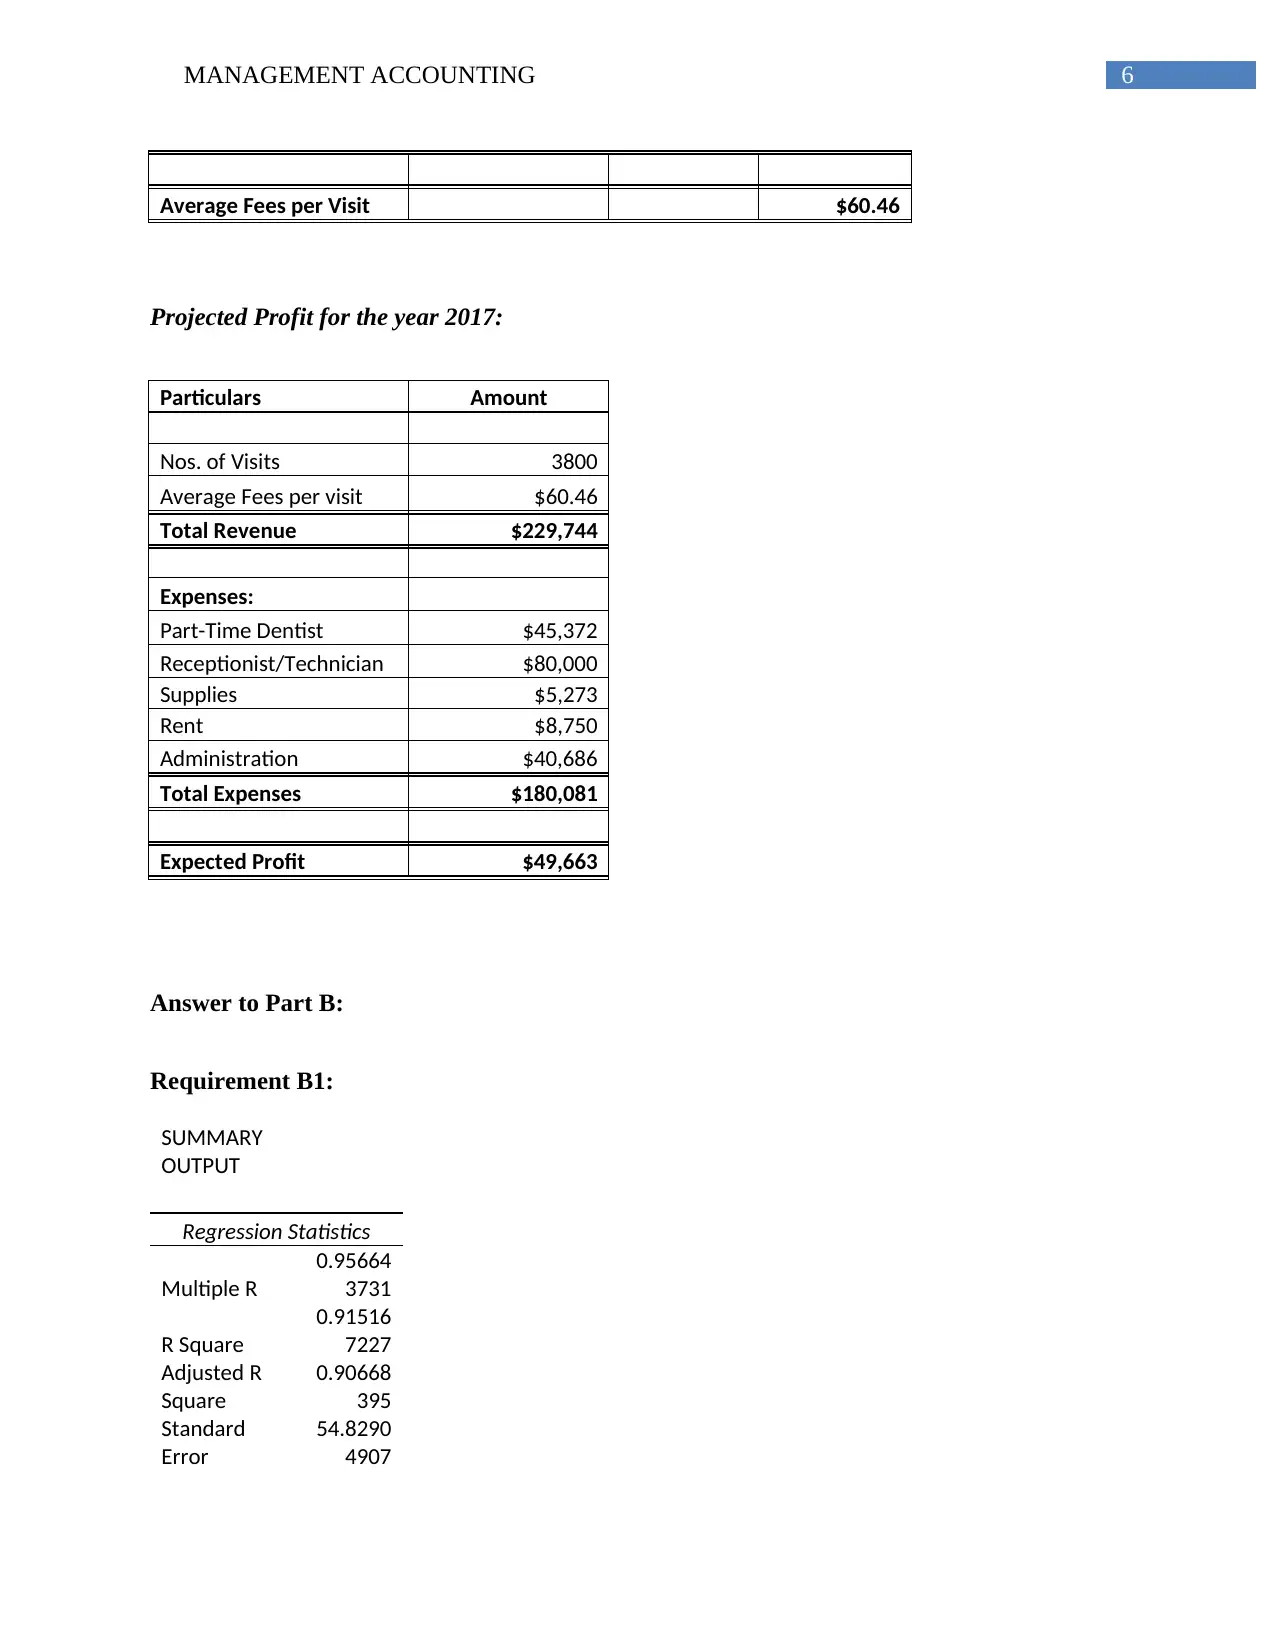
Average Fees per Visit $60.46
Projected Profit for the year 2017:
Particulars Amount
Nos. of Visits 3800
Average Fees per visit $60.46
Total Revenue $229,744
Expenses:
Part-Time Dentist $45,372
Receptionist/Technician $80,000
Supplies $5,273
Rent $8,750
Administration $40,686
Total Expenses $180,081
Expected Profit $49,663
Answer to Part B:
Requirement B1:
SUMMARY
OUTPUT
Regression Statistics
Multiple R
0.95664
3731
R Square
0.91516
7227
Adjusted R
Square
0.90668
395
Standard
Error
54.8290
4907
Paraphrase This Document
Need a fresh take? Get an instant paraphrase of this document with our AI Paraphraser
7MANAGEMENT ACCOUNTING
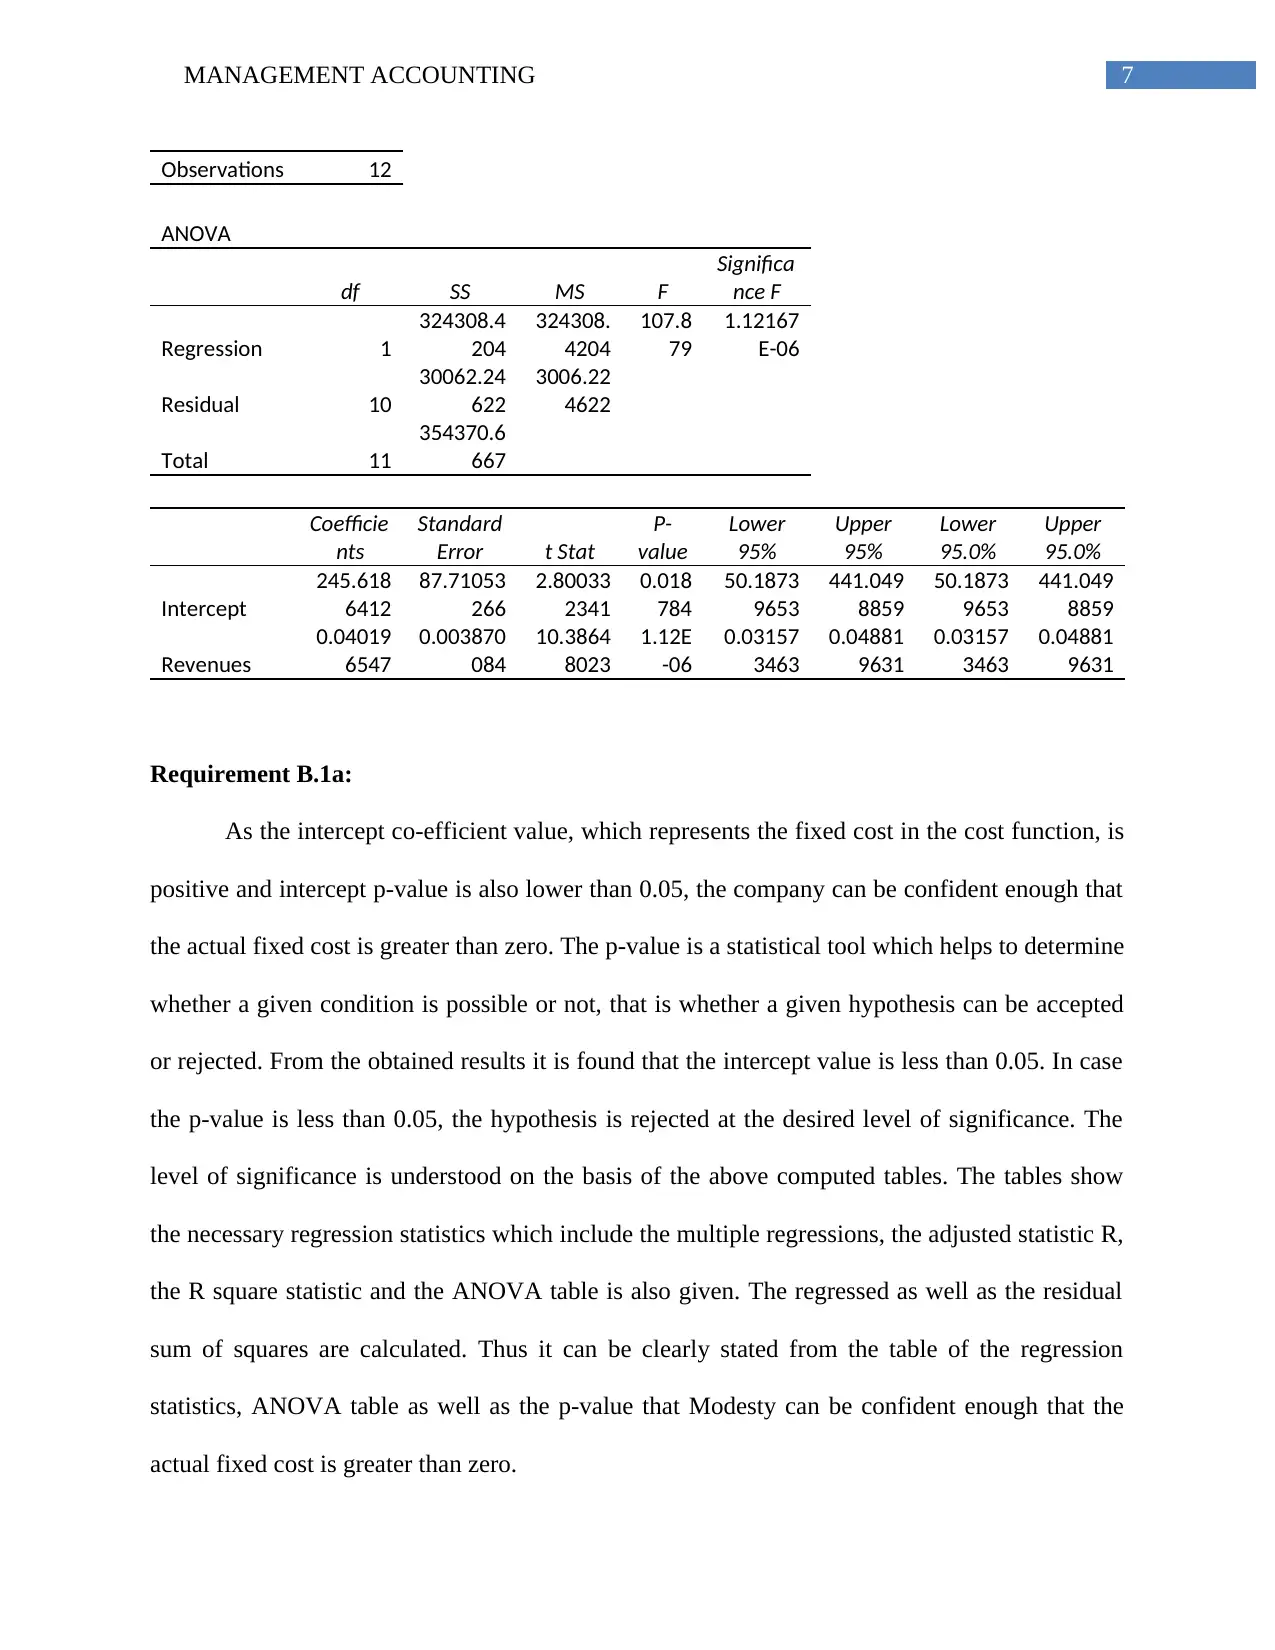
Observations 12
ANOVA
df SS MS F
Significa
nce F
Regression 1
324308.4
204
324308.
4204
107.8
79
1.12167
E-06
Residual 10
30062.24
622
3006.22
4622
Total 11
354370.6
667
Coefficie
nts
Standard
Error t Stat
P-
value
Lower
95%
Upper
95%
Lower
95.0%
Upper
95.0%
Intercept
245.618
6412
87.71053
266
2.80033
2341
0.018
784
50.1873
9653
441.049
8859
50.1873
9653
441.049
8859
Revenues
0.04019
6547
0.003870
084
10.3864
8023
1.12E
-06
0.03157
3463
0.04881
9631
0.03157
3463
0.04881
9631
Requirement B.1a:
As the intercept co-efficient value, which represents the fixed cost in the cost function, is
positive and intercept p-value is also lower than 0.05, the company can be confident enough that
the actual fixed cost is greater than zero. The p-value is a statistical tool which helps to determine
whether a given condition is possible or not, that is whether a given hypothesis can be accepted
or rejected. From the obtained results it is found that the intercept value is less than 0.05. In case
the p-value is less than 0.05, the hypothesis is rejected at the desired level of significance. The
level of significance is understood on the basis of the above computed tables. The tables show
the necessary regression statistics which include the multiple regressions, the adjusted statistic R,
the R square statistic and the ANOVA table is also given. The regressed as well as the residual
sum of squares are calculated. Thus it can be clearly stated from the table of the regression
statistics, ANOVA table as well as the p-value that Modesty can be confident enough that the
actual fixed cost is greater than zero.
8MANAGEMENT ACCOUNTING
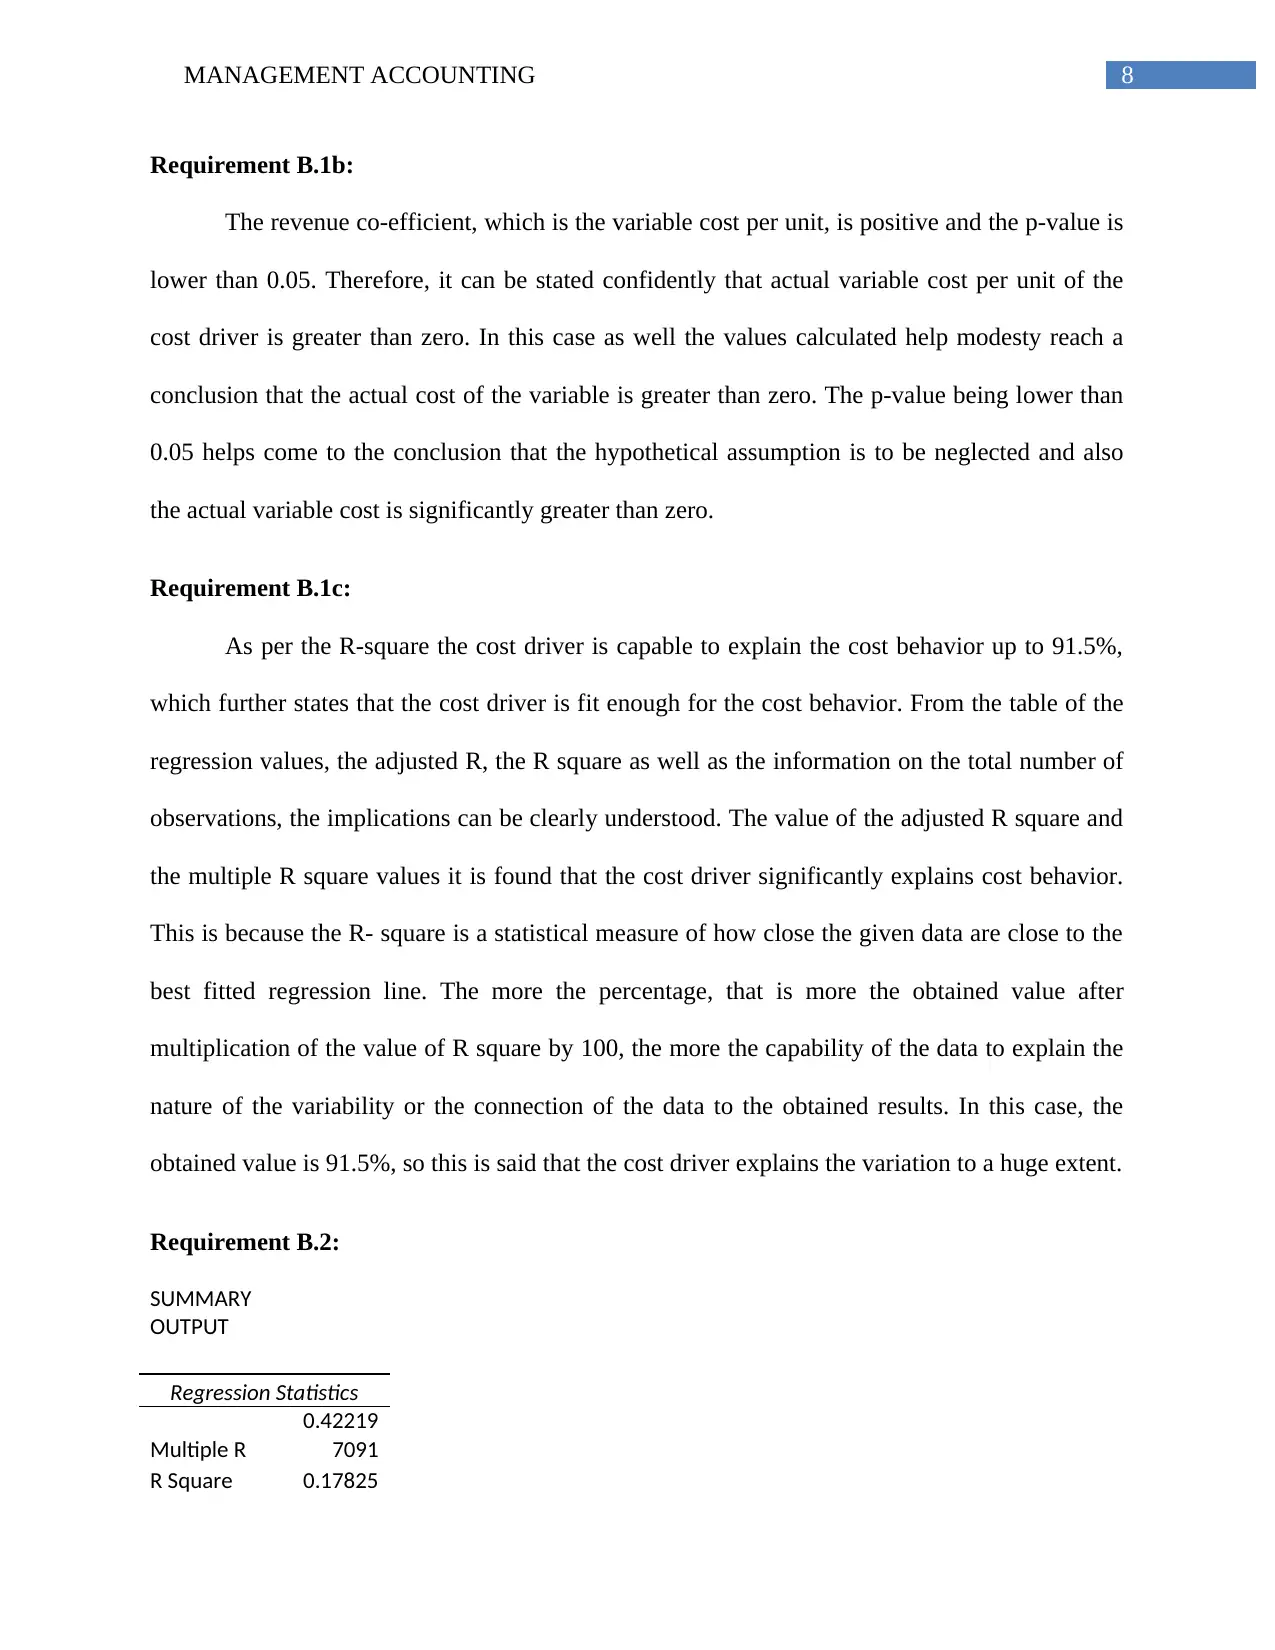
Requirement B.1b:
The revenue co-efficient, which is the variable cost per unit, is positive and the p-value is
lower than 0.05. Therefore, it can be stated confidently that actual variable cost per unit of the
cost driver is greater than zero. In this case as well the values calculated help modesty reach a
conclusion that the actual cost of the variable is greater than zero. The p-value being lower than
0.05 helps come to the conclusion that the hypothetical assumption is to be neglected and also
the actual variable cost is significantly greater than zero.
Requirement B.1c:
As per the R-square the cost driver is capable to explain the cost behavior up to 91.5%,
which further states that the cost driver is fit enough for the cost behavior. From the table of the
regression values, the adjusted R, the R square as well as the information on the total number of
observations, the implications can be clearly understood. The value of the adjusted R square and
the multiple R square values it is found that the cost driver significantly explains cost behavior.
This is because the R- square is a statistical measure of how close the given data are close to the
best fitted regression line. The more the percentage, that is more the obtained value after
multiplication of the value of R square by 100, the more the capability of the data to explain the
nature of the variability or the connection of the data to the obtained results. In this case, the
obtained value is 91.5%, so this is said that the cost driver explains the variation to a huge extent.
Requirement B.2:
SUMMARY
OUTPUT
Regression Statistics
Multiple R
0.42219
7091
R Square 0.17825
⊘ This is a preview!⊘
Do you want full access?
Subscribe today to unlock all pages.
Trusted by 1+ million students worldwide
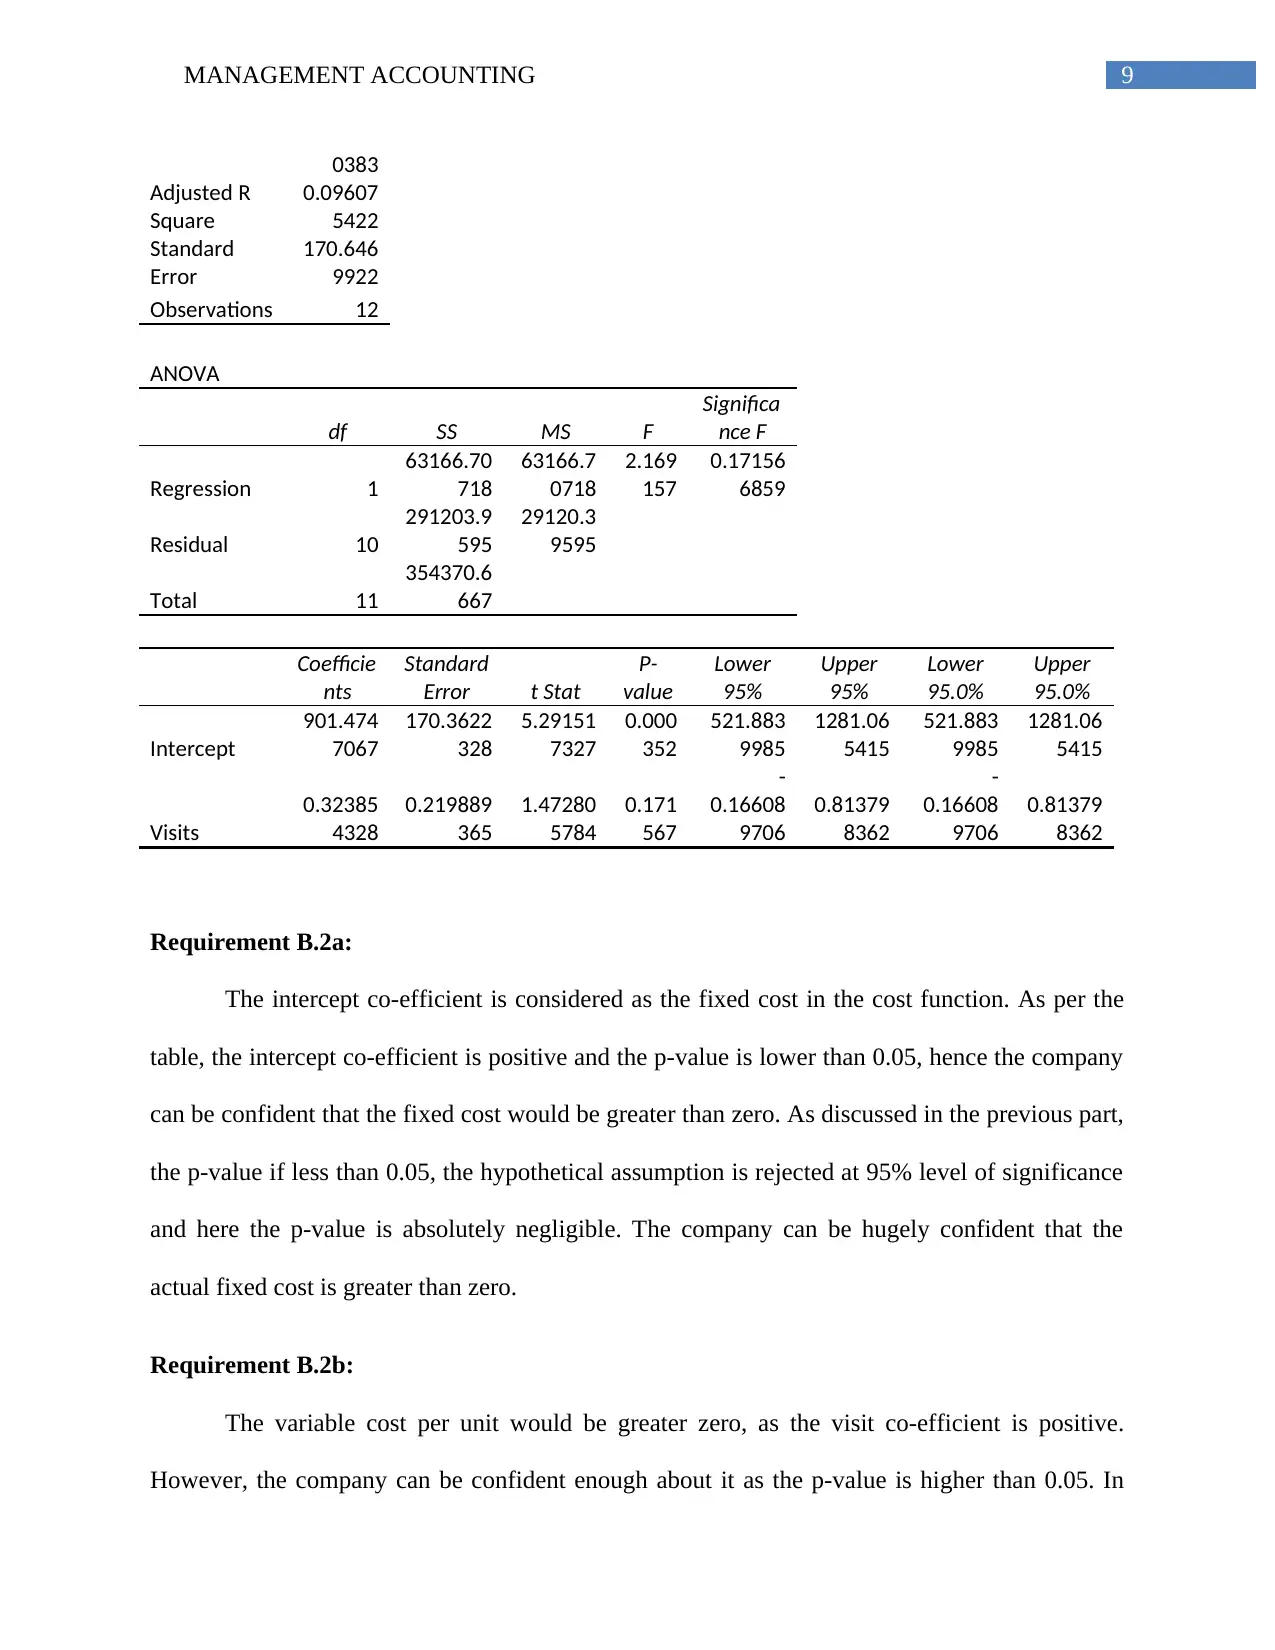
9MANAGEMENT ACCOUNTING
0383
Adjusted R
Square
0.09607
5422
Standard
Error
170.646
9922
Observations 12
ANOVA
df SS MS F
Significa
nce F
Regression 1
63166.70
718
63166.7
0718
2.169
157
0.17156
6859
Residual 10
291203.9
595
29120.3
9595
Total 11
354370.6
667
Coefficie
nts
Standard
Error t Stat
P-
value
Lower
95%
Upper
95%
Lower
95.0%
Upper
95.0%
Intercept
901.474
7067
170.3622
328
5.29151
7327
0.000
352
521.883
9985
1281.06
5415
521.883
9985
1281.06
5415
Visits
0.32385
4328
0.219889
365
1.47280
5784
0.171
567
-
0.16608
9706
0.81379
8362
-
0.16608
9706
0.81379
8362
Requirement B.2a:
The intercept co-efficient is considered as the fixed cost in the cost function. As per the
table, the intercept co-efficient is positive and the p-value is lower than 0.05, hence the company
can be confident that the fixed cost would be greater than zero. As discussed in the previous part,
the p-value if less than 0.05, the hypothetical assumption is rejected at 95% level of significance
and here the p-value is absolutely negligible. The company can be hugely confident that the
actual fixed cost is greater than zero.
Requirement B.2b:
The variable cost per unit would be greater zero, as the visit co-efficient is positive.
However, the company can be confident enough about it as the p-value is higher than 0.05. In
Paraphrase This Document
Need a fresh take? Get an instant paraphrase of this document with our AI Paraphraser
10MANAGEMENT ACCOUNTING
this case also due to the negligible p value the conclusion is arrived at that the actual variable
cost is greater than zero. The data is also significant and helpful in concluding that the actual
variable cost is greater than zero. The p-value is basically an important statistical measure to
determine whether the assumed statistical fact is genuine or not. This measure is useful in major
company decisions related to the cost drivers as well as the several factors contributing to the
company.
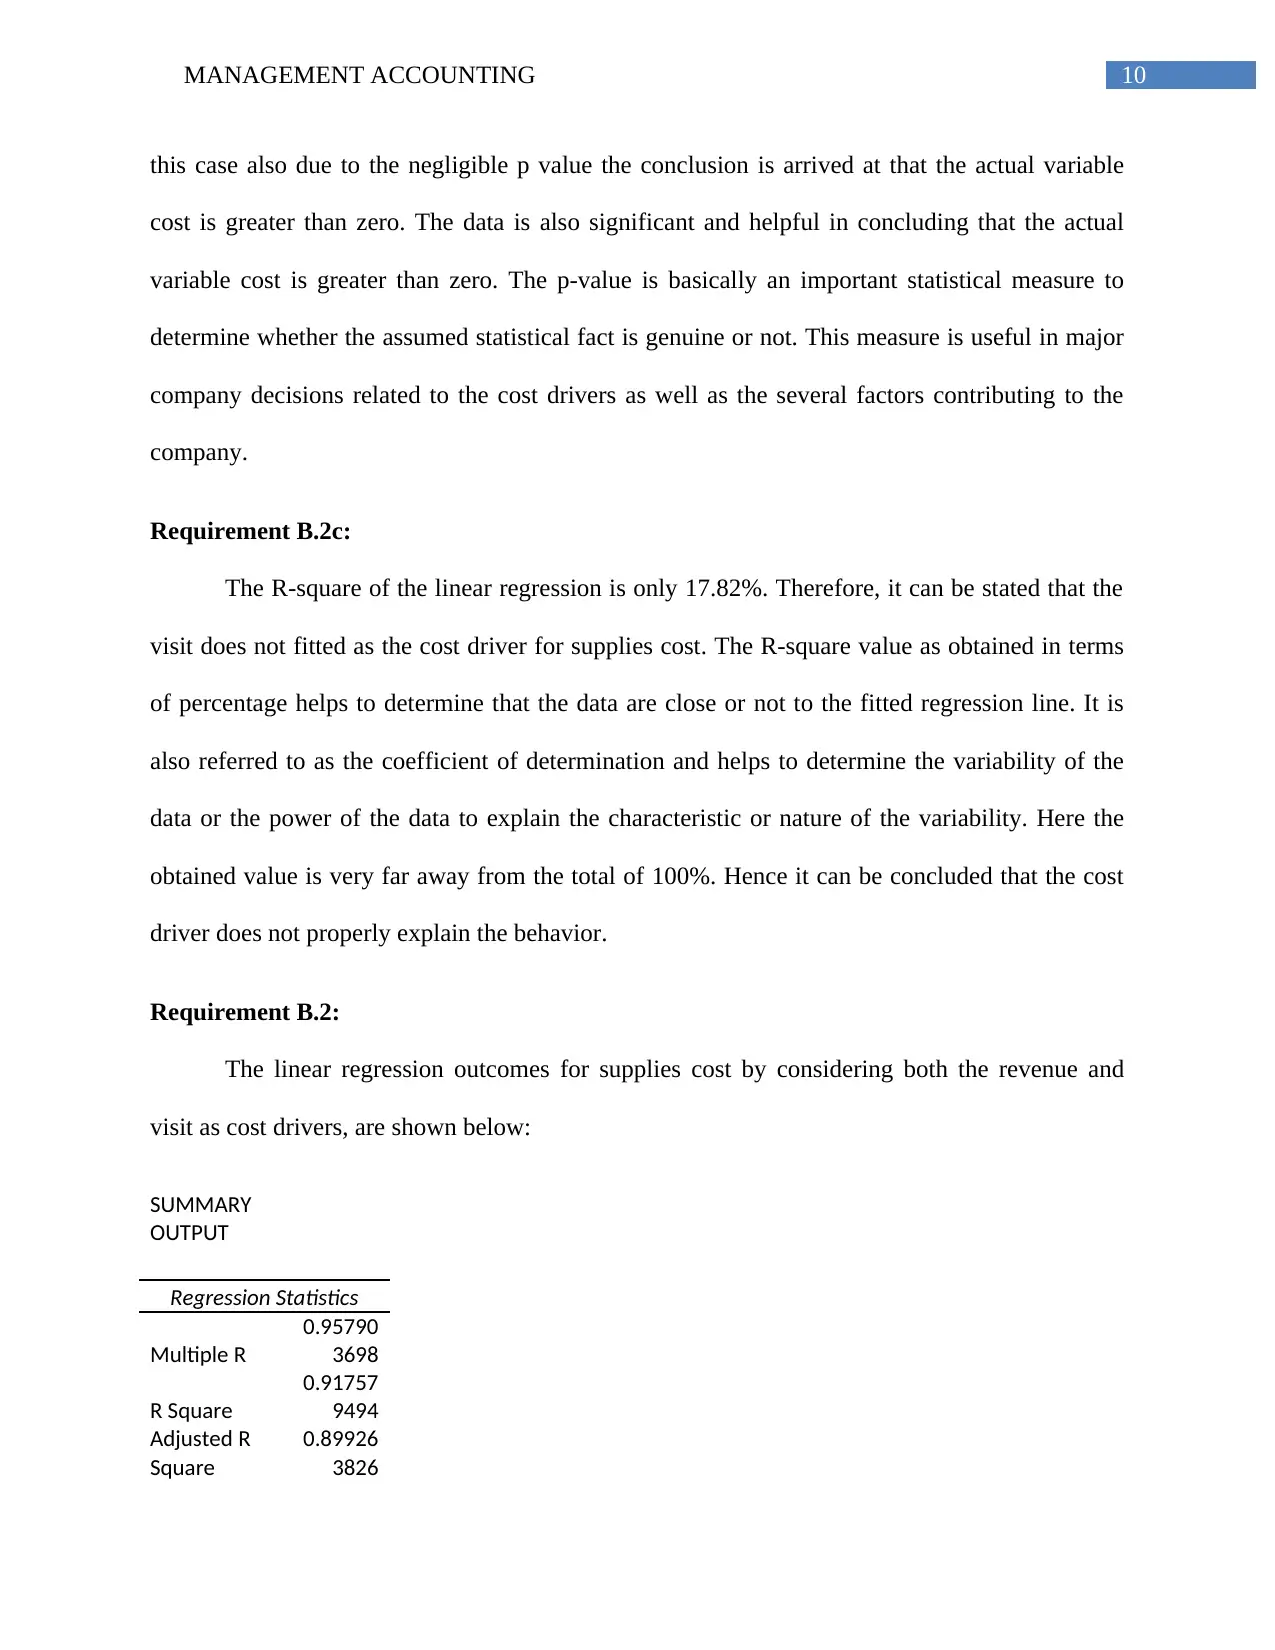
Requirement B.2c:
The R-square of the linear regression is only 17.82%. Therefore, it can be stated that the
visit does not fitted as the cost driver for supplies cost. The R-square value as obtained in terms
of percentage helps to determine that the data are close or not to the fitted regression line. It is
also referred to as the coefficient of determination and helps to determine the variability of the
data or the power of the data to explain the characteristic or nature of the variability. Here the
obtained value is very far away from the total of 100%. Hence it can be concluded that the cost
driver does not properly explain the behavior.
Requirement B.2:
The linear regression outcomes for supplies cost by considering both the revenue and
visit as cost drivers, are shown below:
SUMMARY
OUTPUT
Regression Statistics
Multiple R
0.95790
3698
R Square
0.91757
9494
Adjusted R
Square
0.89926
3826
this case also due to the negligible p value the conclusion is arrived at that the actual variable
cost is greater than zero. The data is also significant and helpful in concluding that the actual
variable cost is greater than zero. The p-value is basically an important statistical measure to
determine whether the assumed statistical fact is genuine or not. This measure is useful in major
company decisions related to the cost drivers as well as the several factors contributing to the
company.
Requirement B.2c:
The R-square of the linear regression is only 17.82%. Therefore, it can be stated that the
visit does not fitted as the cost driver for supplies cost. The R-square value as obtained in terms
of percentage helps to determine that the data are close or not to the fitted regression line. It is
also referred to as the coefficient of determination and helps to determine the variability of the
data or the power of the data to explain the characteristic or nature of the variability. Here the
obtained value is very far away from the total of 100%. Hence it can be concluded that the cost
driver does not properly explain the behavior.
Requirement B.2:
The linear regression outcomes for supplies cost by considering both the revenue and
visit as cost drivers, are shown below:
SUMMARY
OUTPUT
Regression Statistics
Multiple R
0.95790
3698
R Square
0.91757
9494
Adjusted R
Square
0.89926
3826
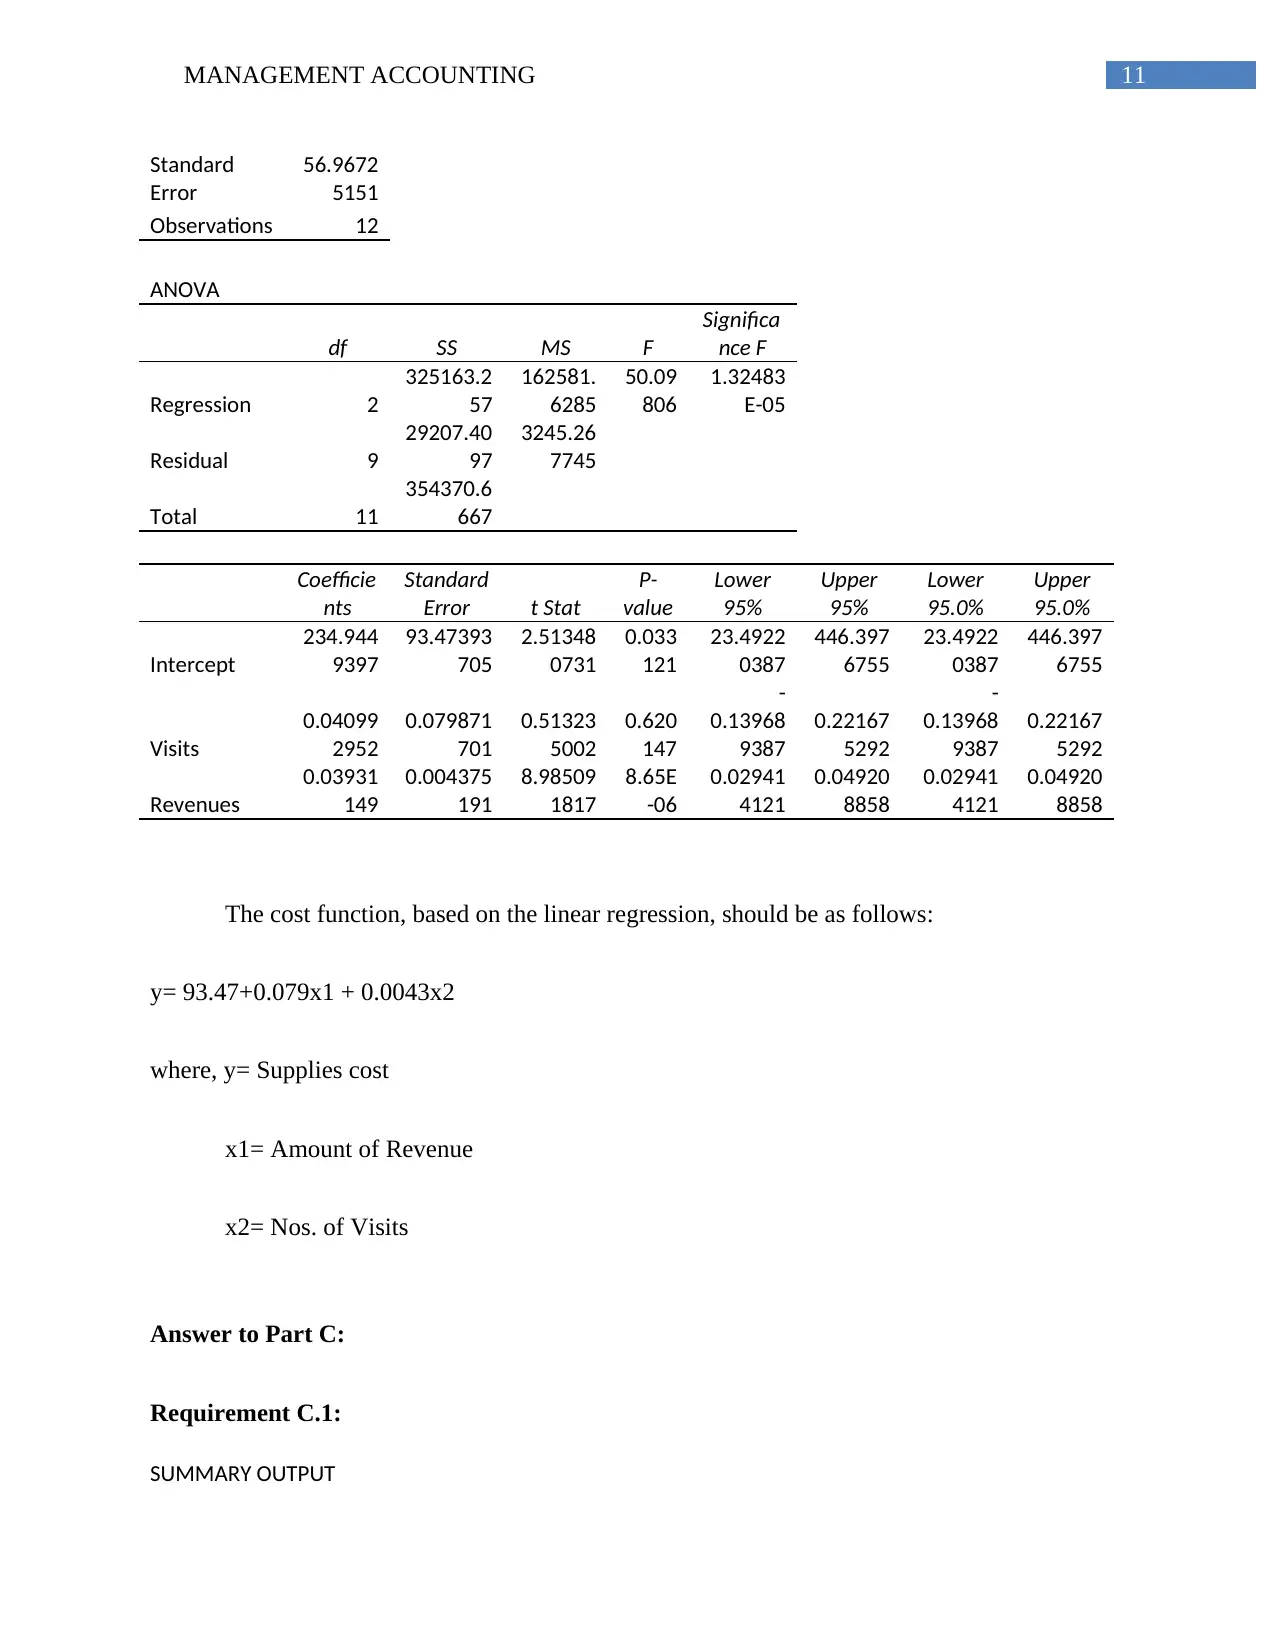
11MANAGEMENT ACCOUNTING
Standard
Error
56.9672
5151
Observations 12
ANOVA
df SS MS F
Significa
nce F
Regression 2
325163.2
57
162581.
6285
50.09
806
1.32483
E-05
Residual 9
29207.40
97
3245.26
7745
Total 11
354370.6
667
Coefficie
nts
Standard
Error t Stat
P-
value
Lower
95%
Upper
95%
Lower
95.0%
Upper
95.0%
Intercept
234.944
9397
93.47393
705
2.51348
0731
0.033
121
23.4922
0387
446.397
6755
23.4922
0387
446.397
6755
Visits
0.04099
2952
0.079871
701
0.51323
5002
0.620
147
-
0.13968
9387
0.22167
5292
-
0.13968
9387
0.22167
5292
Revenues
0.03931
149
0.004375
191
8.98509
1817
8.65E
-06
0.02941
4121
0.04920
8858
0.02941
4121
0.04920
8858
The cost function, based on the linear regression, should be as follows:
y= 93.47+0.079x1 + 0.0043x2
where, y= Supplies cost
x1= Amount of Revenue
x2= Nos. of Visits
Answer to Part C:
Requirement C.1:
SUMMARY OUTPUT
Standard
Error
56.9672
5151
Observations 12
ANOVA
df SS MS F
Significa
nce F
Regression 2
325163.2
57
162581.
6285
50.09
806
1.32483
E-05
Residual 9
29207.40
97
3245.26
7745
Total 11
354370.6
667
Coefficie
nts
Standard
Error t Stat
P-
value
Lower
95%
Upper
95%
Lower
95.0%
Upper
95.0%
Intercept
234.944
9397
93.47393
705
2.51348
0731
0.033
121
23.4922
0387
446.397
6755
23.4922
0387
446.397
6755
Visits
0.04099
2952
0.079871
701
0.51323
5002
0.620
147
-
0.13968
9387
0.22167
5292
-
0.13968
9387
0.22167
5292
Revenues
0.03931
149
0.004375
191
8.98509
1817
8.65E
-06
0.02941
4121
0.04920
8858
0.02941
4121
0.04920
8858
The cost function, based on the linear regression, should be as follows:
y= 93.47+0.079x1 + 0.0043x2
where, y= Supplies cost
x1= Amount of Revenue
x2= Nos. of Visits
Answer to Part C:
Requirement C.1:
SUMMARY OUTPUT
⊘ This is a preview!⊘
Do you want full access?
Subscribe today to unlock all pages.
Trusted by 1+ million students worldwide
1 out of 18


Your All-in-One AI-Powered Toolkit for Academic Success.
+13062052269
info@desklib.com
Available 24*7 on WhatsApp / Email
![[object Object]](/_next/static/media/star-bottom.7253800d.svg)
Unlock your academic potential
Copyright © 2020–2026 A2Z Services. All Rights Reserved. Developed and managed by ZUCOL.