Detailed Analysis: Management Accounting Assignment Solution

Verified

Added on  2020/02/19

|15
|1606
|44
Homework Assignment
AI Summary
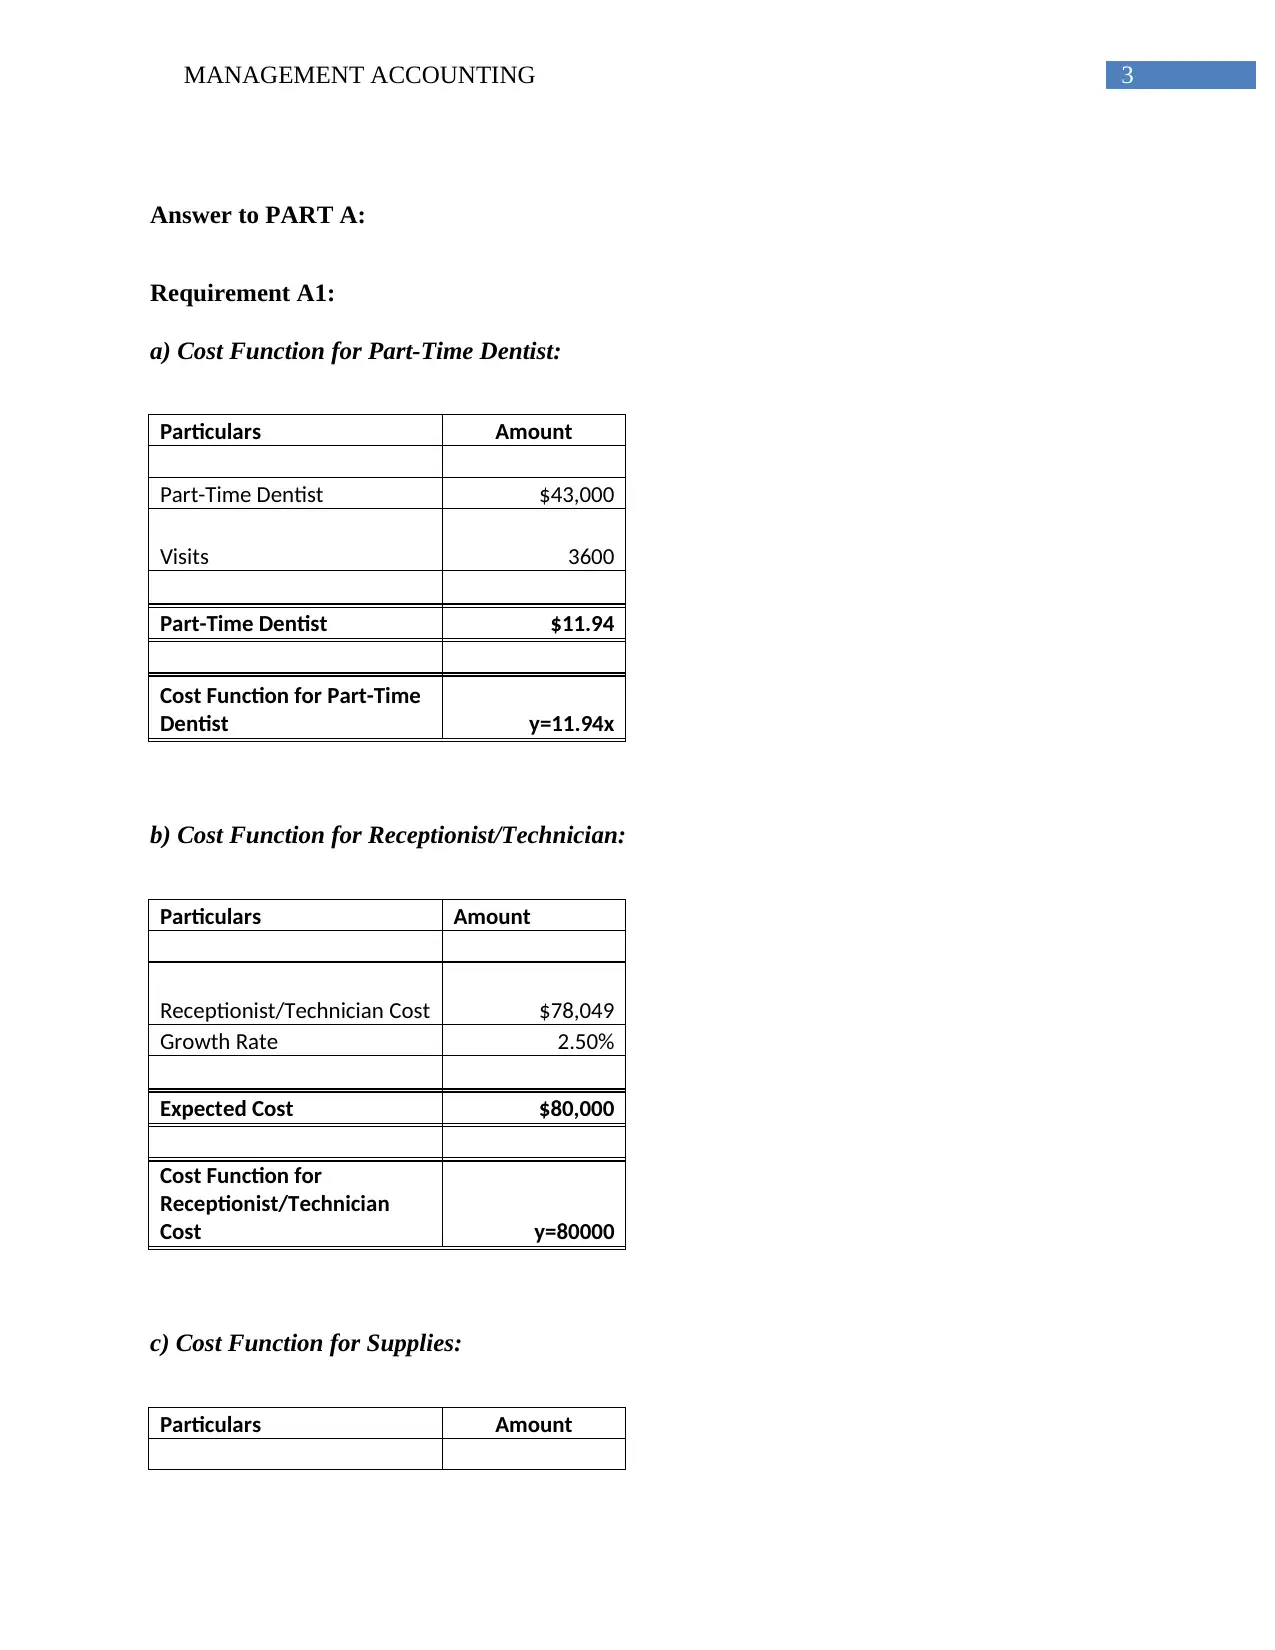
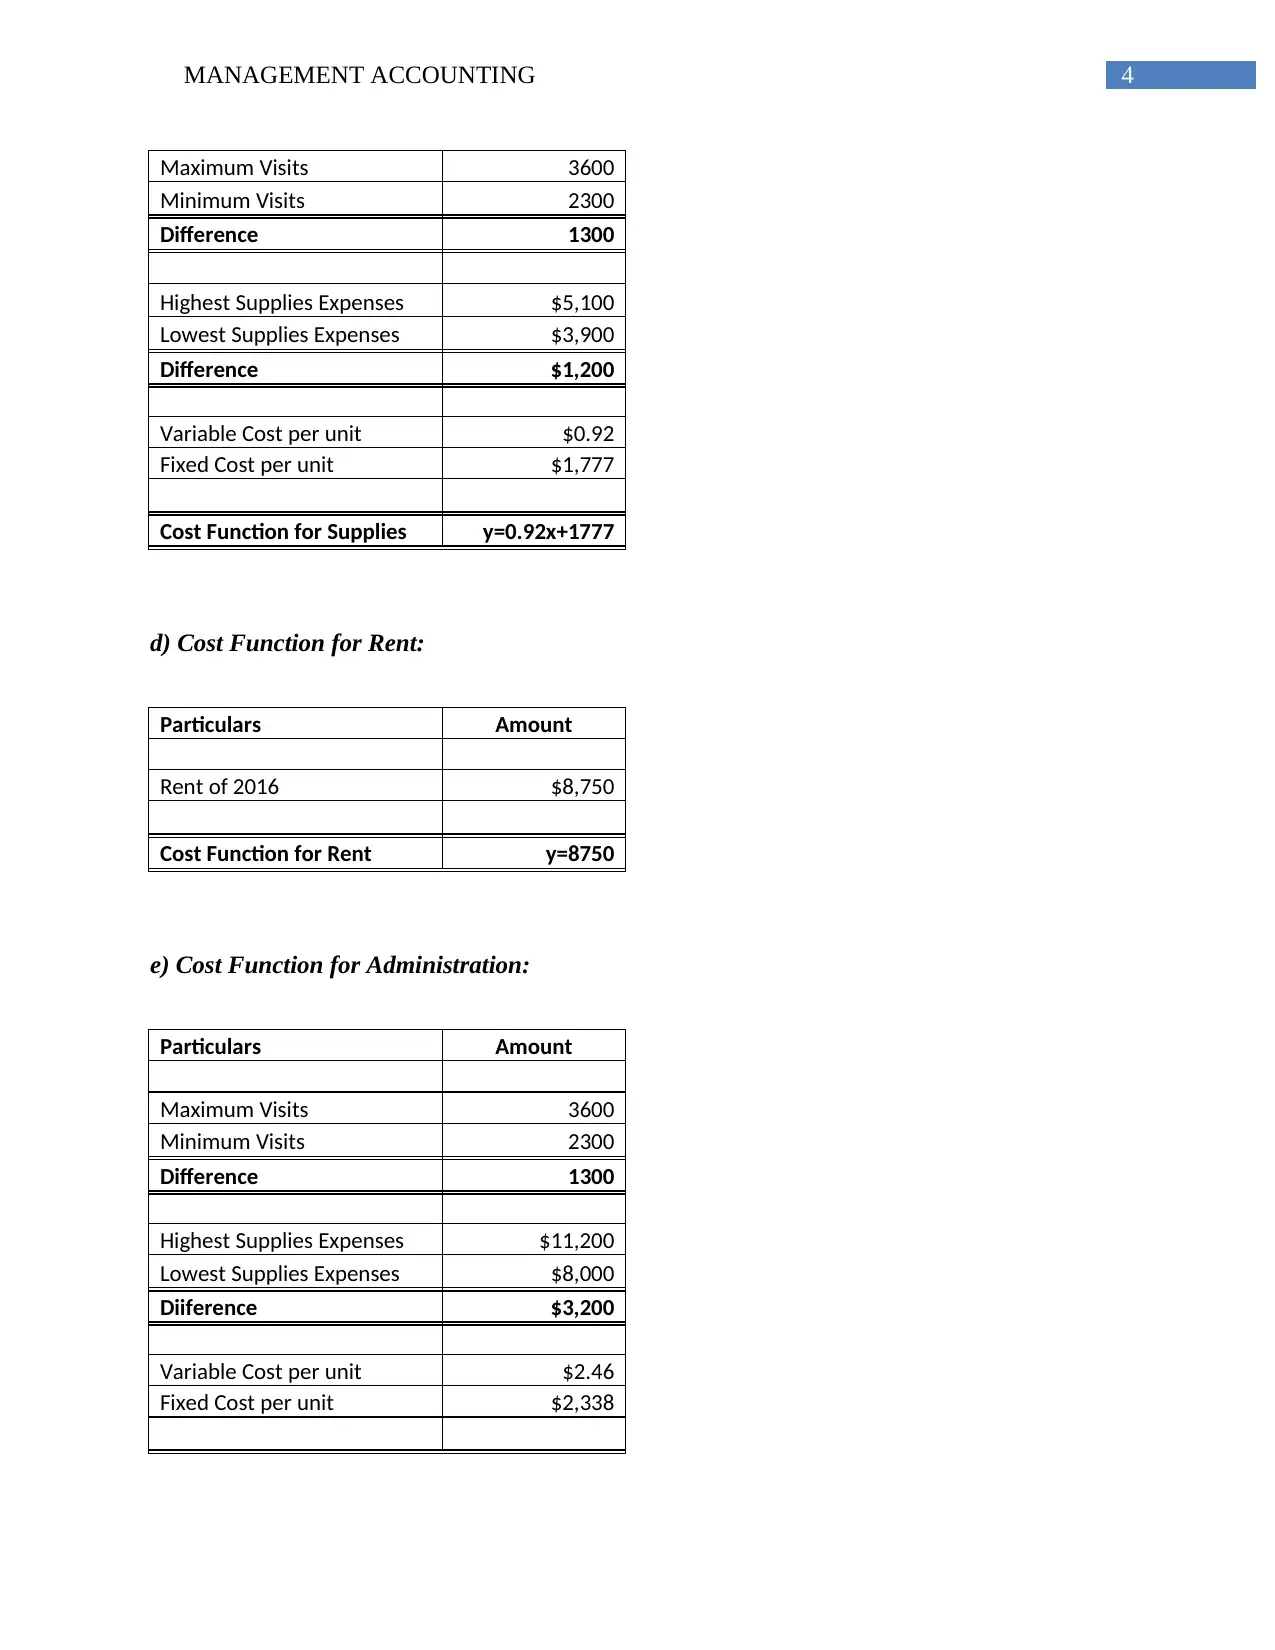
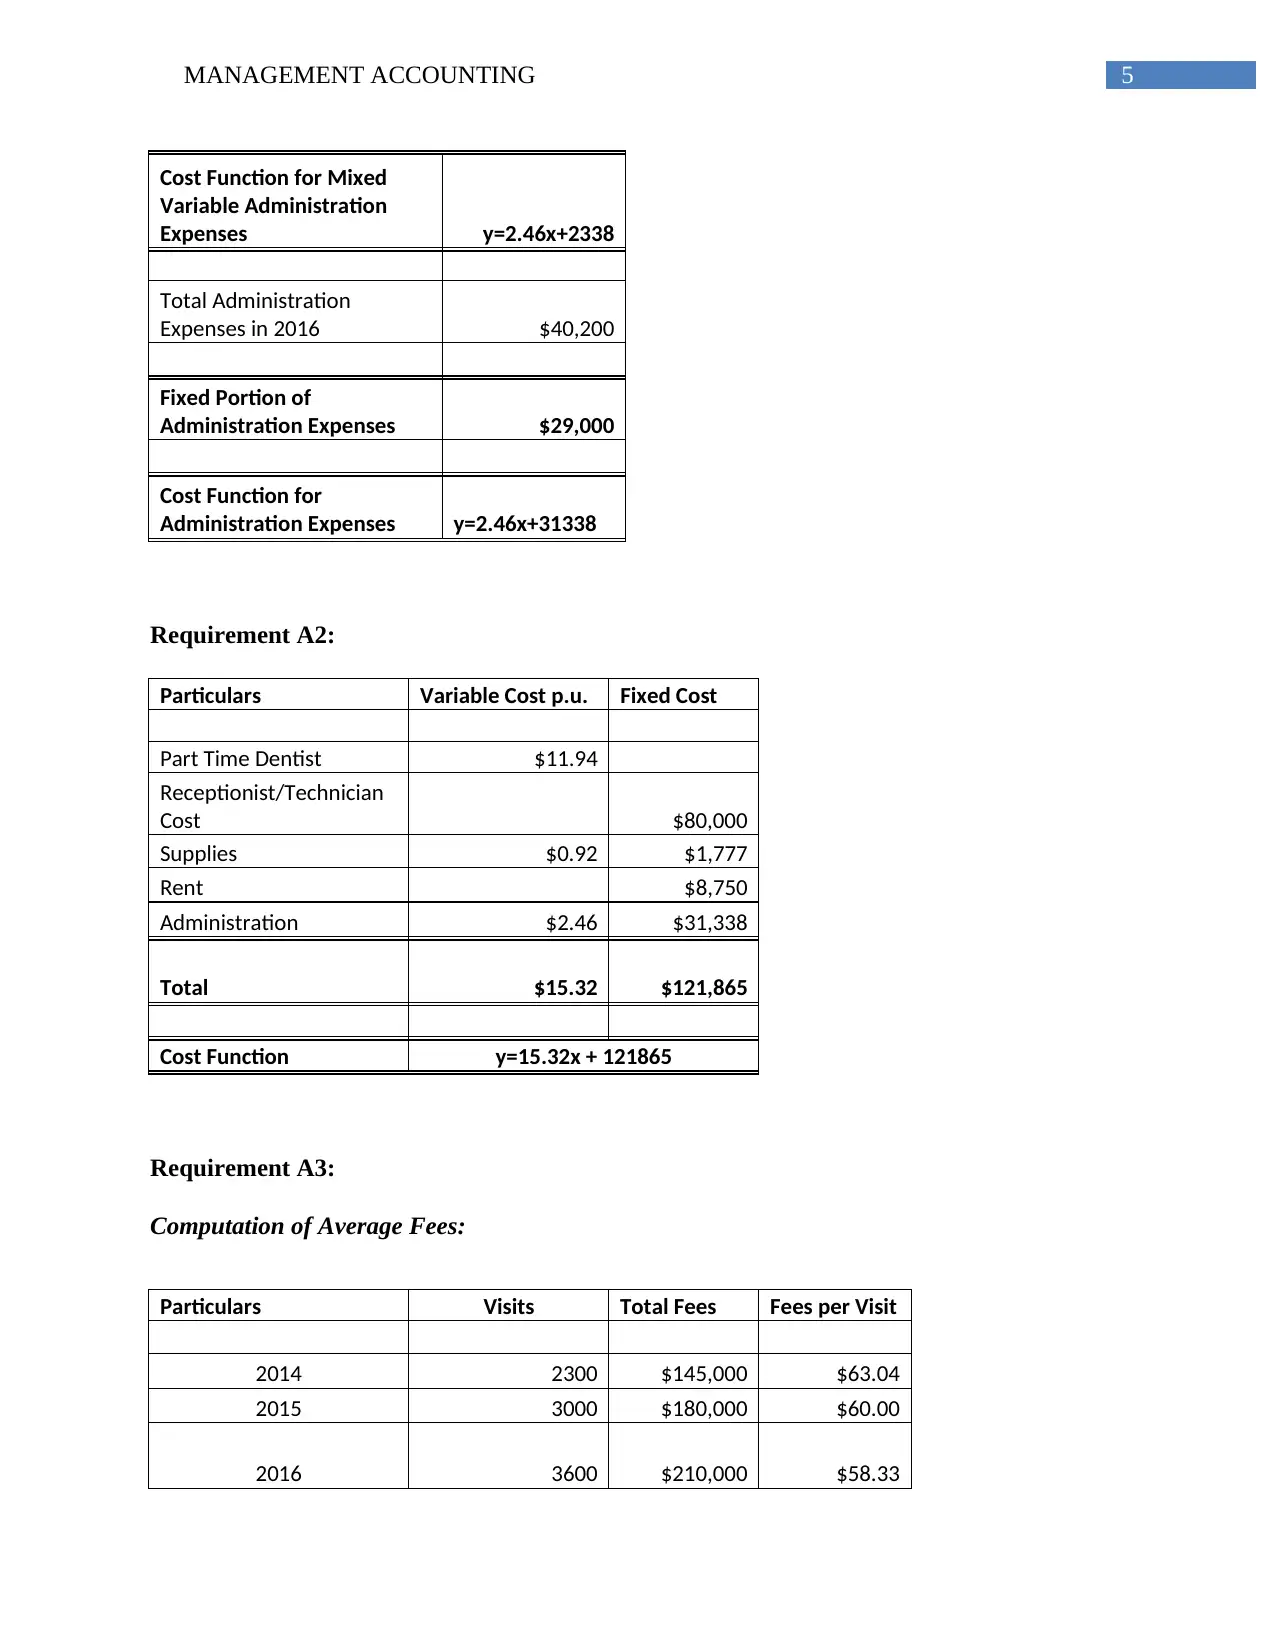
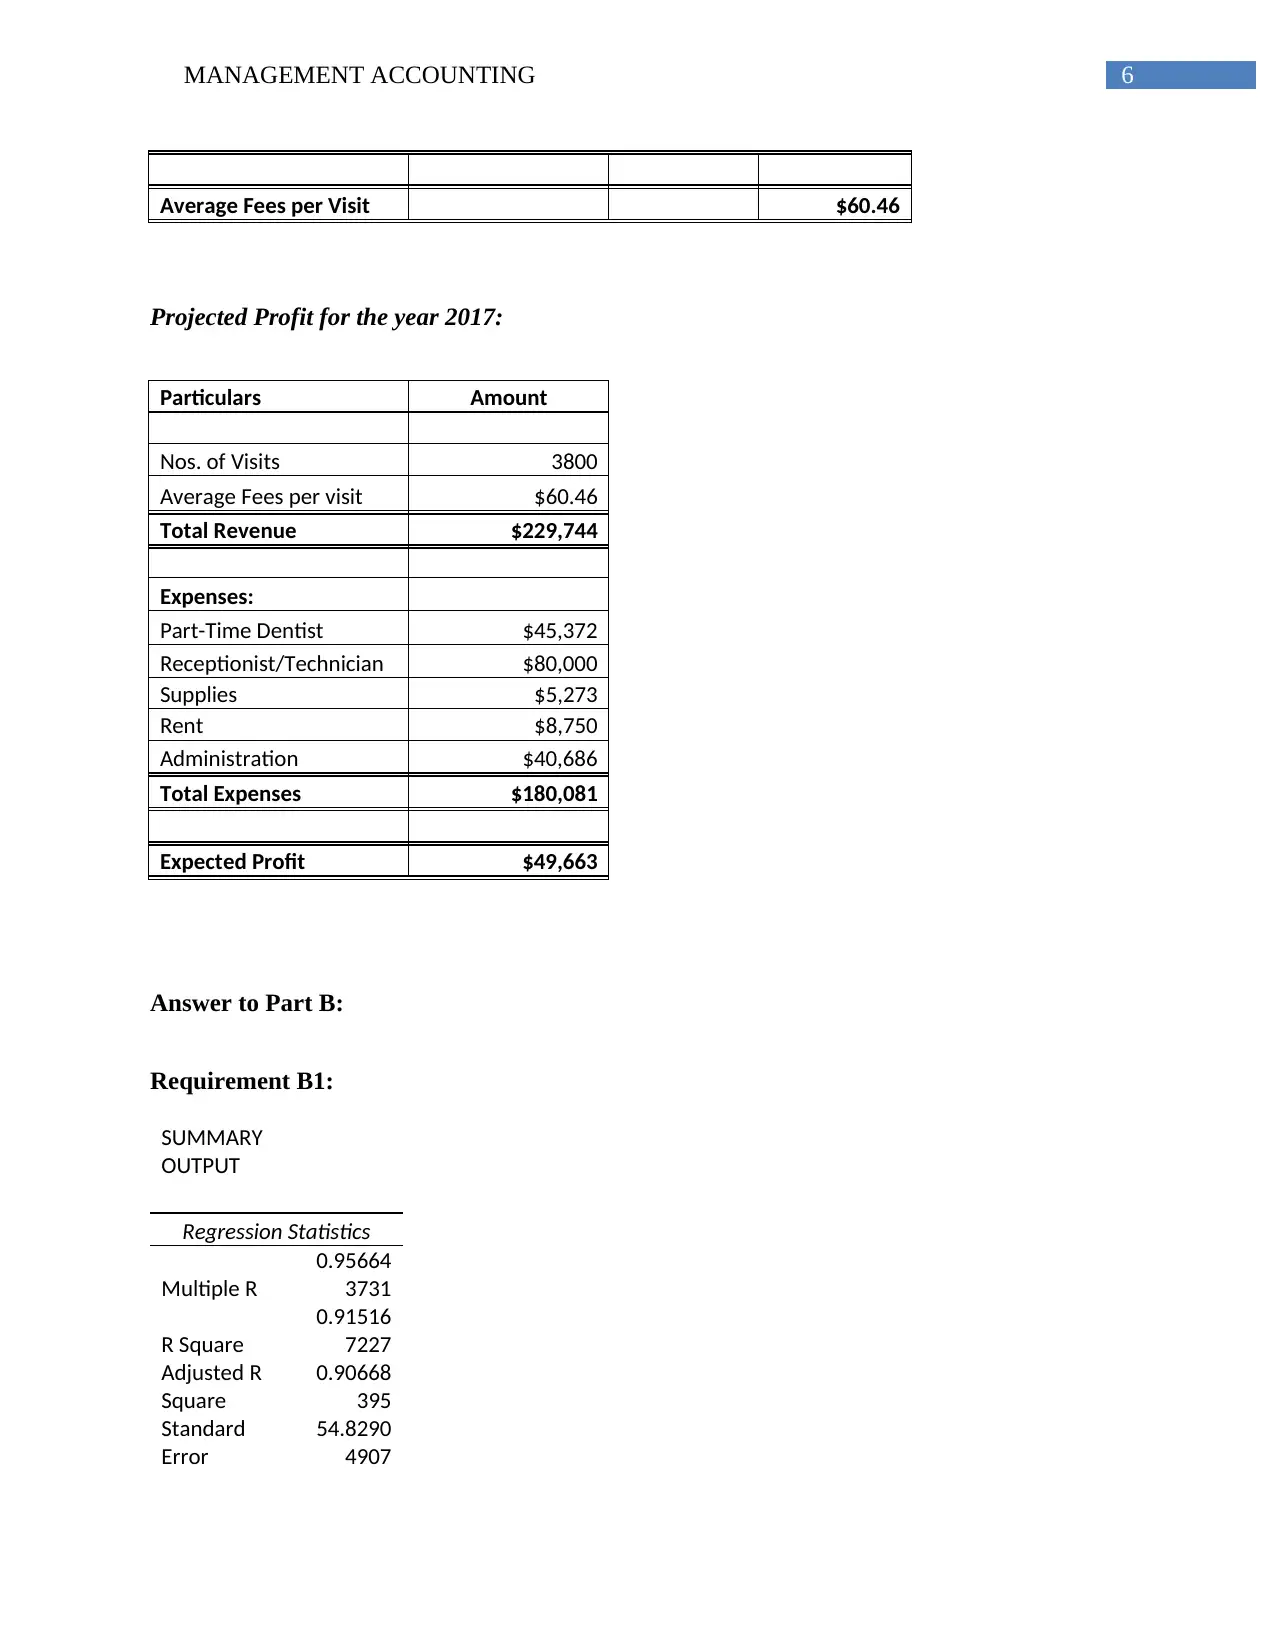
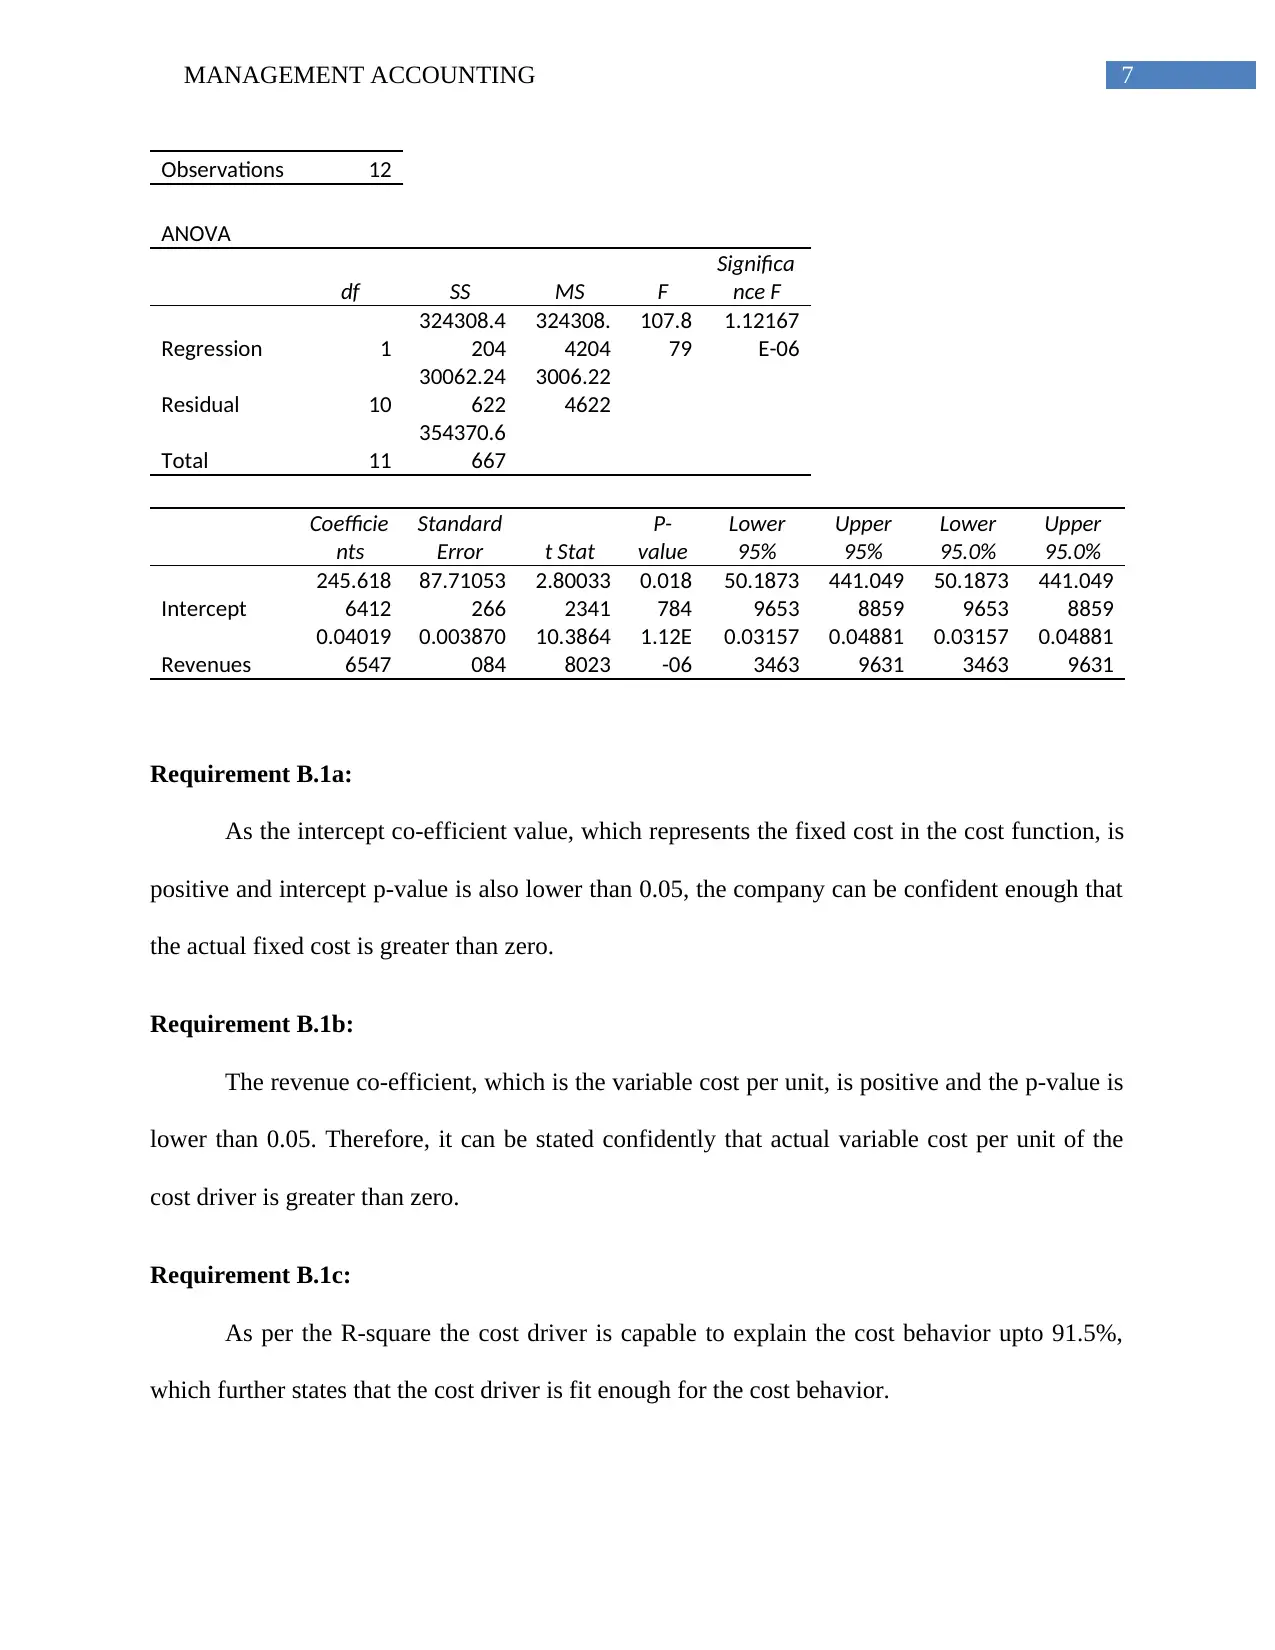
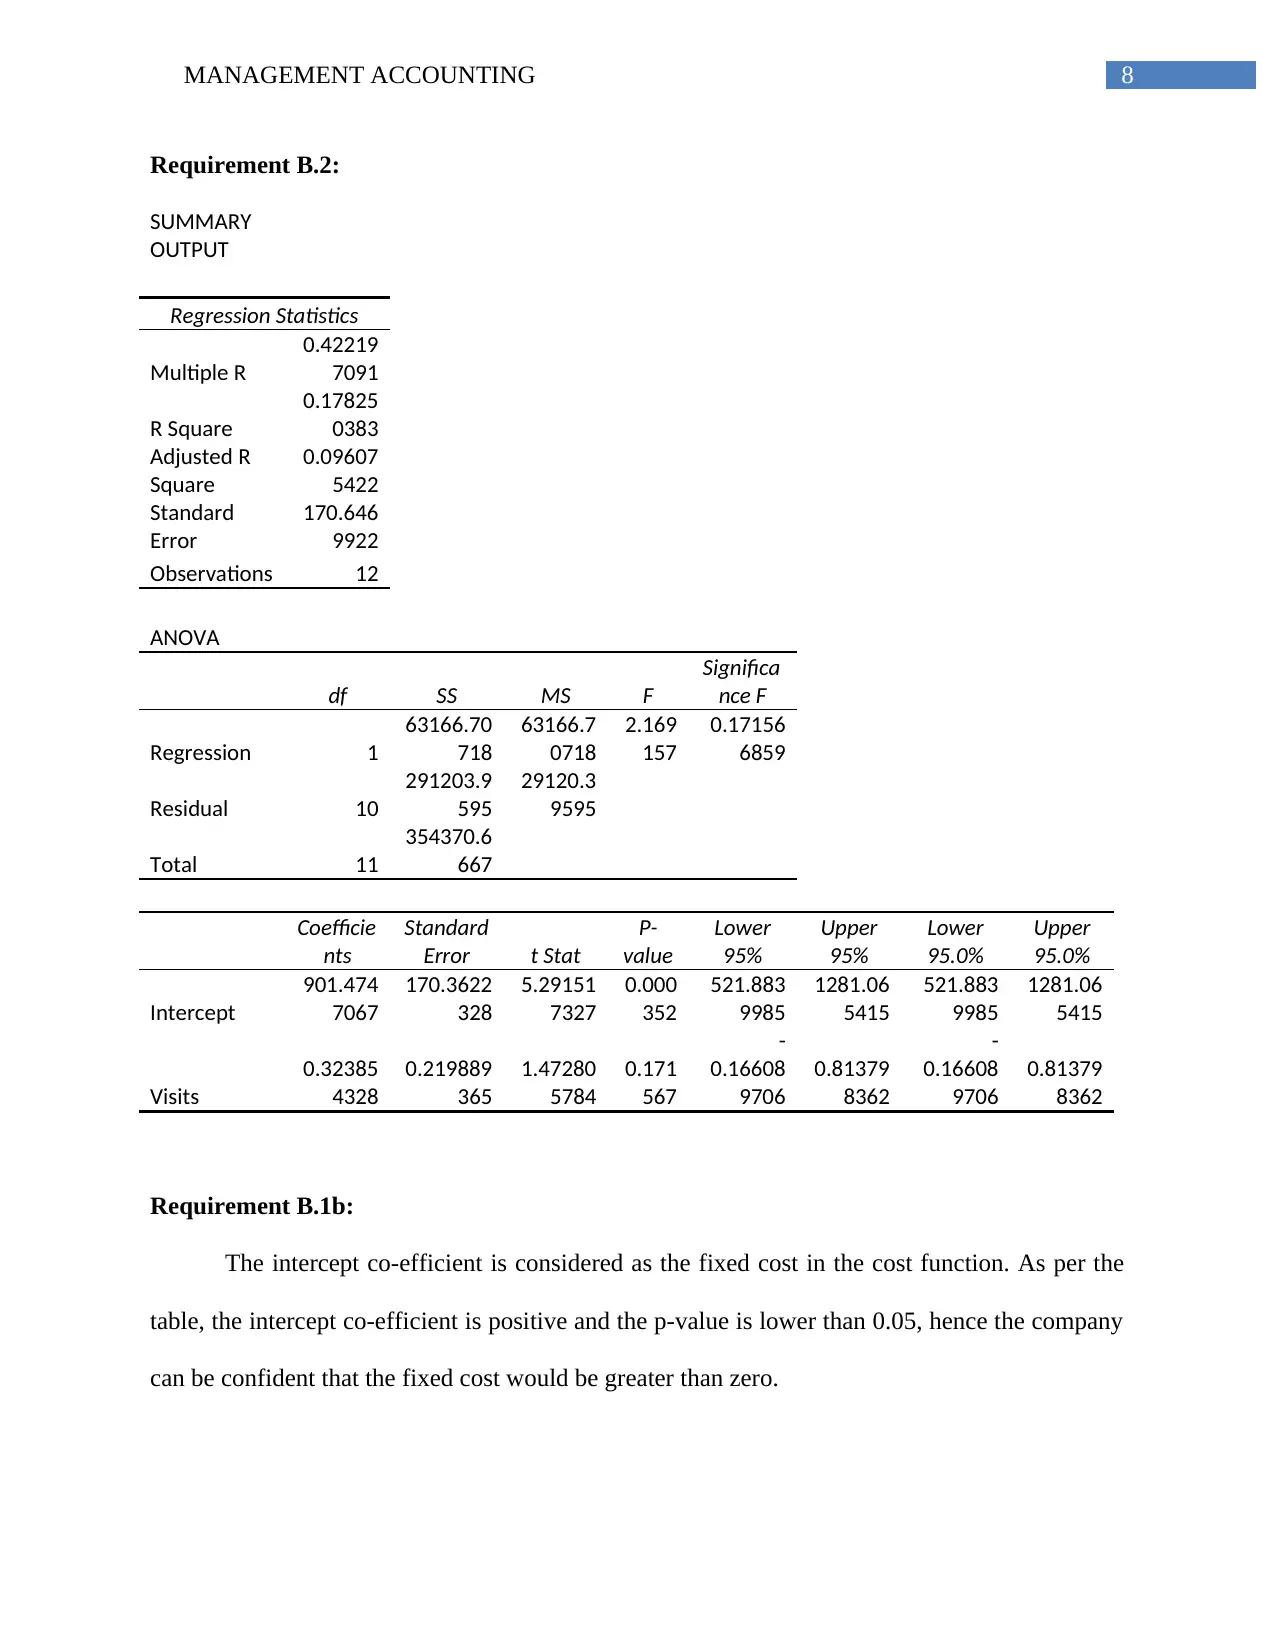
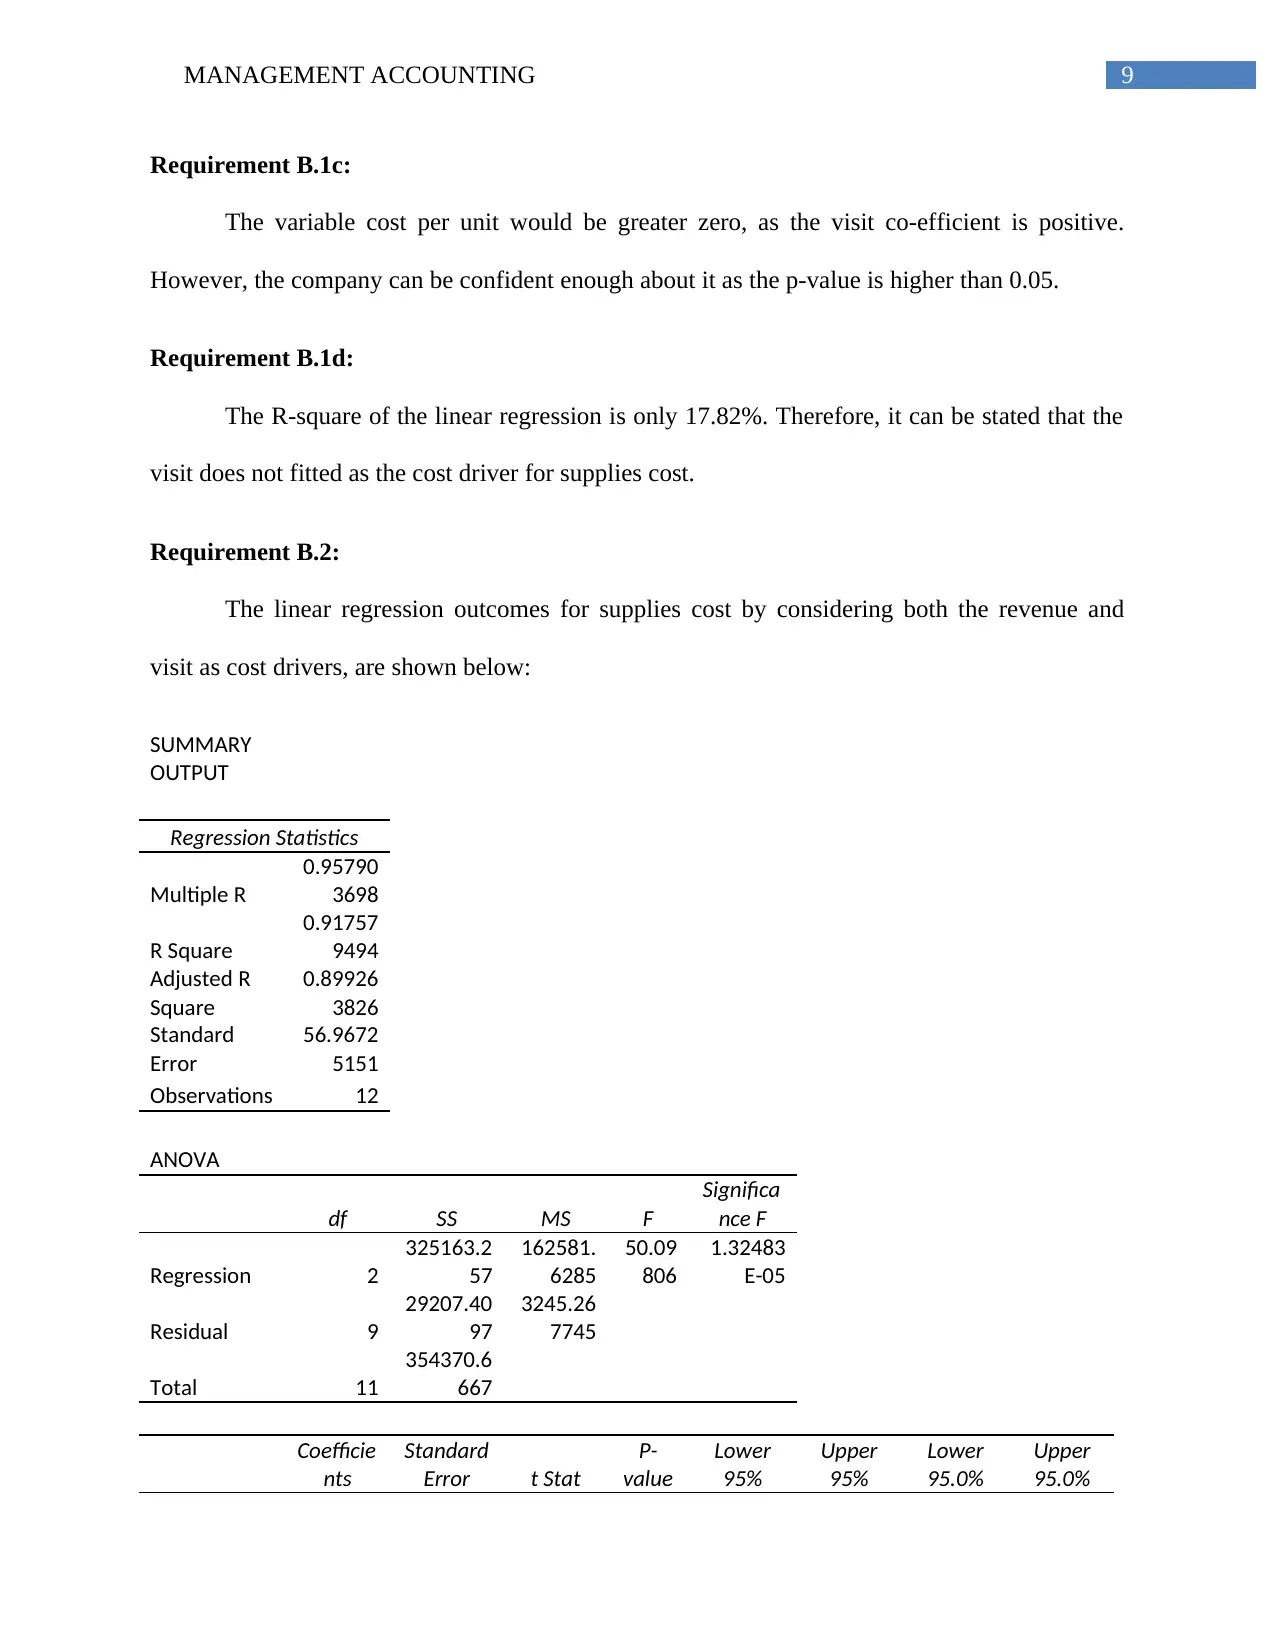
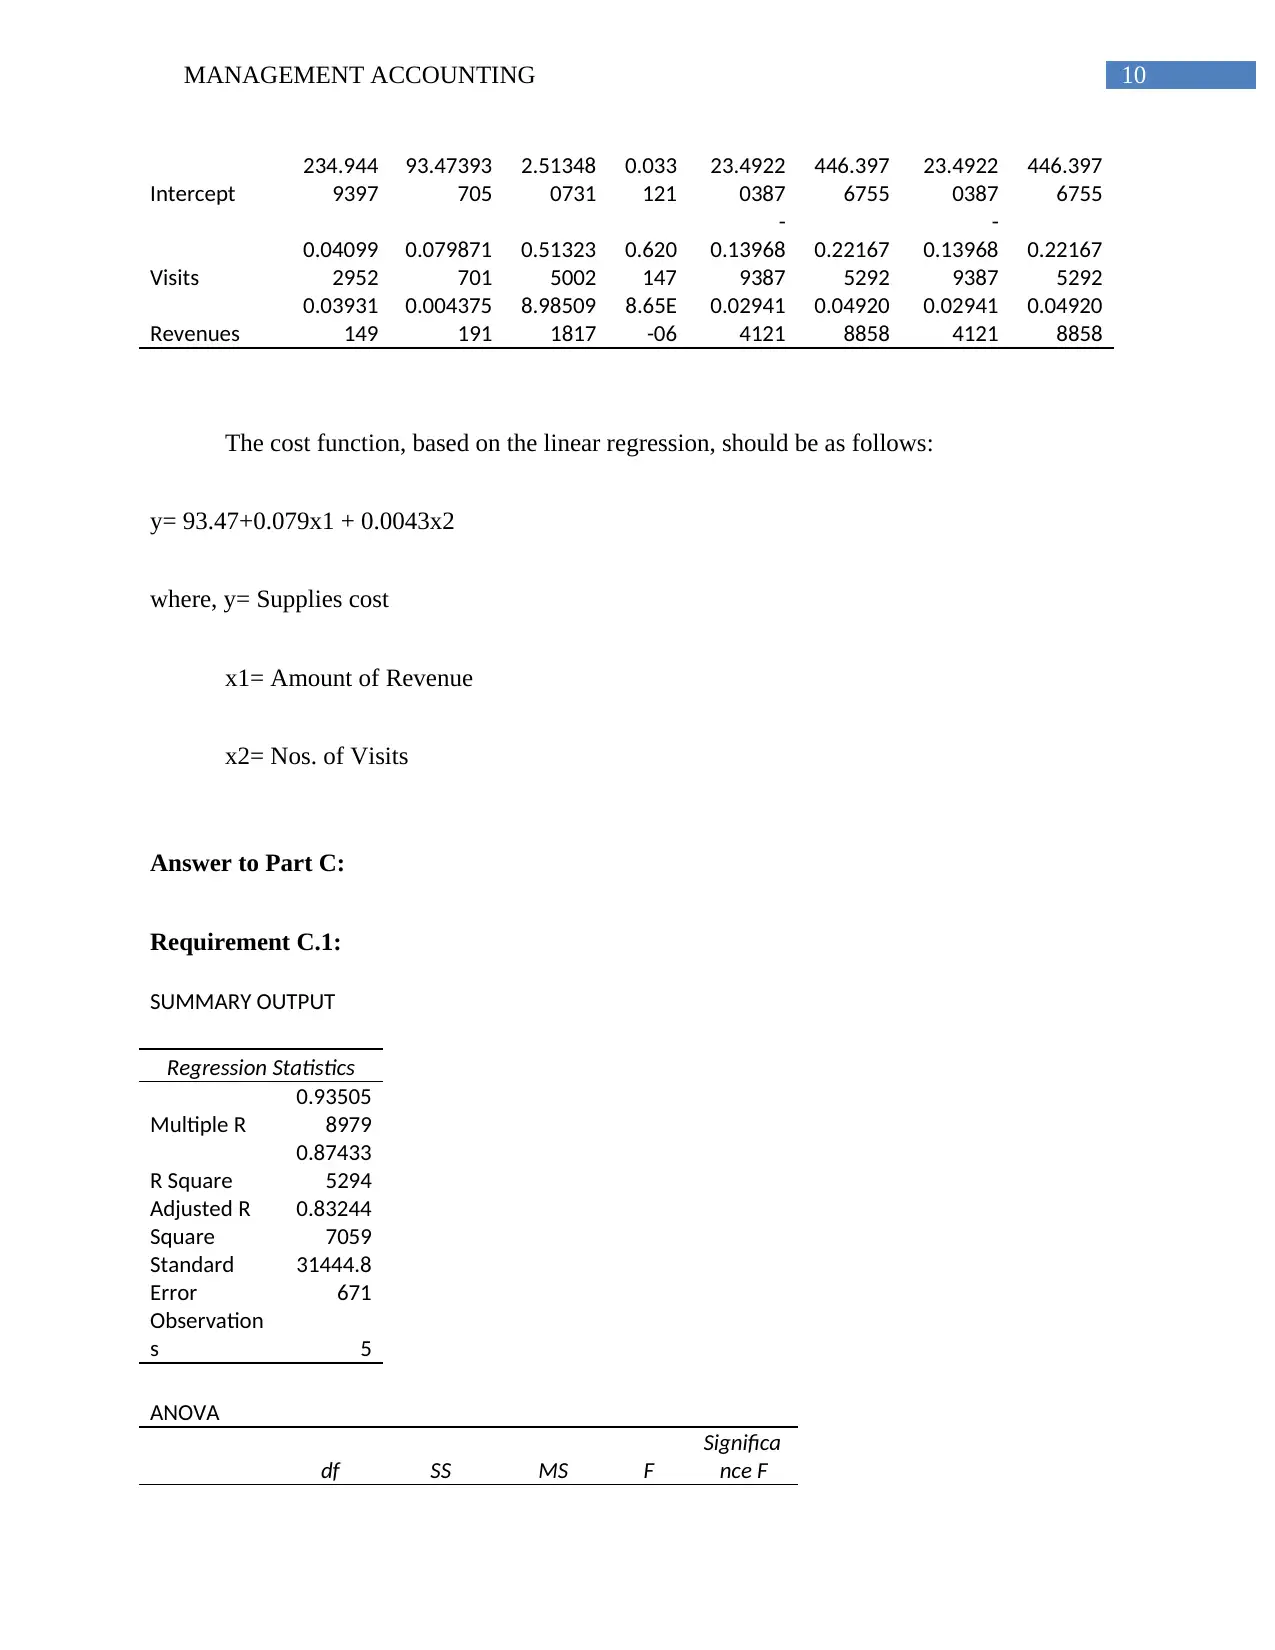
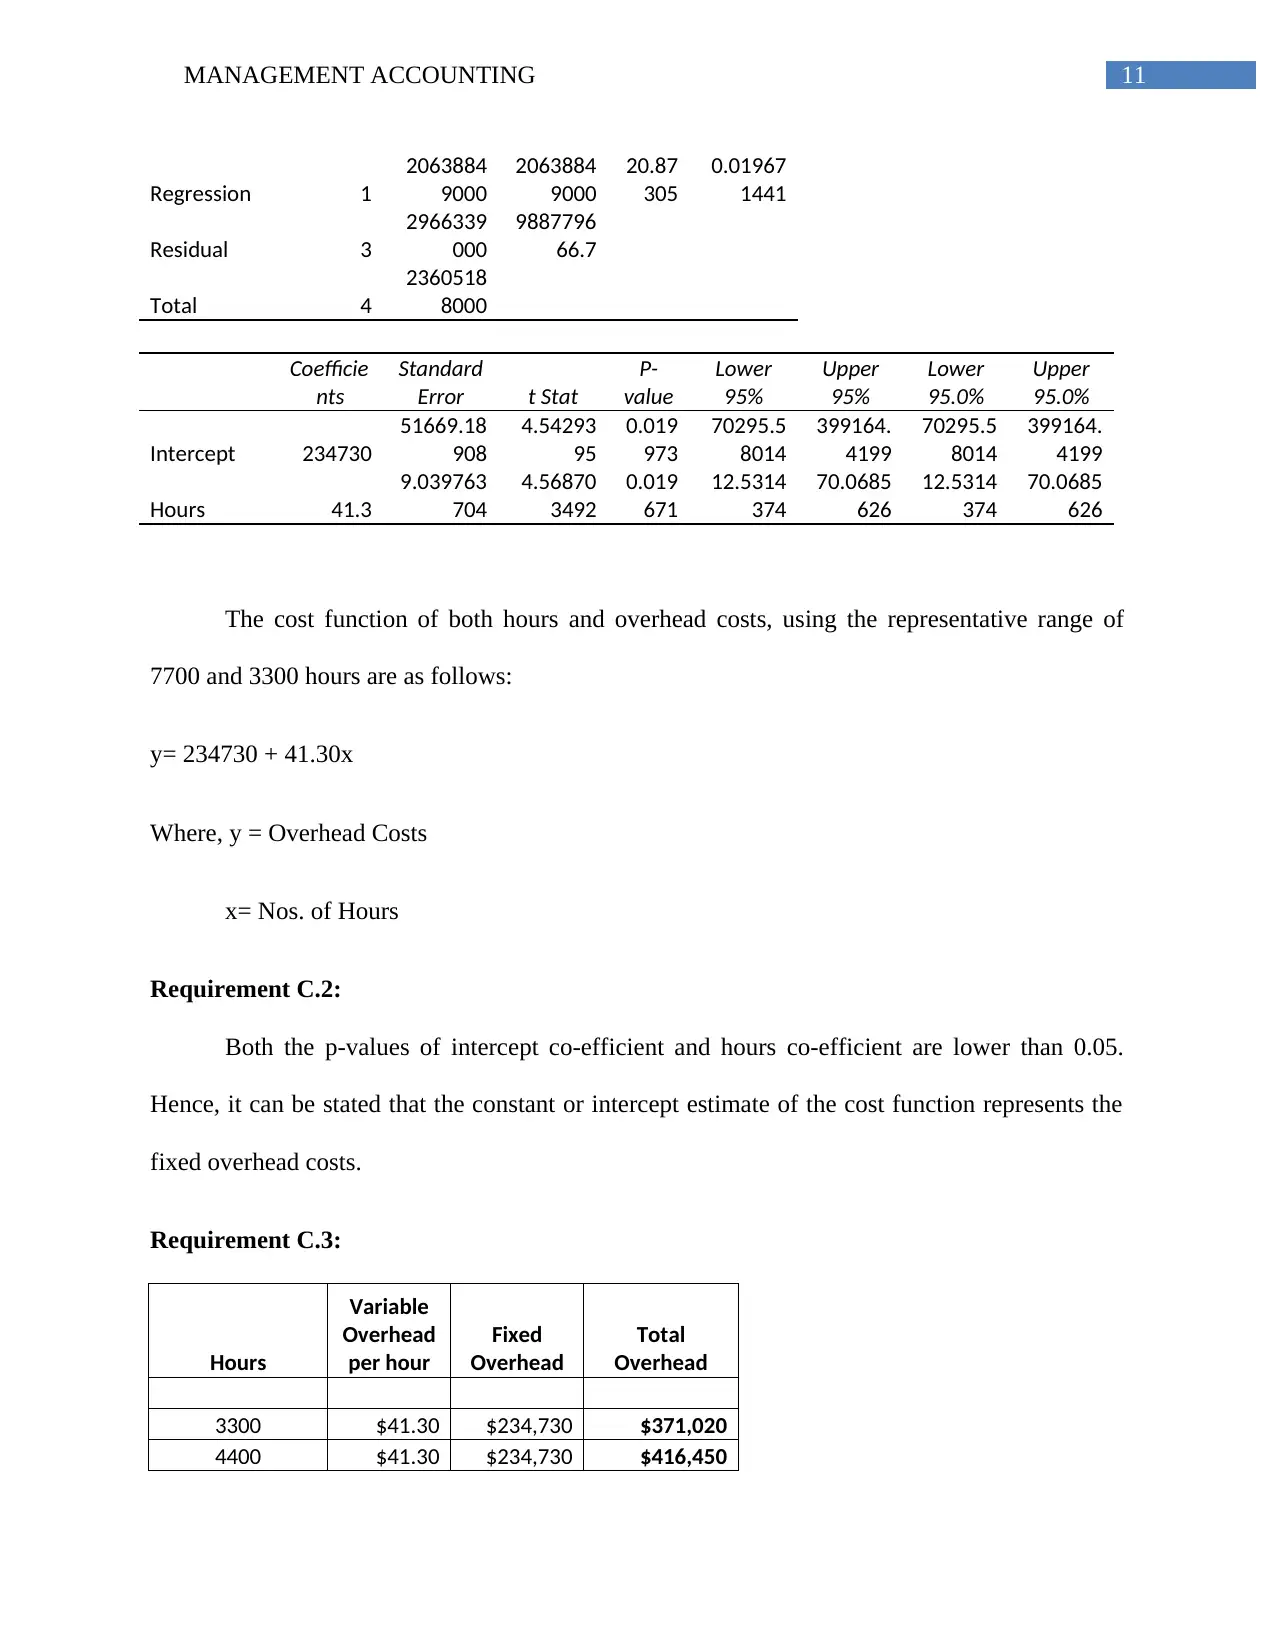
This document presents a comprehensive solution to a management accounting assignment, covering various aspects of financial analysis. The solution begins with Part A, which focuses on cost function analysis for different cost components like part-time dentists, receptionists/technicians, supplies, rent, and administration. Part B delves into regression analysis, examining the relationship between revenue and cost drivers, and assessing the goodness of fit using R-squared values. Part C addresses overhead cost analysis, developing a cost function based on hours and calculating predicted overhead costs. Finally, Part D introduces probability concepts using tree diagrams and the counting principle to determine meal preferences. The assignment utilizes various statistical techniques and financial modeling to provide a detailed understanding of accounting principles and their applications.
Document Page
Running head: MANAGEMENT ACCOUNTING
Management Accounting
Name of the Student:
Name of the University:
Author’s Note:
tabler-icon-diamond-filled.svg

Paraphrase This Document

Need a fresh take? Get an instant paraphrase of this document with our AI Paraphraser
Document Page
1MANAGEMENT ACCOUNTING
Table of Contents
Answer to PART A:.........................................................................................................................3
Requirement A1:..........................................................................................................................3
Requirement A2:..........................................................................................................................5
Requirement A3:..........................................................................................................................5
Answer to Part B:.............................................................................................................................6
Requirement B1:..........................................................................................................................6
Requirement B.1a:.......................................................................................................................7
Requirement B.1b:.......................................................................................................................7
Requirement B.1c:.......................................................................................................................7
Requirement B.2:.........................................................................................................................8
Requirement B.1b:.......................................................................................................................8
Requirement B.1c:.......................................................................................................................9
Requirement B.1d:.......................................................................................................................9
Requirement B.2:.........................................................................................................................9
Answer to Part C:...........................................................................................................................10
Requirement C.1:.......................................................................................................................10
Requirement C.2:.......................................................................................................................11
Requirement C.3:.......................................................................................................................11
Requirement C.4:.......................................................................................................................12
Document Page
2MANAGEMENT ACCOUNTING
Answer to Part D:..........................................................................................................................12
Bibliography:.................................................................................................................................14
Document Page
3MANAGEMENT ACCOUNTING
Answer to PART A:
Requirement A1:
a) Cost Function for Part-Time Dentist:
Particulars Amount
Part-Time Dentist $43,000
Visits 3600
Part-Time Dentist $11.94
Cost Function for Part-Time
Dentist y=11.94x
b) Cost Function for Receptionist/Technician:
Particulars Amount
Receptionist/Technician Cost $78,049
Growth Rate 2.50%
Expected Cost $80,000
Cost Function for
Receptionist/Technician
Cost y=80000
c) Cost Function for Supplies:
Particulars Amount
tabler-icon-diamond-filled.svg

Paraphrase This Document

Need a fresh take? Get an instant paraphrase of this document with our AI Paraphraser
Document Page
4MANAGEMENT ACCOUNTING
Maximum Visits 3600
Minimum Visits 2300
Difference 1300
Highest Supplies Expenses $5,100
Lowest Supplies Expenses $3,900
Difference $1,200
Variable Cost per unit $0.92
Fixed Cost per unit $1,777
Cost Function for Supplies y=0.92x+1777
d) Cost Function for Rent:
Particulars Amount
Rent of 2016 $8,750
Cost Function for Rent y=8750
e) Cost Function for Administration:
Particulars Amount
Maximum Visits 3600
Minimum Visits 2300
Difference 1300
Highest Supplies Expenses $11,200
Lowest Supplies Expenses $8,000
Diiference $3,200
Variable Cost per unit $2.46
Fixed Cost per unit $2,338
Document Page
5MANAGEMENT ACCOUNTING
Cost Function for Mixed
Variable Administration
Expenses y=2.46x+2338
Total Administration
Expenses in 2016 $40,200
Fixed Portion of
Administration Expenses $29,000
Cost Function for
Administration Expenses y=2.46x+31338
Requirement A2:
Particulars Variable Cost p.u. Fixed Cost
Part Time Dentist $11.94
Receptionist/Technician
Cost $80,000
Supplies $0.92 $1,777
Rent $8,750
Administration $2.46 $31,338
Total $15.32 $121,865
Cost Function y=15.32x + 121865
Requirement A3:
Computation of Average Fees:
Particulars Visits Total Fees Fees per Visit
2014 2300 $145,000 $63.04
2015 3000 $180,000 $60.00
2016 3600 $210,000 $58.33
Document Page
6MANAGEMENT ACCOUNTING
Average Fees per Visit $60.46
Projected Profit for the year 2017:
Particulars Amount
Nos. of Visits 3800
Average Fees per visit $60.46
Total Revenue $229,744
Expenses:
Part-Time Dentist $45,372
Receptionist/Technician $80,000
Supplies $5,273
Rent $8,750
Administration $40,686
Total Expenses $180,081
Expected Profit $49,663
Answer to Part B:
Requirement B1:
SUMMARY
OUTPUT
Regression Statistics
Multiple R
0.95664
3731
R Square
0.91516
7227
Adjusted R
Square
0.90668
395
Standard
Error
54.8290
4907
tabler-icon-diamond-filled.svg

Paraphrase This Document

Need a fresh take? Get an instant paraphrase of this document with our AI Paraphraser
Document Page
7MANAGEMENT ACCOUNTING
Observations 12
ANOVA
df SS MS F
Significa
nce F
Regression 1
324308.4
204
324308.
4204
107.8
79
1.12167
E-06
Residual 10
30062.24
622
3006.22
4622
Total 11
354370.6
667
Coefficie
nts
Standard
Error t Stat
P-
value
Lower
95%
Upper
95%
Lower
95.0%
Upper
95.0%
Intercept
245.618
6412
87.71053
266
2.80033
2341
0.018
784
50.1873
9653
441.049
8859
50.1873
9653
441.049
8859
Revenues
0.04019
6547
0.003870
084
10.3864
8023
1.12E
-06
0.03157
3463
0.04881
9631
0.03157
3463
0.04881
9631
Requirement B.1a:
As the intercept co-efficient value, which represents the fixed cost in the cost function, is
positive and intercept p-value is also lower than 0.05, the company can be confident enough that
the actual fixed cost is greater than zero.
Requirement B.1b:
The revenue co-efficient, which is the variable cost per unit, is positive and the p-value is
lower than 0.05. Therefore, it can be stated confidently that actual variable cost per unit of the
cost driver is greater than zero.
Requirement B.1c:
As per the R-square the cost driver is capable to explain the cost behavior upto 91.5%,
which further states that the cost driver is fit enough for the cost behavior.
Document Page
8MANAGEMENT ACCOUNTING
Requirement B.2:
SUMMARY
OUTPUT
Regression Statistics
Multiple R
0.42219
7091
R Square
0.17825
0383
Adjusted R
Square
0.09607
5422
Standard
Error
170.646
9922
Observations 12
ANOVA
df SS MS F
Significa
nce F
Regression 1
63166.70
718
63166.7
0718
2.169
157
0.17156
6859
Residual 10
291203.9
595
29120.3
9595
Total 11
354370.6
667
Coefficie
nts
Standard
Error t Stat
P-
value
Lower
95%
Upper
95%
Lower
95.0%
Upper
95.0%
Intercept
901.474
7067
170.3622
328
5.29151
7327
0.000
352
521.883
9985
1281.06
5415
521.883
9985
1281.06
5415
Visits
0.32385
4328
0.219889
365
1.47280
5784
0.171
567
-
0.16608
9706
0.81379
8362
-
0.16608
9706
0.81379
8362
Requirement B.1b:
The intercept co-efficient is considered as the fixed cost in the cost function. As per the
table, the intercept co-efficient is positive and the p-value is lower than 0.05, hence the company
can be confident that the fixed cost would be greater than zero.
Document Page
9MANAGEMENT ACCOUNTING
Requirement B.1c:
The variable cost per unit would be greater zero, as the visit co-efficient is positive.
However, the company can be confident enough about it as the p-value is higher than 0.05.
Requirement B.1d:
The R-square of the linear regression is only 17.82%. Therefore, it can be stated that the
visit does not fitted as the cost driver for supplies cost.
Requirement B.2:
The linear regression outcomes for supplies cost by considering both the revenue and
visit as cost drivers, are shown below:
SUMMARY
OUTPUT
Regression Statistics
Multiple R
0.95790
3698
R Square
0.91757
9494
Adjusted R
Square
0.89926
3826
Standard
Error
56.9672
5151
Observations 12
ANOVA
df SS MS F
Significa
nce F
Regression 2
325163.2
57
162581.
6285
50.09
806
1.32483
E-05
Residual 9
29207.40
97
3245.26
7745
Total 11
354370.6
667
Coefficie
nts
Standard
Error t Stat
P-
value
Lower
95%
Upper
95%
Lower
95.0%
Upper
95.0%
tabler-icon-diamond-filled.svg

Paraphrase This Document

Need a fresh take? Get an instant paraphrase of this document with our AI Paraphraser
Document Page
10MANAGEMENT ACCOUNTING
Intercept
234.944
9397
93.47393
705
2.51348
0731
0.033
121
23.4922
0387
446.397
6755
23.4922
0387
446.397
6755
Visits
0.04099
2952
0.079871
701
0.51323
5002
0.620
147
-
0.13968
9387
0.22167
5292
-
0.13968
9387
0.22167
5292
Revenues
0.03931
149
0.004375
191
8.98509
1817
8.65E
-06
0.02941
4121
0.04920
8858
0.02941
4121
0.04920
8858
The cost function, based on the linear regression, should be as follows:
y= 93.47+0.079x1 + 0.0043x2
where, y= Supplies cost
x1= Amount of Revenue
x2= Nos. of Visits
Answer to Part C:
Requirement C.1:
SUMMARY OUTPUT
Regression Statistics
Multiple R
0.93505
8979
R Square
0.87433
5294
Adjusted R
Square
0.83244
7059
Standard
Error
31444.8
671
Observation
s 5
ANOVA
df SS MS F
Significa
nce F
Document Page
11MANAGEMENT ACCOUNTING
Regression 1
2063884
9000
2063884
9000
20.87
305
0.01967
1441
Residual 3
2966339
000
9887796
66.7
Total 4
2360518
8000
Coefficie
nts
Standard
Error t Stat
P-
value
Lower
95%
Upper
95%
Lower
95.0%
Upper
95.0%
Intercept 234730
51669.18
908
4.54293
95
0.019
973
70295.5
8014
399164.
4199
70295.5
8014
399164.
4199
Hours 41.3
9.039763
704
4.56870
3492
0.019
671
12.5314
374
70.0685
626
12.5314
374
70.0685
626
The cost function of both hours and overhead costs, using the representative range of
7700 and 3300 hours are as follows:
y= 234730 + 41.30x
Where, y = Overhead Costs
x= Nos. of Hours
Requirement C.2:
Both the p-values of intercept co-efficient and hours co-efficient are lower than 0.05.
Hence, it can be stated that the constant or intercept estimate of the cost function represents the
fixed overhead costs.
Requirement C.3:
Hours
Variable
Overhead
per hour
Fixed
Overhead
Total
Overhead
3300 $41.30 $234,730 $371,020
4400 $41.30 $234,730 $416,450
chevron_up_icon
1 out of 15
circle_padding
hide_on_mobile
zoom_out_icon
[object Object]