Comprehensive Management Accounting Report for KBC Ltd (Case Study)
VerifiedAdded on 2019/12/04
|26
|6654
|439
Report
AI Summary
This report provides a comprehensive analysis of management accounting principles applied to a case study of KBC Ltd. It begins with an introduction to management accounting and the significance of budgeting, outlining administrative procedures and the stages of the budgeting process. The report then delves into cost classification, including direct, indirect, fixed, variable, and semi-variable costs, alongside an explanation of the high-low method for calculating fixed and variable costs. Furthermore, the report examines the effects of absorption and marginal costing on stock valuation and profit determination, differentiating between job, batch, process, and service costing. The report includes profit and loss statements prepared under both absorption and marginal costing methods for different regions of KBC Ltd. It also offers recommendations related to product combinations with limited labor hours, and calculating profits under varying scenarios. The report concludes with an analysis of different budgeting methods, including cash budgets, and variance analysis, along with calculations of units sold, sales value, and profit determination at different sales levels. It also includes recommendations for improving performance of Bata Ltd.
Management Accounting
1
1
Paraphrase This Document
Need a fresh take? Get an instant paraphrase of this document with our AI Paraphraser
TABLE OF CONTENTS
INTRODUCTION...........................................................................................................................4
TASK 1............................................................................................................................................4
A Purpose of using budgeting......................................................................................................4
B Administrative budgeting procedure........................................................................................4
C Describing the stages of budgeting process.............................................................................5
TASK 2............................................................................................................................................5
A Classifying cost........................................................................................................................5
B Calculating the fixed and variable cost using high low method..............................................6
TASK 3............................................................................................................................................6
A Absorption and marginal costing effect on stock valuation and profit determination.............6
B Difference between job costing, batch costing, process costing and service costing..............7
C Preparing profit and loss statement for North and South area under absorption costing.........7
D Prepare profit and loss statement for South region on the basis of marginal costing..............9
TASK 4............................................................................................................................................9
A Advise the KBC.......................................................................................................................9
B Calculating following figures.................................................................................................10
(i) Contribution to sales ratio (PVR)..........................................................................................10
C Combination of products with limited labour hours..............................................................11
D Calculating of profits at 6000 further hours...........................................................................11
TASK 5..........................................................................................................................................11
A Different types of budgeting method.....................................................................................11
B Cash budget............................................................................................................................12
TASK 6..........................................................................................................................................13
Budget and calculation of variance............................................................................................13
TASK 7..........................................................................................................................................15
(A) Calculating units sold and sales value.................................................................................15
B Computing profit or loss at the sale of 26500 pair of shoes...................................................15
C Computation number of units to earn desired profit worth £240100....................................16
D Computing total number of units at increased selling price by 15% & advertisement cost of
£20000........................................................................................................................................16
E Recommending and justifying appropriate action for improving performance of Bata Ltd..16
2
CONCLUSION..............................................................................................................................17
REFERENCES..............................................................................................................................18
3
REFERENCES..............................................................................................................................18
3
⊘ This is a preview!⊘
Do you want full access?
Subscribe today to unlock all pages.
Trusted by 1+ million students worldwide
INDEX OF TABLES
Table 1: Table 1: Profit for North Area...........................................................................................9
ILLUSTRATION INDEX
Illustration 1: P & L for south area................................................................................................10
Illustration 2: P & L for south Region...........................................................................................10
4
Paraphrase This Document
Need a fresh take? Get an instant paraphrase of this document with our AI Paraphraser
INTRODUCTION
Management accounting is the procedure of preparing management report and accounts
through which decision related to daily business activities are taken effectively. BY using
concepts of management accounting reports are generated on monthly or weekly basis in order to
show balance related to cash, sales turnover and outstanding debts. Present report is based on
case study of KBC Ltd which handle its work related to management accounting by utilizing
number of techniques. Furthermore, purpose of budgeting and control mechanism are also
explained effectively. In addition to this, effect of absorption and marginal costing has been
discussed along with proper demonstration.
TASK 1
A Purpose of using budgeting
Budgeting
Budgeting is defined as a tool used for estimating the revenue and expenditure, for the
pre-set time period. It is a quantitative plan used for deciding which activities and associated
expenditure. KBC Company designs budget to make optimum use of financial resource and to
find the way to overcome or control expenses. The main purpose is to have control over
expenses and avail financial resources on important activities of business.
Benefits of budgeting
Budgeting is very important for business as is provide certainty for future business
activities. It assists corporation in reducing cost of production and increasing overall rate of
return. The use of budget enable business to maintain effective balance between potential
expenditure and income in KBC ltd. Similarly, budgeting benefits management of KBC Ltd to
get information related to potential threats so that accordingly appropriate action can be taken for
smooth operation of business (Davies and Crawford, 2011). Another benefit of budget for KBC
Company is that resources allocation is also done with the help of budgeting process. It helps in
analyzing cost and expenses is done in the light of expected return or growth of company.
Budgeting facilitates KBC Ltd to access cost effective sources of finance in order to reduce cost
5
of production and ensure expansion of business in the marketplace. As a benefit, effective
management of capital structure is ensured by using budgeting practices.
B Administrative budgeting procedure
The following points represents the administrative budgeting procedure:
Setting objectives of budgeting in a line with corporation budget: The administrative
budgeting process start with setting objectives of corporation for preparing budgets. In this
process m the KBC Ltd might set objectives related to enhancement of profitability and
increasing sales turnover and increased customer base (Gibbons and et.al. 2010).
Review the plan with different departments: The plan of budget is to be discussed with
different department so as to assess the funding needs for each department. This is the process in
which business has to define functions of finance. The budget is to be set in accordance with
objectives of each department which are set in order to ensure growth and success of KBC Ltd.
Make a budget: The last stage is of preparing budget for the business by monitoring
strategies so as to reduce gap between actual and expected outcome. The continuous monitoring
tend is to be ensured for growth and success of company for long run (Kaplan and Atkinson,
2015).
C Describing the stages of budgeting process
The budgeting process of KBC Ltd has been stated as follows- Draft- The primary stage of budgeting is to draft the budget. In this stage, objectives of
budgets are to be designed in accordance with the requirements of business. Budgeting is
done by managers by drafting the budgets such as sales budget, cash budget and
production budget (Chua, Lowe and Puxty, 2015).
Approve- The prepared budget is to be approved by the management of company for this,
it has to set standard related to expenses. The expected amount of profitability can be
debated by the managers. Execute- After their approval, the process starts with implementation of budget and start
expending. The activities discussed with budgets and monetary aspects of budget will be
applied.
6
⊘ This is a preview!⊘
Do you want full access?
Subscribe today to unlock all pages.
Trusted by 1+ million students worldwide
Review- After setting or creating budget monitoring or reviewing process is started so
that expected outcome is achieved. This is the last step under which modification are
done in accordance with variation of expected and actual outcome.
TASK 2
A Classifying cost
The cost classification has been done as follows- Nature-It classifies cost into two parts such as direct and indirect. Here, direct cost is
incurred on production activities which consists of wages, material and other related cost.
On the other part, stationary, depreciation and salaries of administrative department will
also be included (Zimmerman and Yahya-Zadeh, 2011). Behavior-According to behavior there are different types of cost such as fixed, variable
and semi-variable as well as stepped fixed cost. The first one remain constant throughout
production process whereas variable cost varies in accordance with volume of production
(Mistry and et. al., 2014). Furthermore, semi-variable cost includes electricity and
telephone bill whee some portion remain constant and after that expenses are based on
consumption. In addition to this, stepped fixed cost is like fixed cost of production which
does not decrease or increase with production. However, due to shifting of production
activities cause high cost of production.
Function-Under this, different activities such as production, marketing and
administration. Here, production cost includes expenses of rent, unproductive wages and
depreciation as well as lighting (Caliskan, 2014). On the other hand, marketing cost
consists of expenses such as advertisement, free sample. These cost are indirectly related
to production. Apart from this, administrative cost consists stationary, postage and office
rent etc.
7
Paraphrase This Document
Need a fresh take? Get an instant paraphrase of this document with our AI Paraphraser
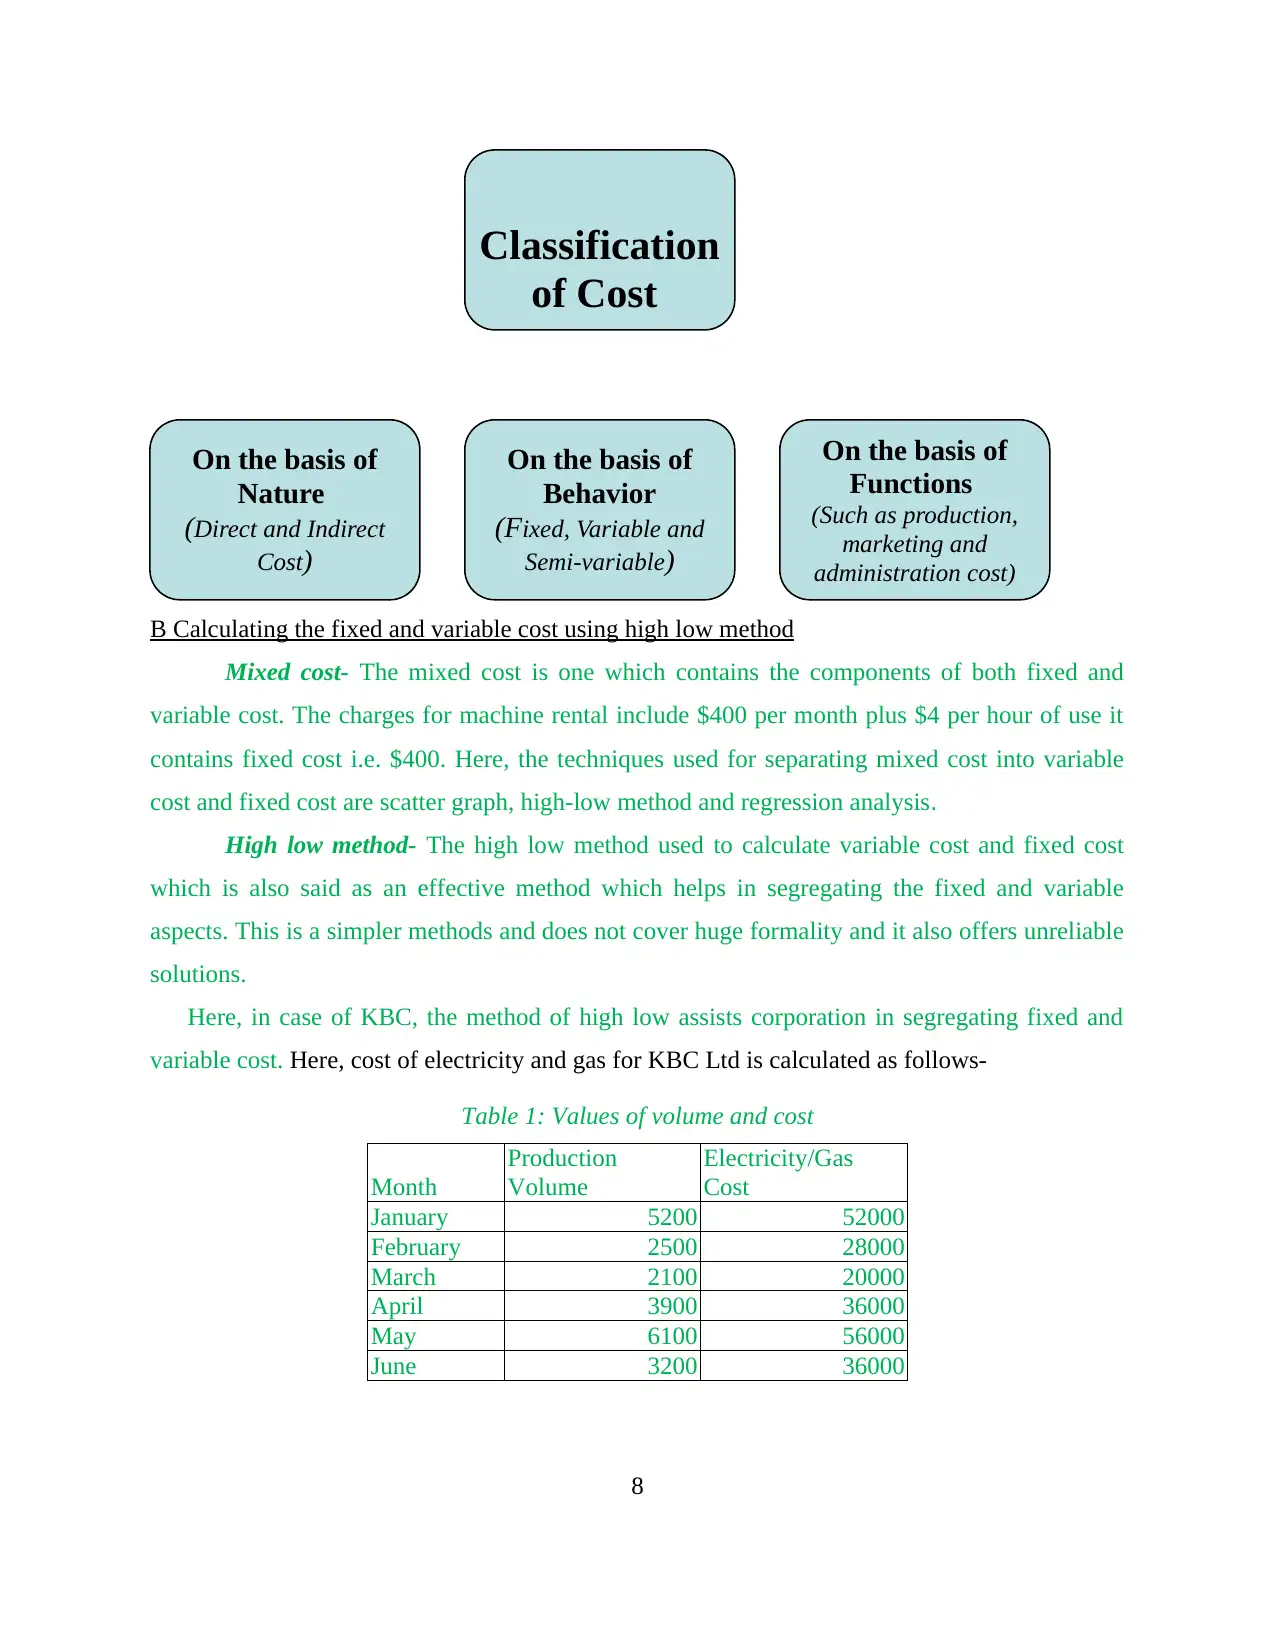
B Calculating the fixed and variable cost using high low method
Mixed cost- The mixed cost is one which contains the components of both fixed and
variable cost. The charges for machine rental include $400 per month plus $4 per hour of use it
contains fixed cost i.e. $400. Here, the techniques used for separating mixed cost into variable
cost and fixed cost are scatter graph, high-low method and regression analysis.
High low method- The high low method used to calculate variable cost and fixed cost
which is also said as an effective method which helps in segregating the fixed and variable
aspects. This is a simpler methods and does not cover huge formality and it also offers unreliable
solutions.
Here, in case of KBC, the method of high low assists corporation in segregating fixed and
variable cost. Here, cost of electricity and gas for KBC Ltd is calculated as follows-
Table 1: Values of volume and cost
Month
Production
Volume
Electricity/Gas
Cost
January 5200 52000
February 2500 28000
March 2100 20000
April 3900 36000
May 6100 56000
June 3200 36000
8
Classification
of Cost
On the basis of
Nature
(Direct and Indirect
Cost)
On the basis of
Behavior
(Fixed, Variable and
Semi-variable)
On the basis of
Functions
(Such as production,
marketing and
administration cost)
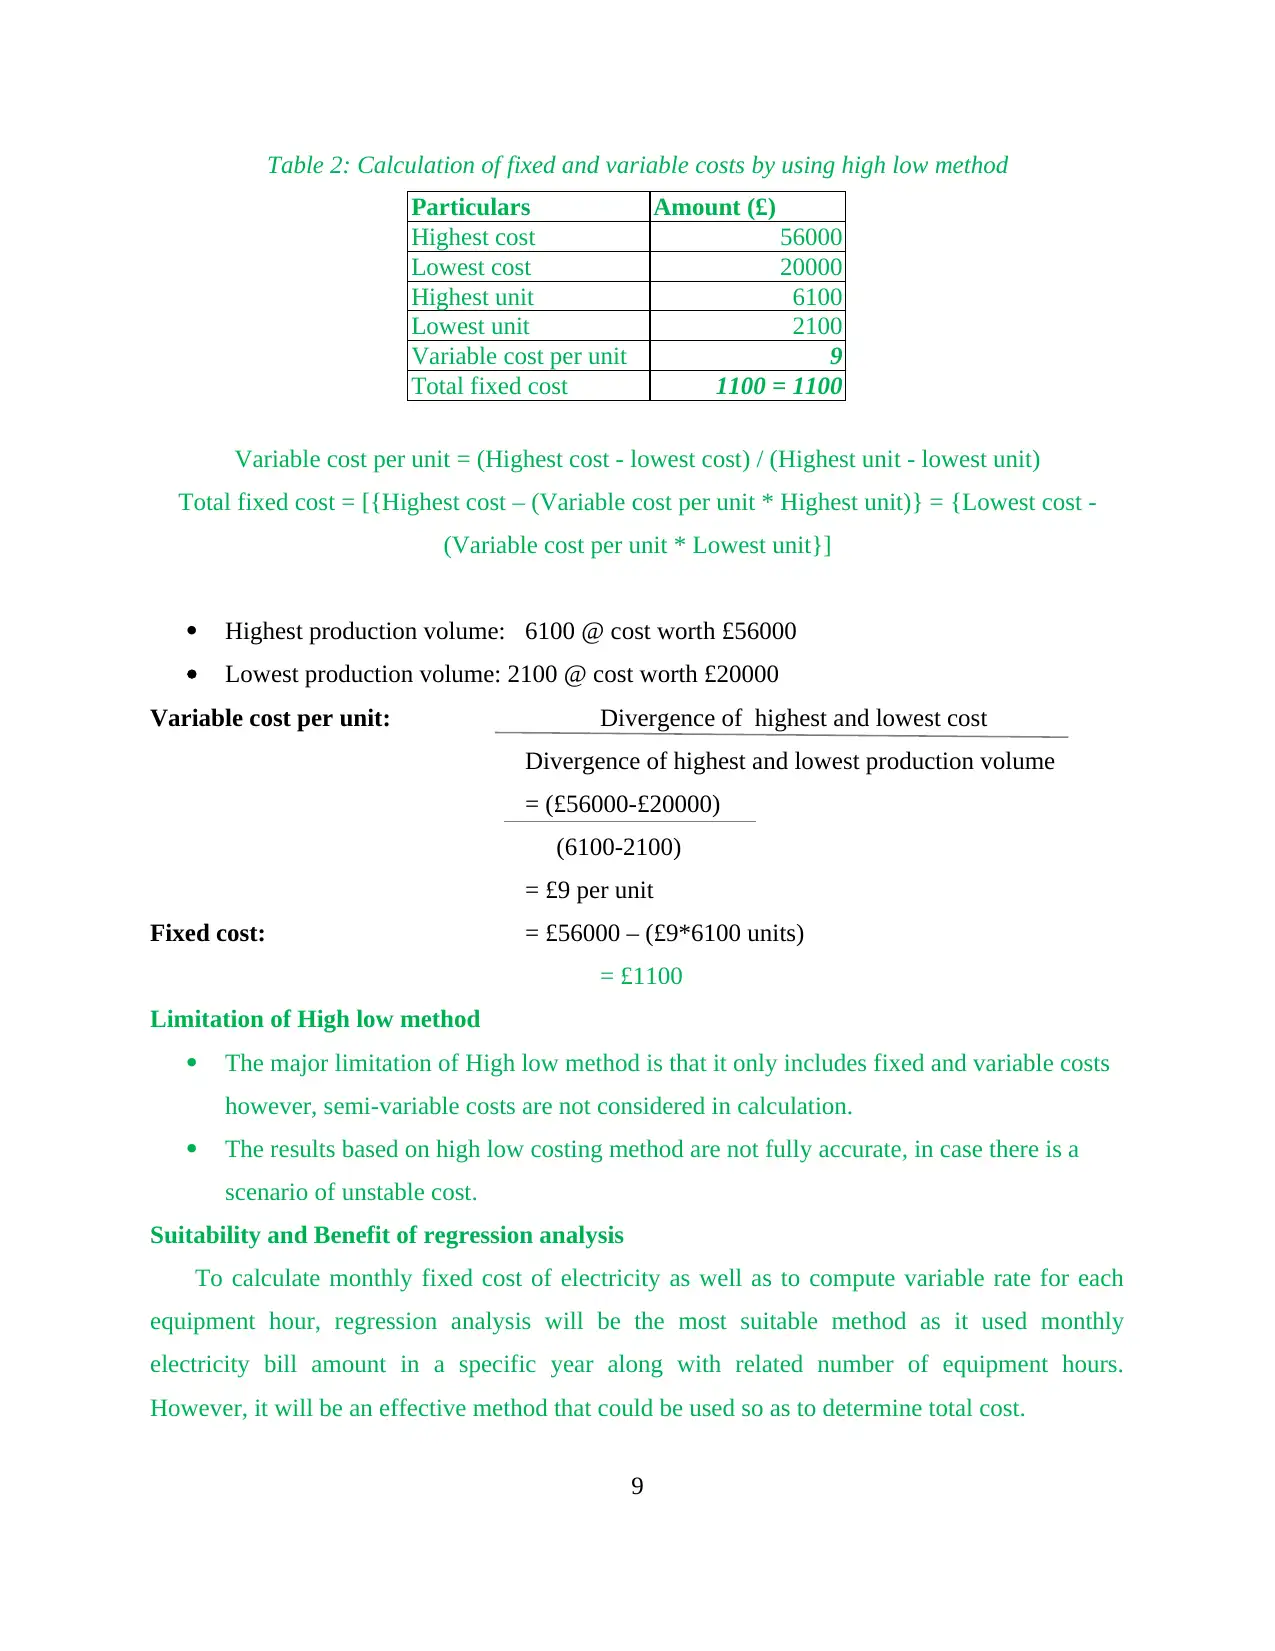
Table 2: Calculation of fixed and variable costs by using high low method
Particulars Amount (£)
Highest cost 56000
Lowest cost 20000
Highest unit 6100
Lowest unit 2100
Variable cost per unit 9
Total fixed cost 1100 = 1100
Variable cost per unit = (Highest cost - lowest cost) / (Highest unit - lowest unit)
Total fixed cost = [{Highest cost – (Variable cost per unit * Highest unit)} = {Lowest cost -
(Variable cost per unit * Lowest unit}]
Highest production volume: 6100 @ cost worth £56000
Lowest production volume: 2100 @ cost worth £20000
Variable cost per unit: Divergence of highest and lowest cost
Divergence of highest and lowest production volume
= (£56000-£20000)
(6100-2100)
= £9 per unit
Fixed cost: = £56000 – (£9*6100 units)
= £1100
Limitation of High low method
The major limitation of High low method is that it only includes fixed and variable costs
however, semi-variable costs are not considered in calculation.
The results based on high low costing method are not fully accurate, in case there is a
scenario of unstable cost.
Suitability and Benefit of regression analysis
To calculate monthly fixed cost of electricity as well as to compute variable rate for each
equipment hour, regression analysis will be the most suitable method as it used monthly
electricity bill amount in a specific year along with related number of equipment hours.
However, it will be an effective method that could be used so as to determine total cost.
9
⊘ This is a preview!⊘
Do you want full access?
Subscribe today to unlock all pages.
Trusted by 1+ million students worldwide
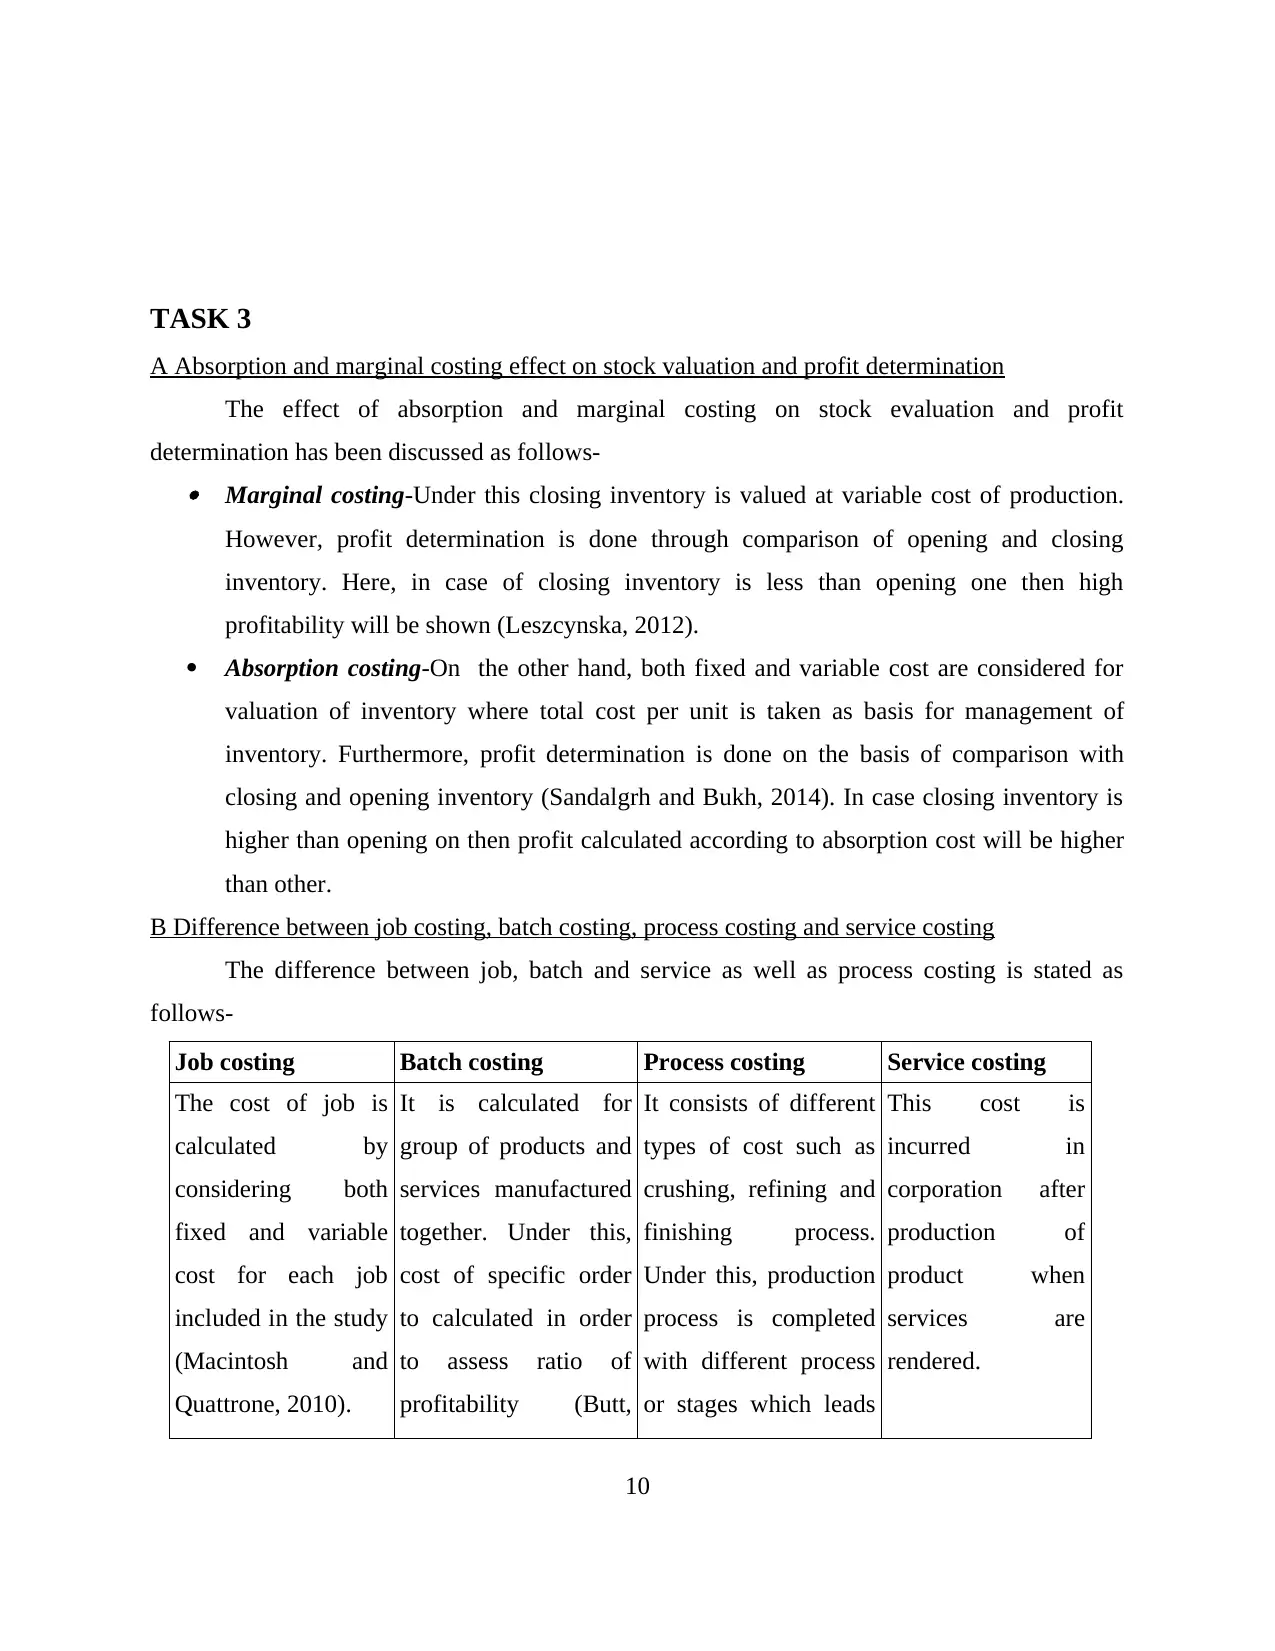
TASK 3
A Absorption and marginal costing effect on stock valuation and profit determination
The effect of absorption and marginal costing on stock evaluation and profit
determination has been discussed as follows- Marginal costing-Under this closing inventory is valued at variable cost of production.
However, profit determination is done through comparison of opening and closing
inventory. Here, in case of closing inventory is less than opening one then high
profitability will be shown (Leszcynska, 2012).
Absorption costing-On the other hand, both fixed and variable cost are considered for
valuation of inventory where total cost per unit is taken as basis for management of
inventory. Furthermore, profit determination is done on the basis of comparison with
closing and opening inventory (Sandalgrh and Bukh, 2014). In case closing inventory is
higher than opening on then profit calculated according to absorption cost will be higher
than other.
B Difference between job costing, batch costing, process costing and service costing
The difference between job, batch and service as well as process costing is stated as
follows-
Job costing Batch costing Process costing Service costing
The cost of job is
calculated by
considering both
fixed and variable
cost for each job
included in the study
(Macintosh and
Quattrone, 2010).
It is calculated for
group of products and
services manufactured
together. Under this,
cost of specific order
to calculated in order
to assess ratio of
profitability (Butt,
It consists of different
types of cost such as
crushing, refining and
finishing process.
Under this, production
process is completed
with different process
or stages which leads
This cost is
incurred in
corporation after
production of
product when
services are
rendered.
10
Paraphrase This Document
Need a fresh take? Get an instant paraphrase of this document with our AI Paraphraser
2010). to support final
outcome.
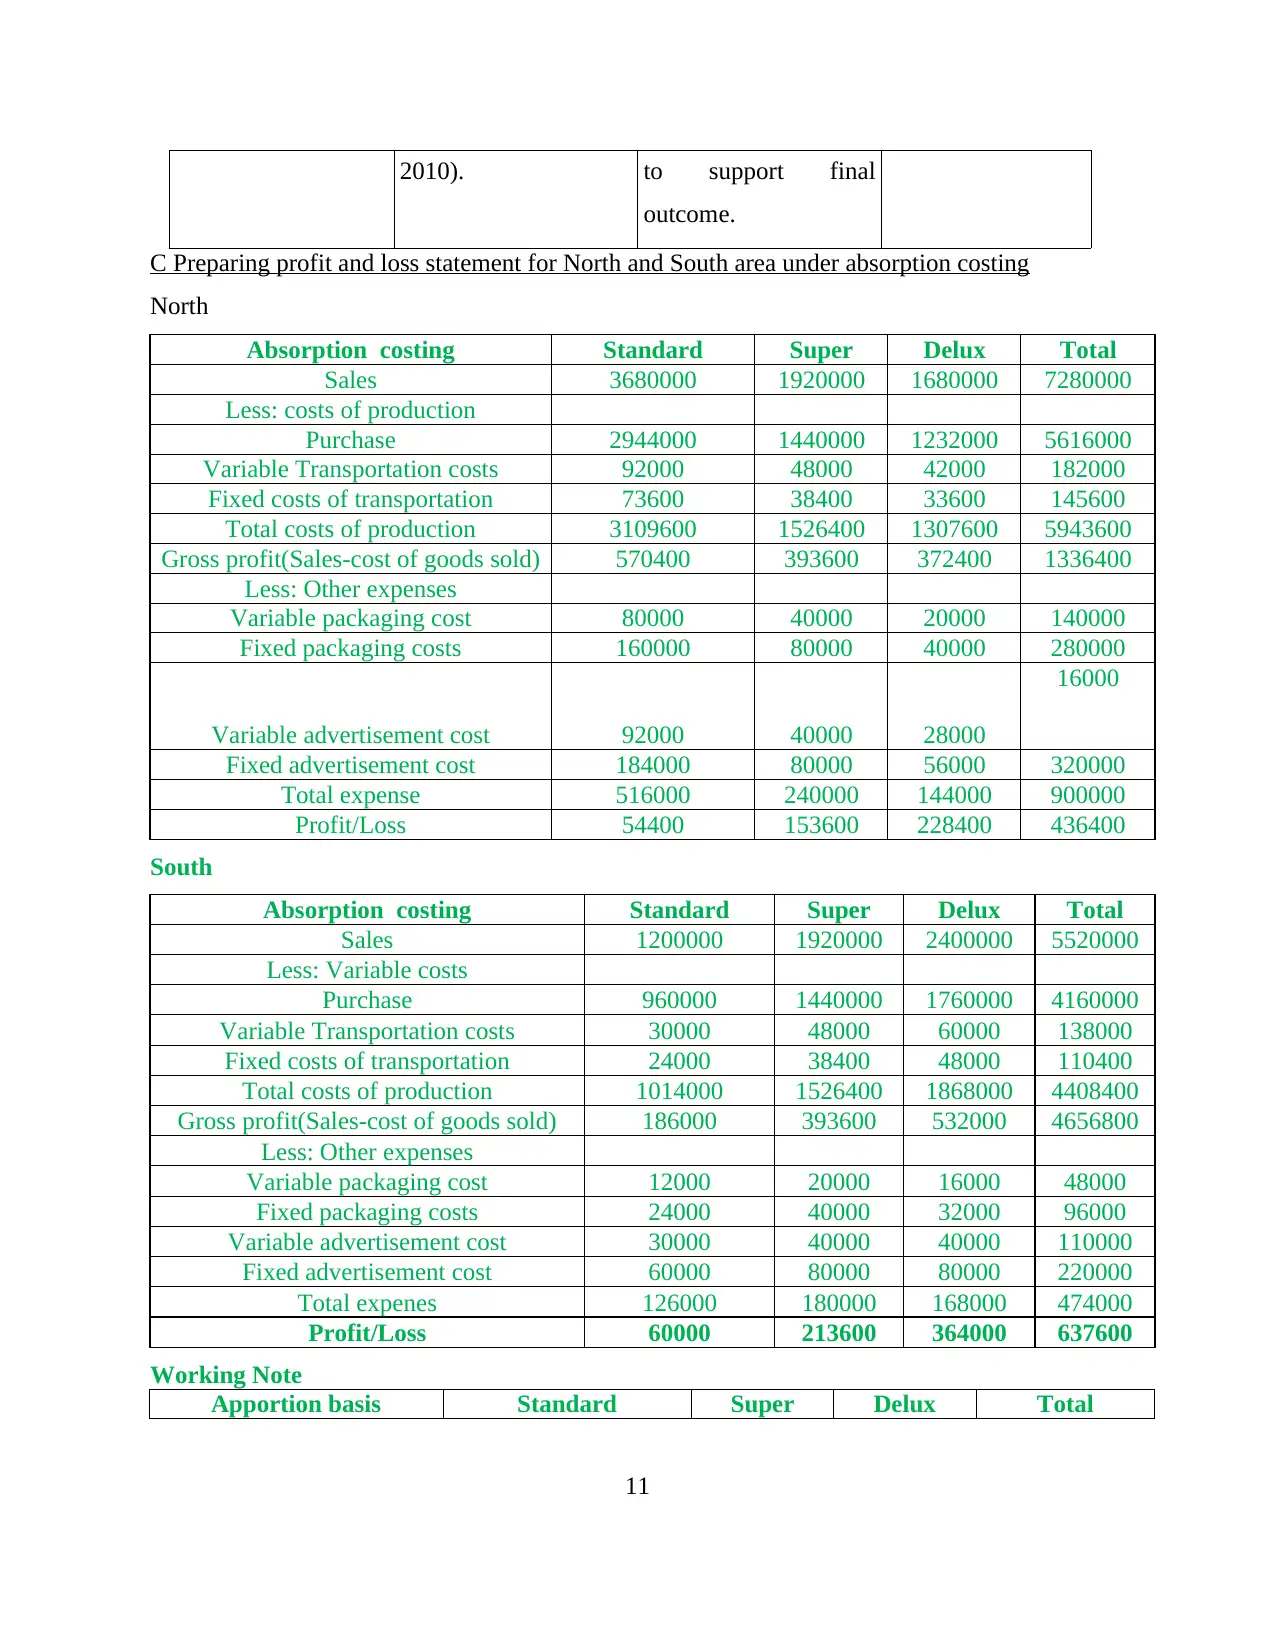
C Preparing profit and loss statement for North and South area under absorption costing
North
Absorption costing Standard Super Delux Total
Sales 3680000 1920000 1680000 7280000
Less: costs of production
Purchase 2944000 1440000 1232000 5616000
Variable Transportation costs 92000 48000 42000 182000
Fixed costs of transportation 73600 38400 33600 145600
Total costs of production 3109600 1526400 1307600 5943600
Gross profit(Sales-cost of goods sold) 570400 393600 372400 1336400
Less: Other expenses
Variable packaging cost 80000 40000 20000 140000
Fixed packaging costs 160000 80000 40000 280000
Variable advertisement cost 92000 40000 28000
16000
Fixed advertisement cost 184000 80000 56000 320000
Total expense 516000 240000 144000 900000
Profit/Loss 54400 153600 228400 436400
South
Absorption costing Standard Super Delux Total
Sales 1200000 1920000 2400000 5520000
Less: Variable costs
Purchase 960000 1440000 1760000 4160000
Variable Transportation costs 30000 48000 60000 138000
Fixed costs of transportation 24000 38400 48000 110400
Total costs of production 1014000 1526400 1868000 4408400
Gross profit(Sales-cost of goods sold) 186000 393600 532000 4656800
Less: Other expenses
Variable packaging cost 12000 20000 16000 48000
Fixed packaging costs 24000 40000 32000 96000
Variable advertisement cost 30000 40000 40000 110000
Fixed advertisement cost 60000 80000 80000 220000
Total expenes 126000 180000 168000 474000
Profit/Loss 60000 213600 364000 637600
Working Note
Apportion basis Standard Super Delux Total
11
outcome.
C Preparing profit and loss statement for North and South area under absorption costing
North
Absorption costing Standard Super Delux Total
Sales 3680000 1920000 1680000 7280000
Less: costs of production
Purchase 2944000 1440000 1232000 5616000
Variable Transportation costs 92000 48000 42000 182000
Fixed costs of transportation 73600 38400 33600 145600
Total costs of production 3109600 1526400 1307600 5943600
Gross profit(Sales-cost of goods sold) 570400 393600 372400 1336400
Less: Other expenses
Variable packaging cost 80000 40000 20000 140000
Fixed packaging costs 160000 80000 40000 280000
Variable advertisement cost 92000 40000 28000
16000
Fixed advertisement cost 184000 80000 56000 320000
Total expense 516000 240000 144000 900000
Profit/Loss 54400 153600 228400 436400
South
Absorption costing Standard Super Delux Total
Sales 1200000 1920000 2400000 5520000
Less: Variable costs
Purchase 960000 1440000 1760000 4160000
Variable Transportation costs 30000 48000 60000 138000
Fixed costs of transportation 24000 38400 48000 110400
Total costs of production 1014000 1526400 1868000 4408400
Gross profit(Sales-cost of goods sold) 186000 393600 532000 4656800
Less: Other expenses
Variable packaging cost 12000 20000 16000 48000
Fixed packaging costs 24000 40000 32000 96000
Variable advertisement cost 30000 40000 40000 110000
Fixed advertisement cost 60000 80000 80000 220000
Total expenes 126000 180000 168000 474000
Profit/Loss 60000 213600 364000 637600
Working Note
Apportion basis Standard Super Delux Total
11
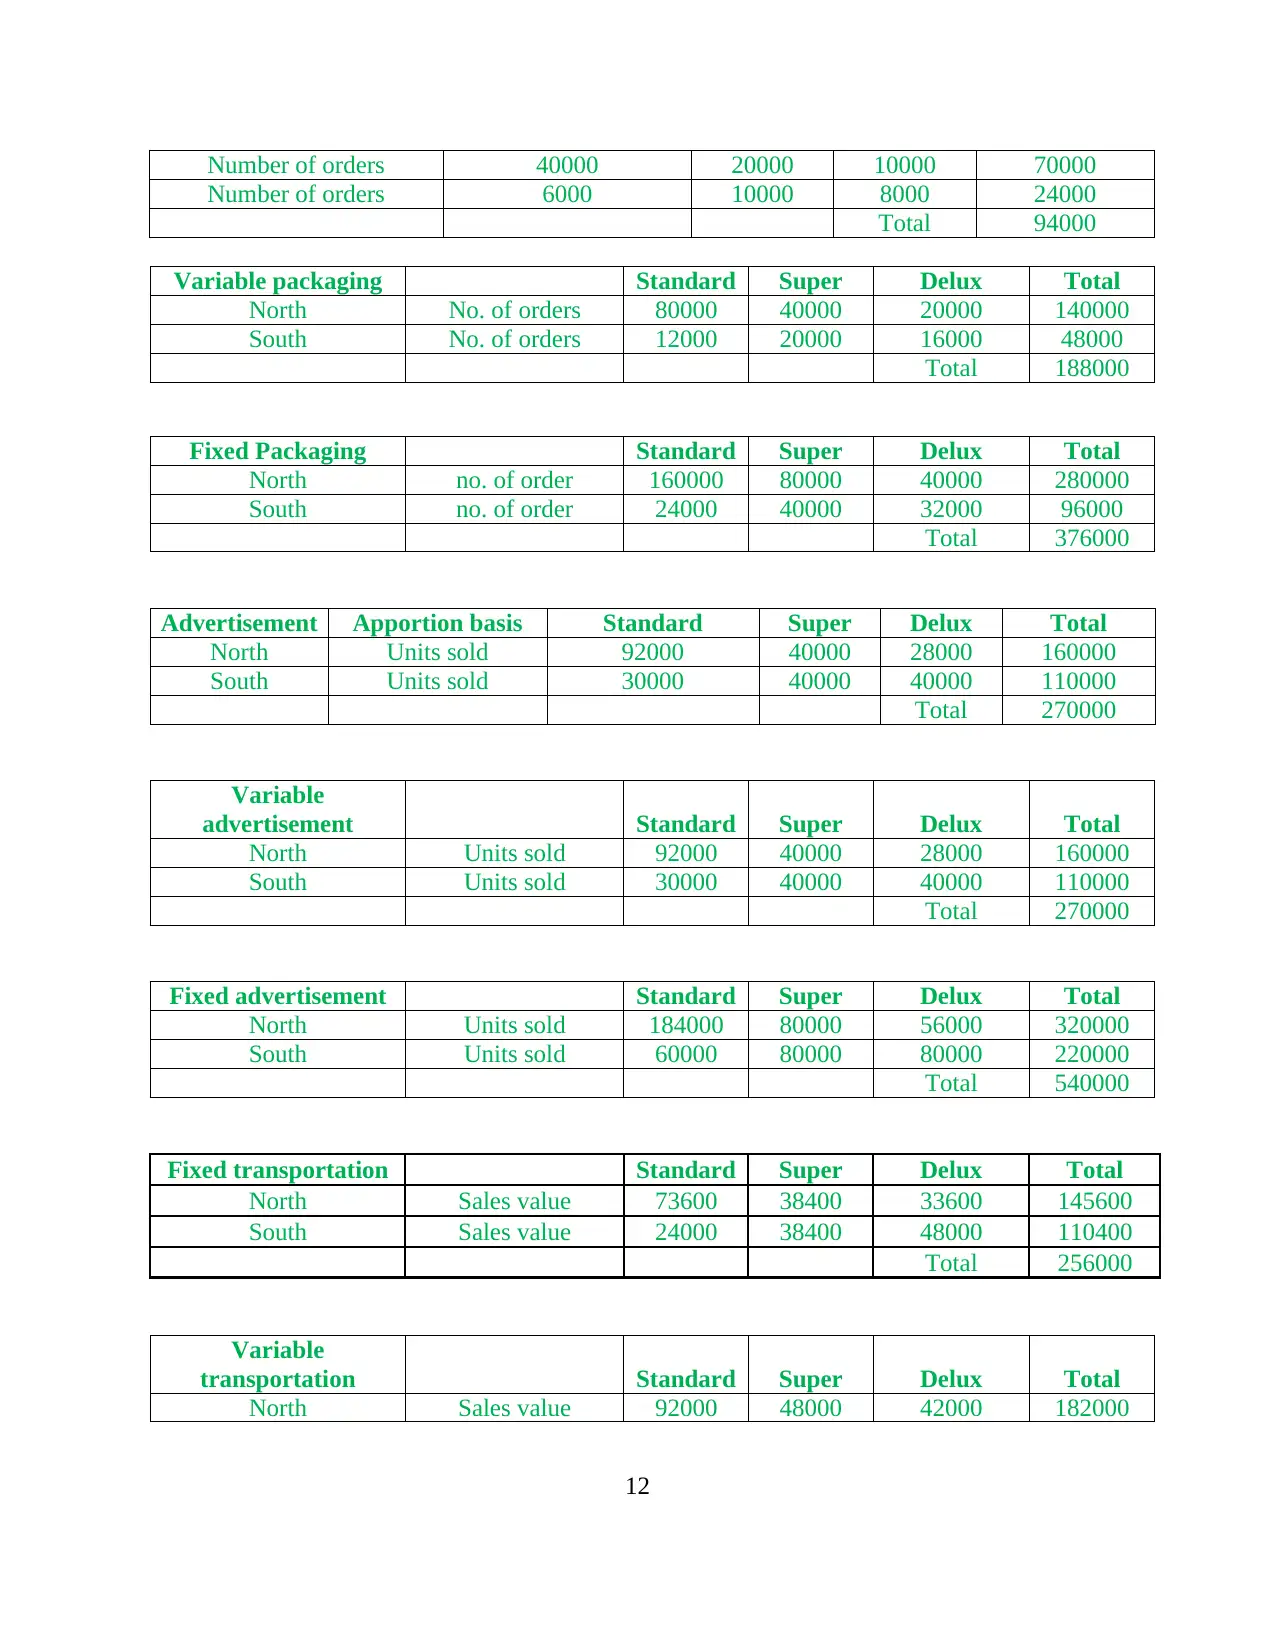
Number of orders 40000 20000 10000 70000
Number of orders 6000 10000 8000 24000
Total 94000
Variable packaging Standard Super Delux Total
North No. of orders 80000 40000 20000 140000
South No. of orders 12000 20000 16000 48000
Total 188000
Fixed Packaging Standard Super Delux Total
North no. of order 160000 80000 40000 280000
South no. of order 24000 40000 32000 96000
Total 376000
Advertisement Apportion basis Standard Super Delux Total
North Units sold 92000 40000 28000 160000
South Units sold 30000 40000 40000 110000
Total 270000
Variable
advertisement Standard Super Delux Total
North Units sold 92000 40000 28000 160000
South Units sold 30000 40000 40000 110000
Total 270000
Fixed advertisement Standard Super Delux Total
North Units sold 184000 80000 56000 320000
South Units sold 60000 80000 80000 220000
Total 540000
Fixed transportation Standard Super Delux Total
North Sales value 73600 38400 33600 145600
South Sales value 24000 38400 48000 110400
Total 256000
Variable
transportation Standard Super Delux Total
North Sales value 92000 48000 42000 182000
12
⊘ This is a preview!⊘
Do you want full access?
Subscribe today to unlock all pages.
Trusted by 1+ million students worldwide
1 out of 26
Related Documents


Your All-in-One AI-Powered Toolkit for Academic Success.
+13062052269
info@desklib.com
Available 24*7 on WhatsApp / Email
![[object Object]](/_next/static/media/star-bottom.7253800d.svg)
Unlock your academic potential
Copyright © 2020–2026 A2Z Services. All Rights Reserved. Developed and managed by ZUCOL.