Management Accounting Report: Costing, Budgeting and Analysis

Verified

Added on  2023/01/12

|10
|1066
|38
Report
AI Summary
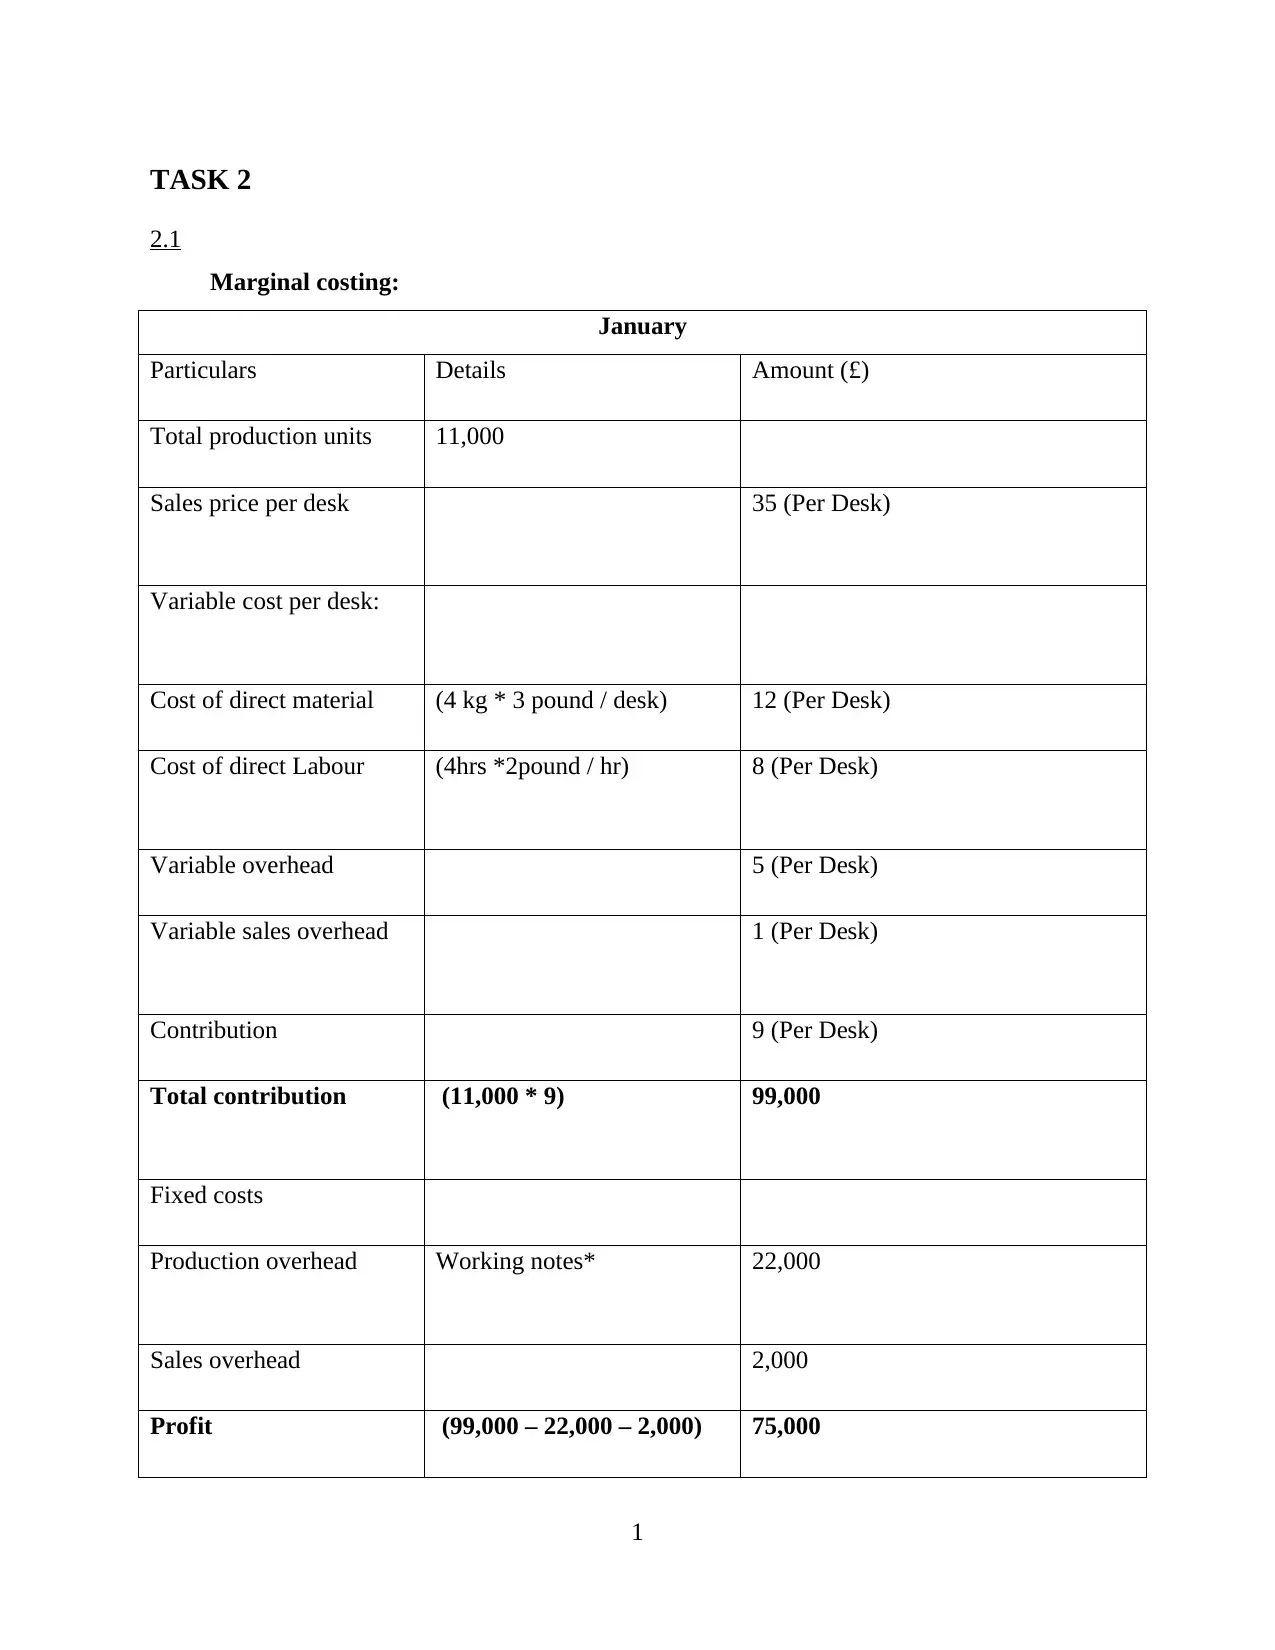
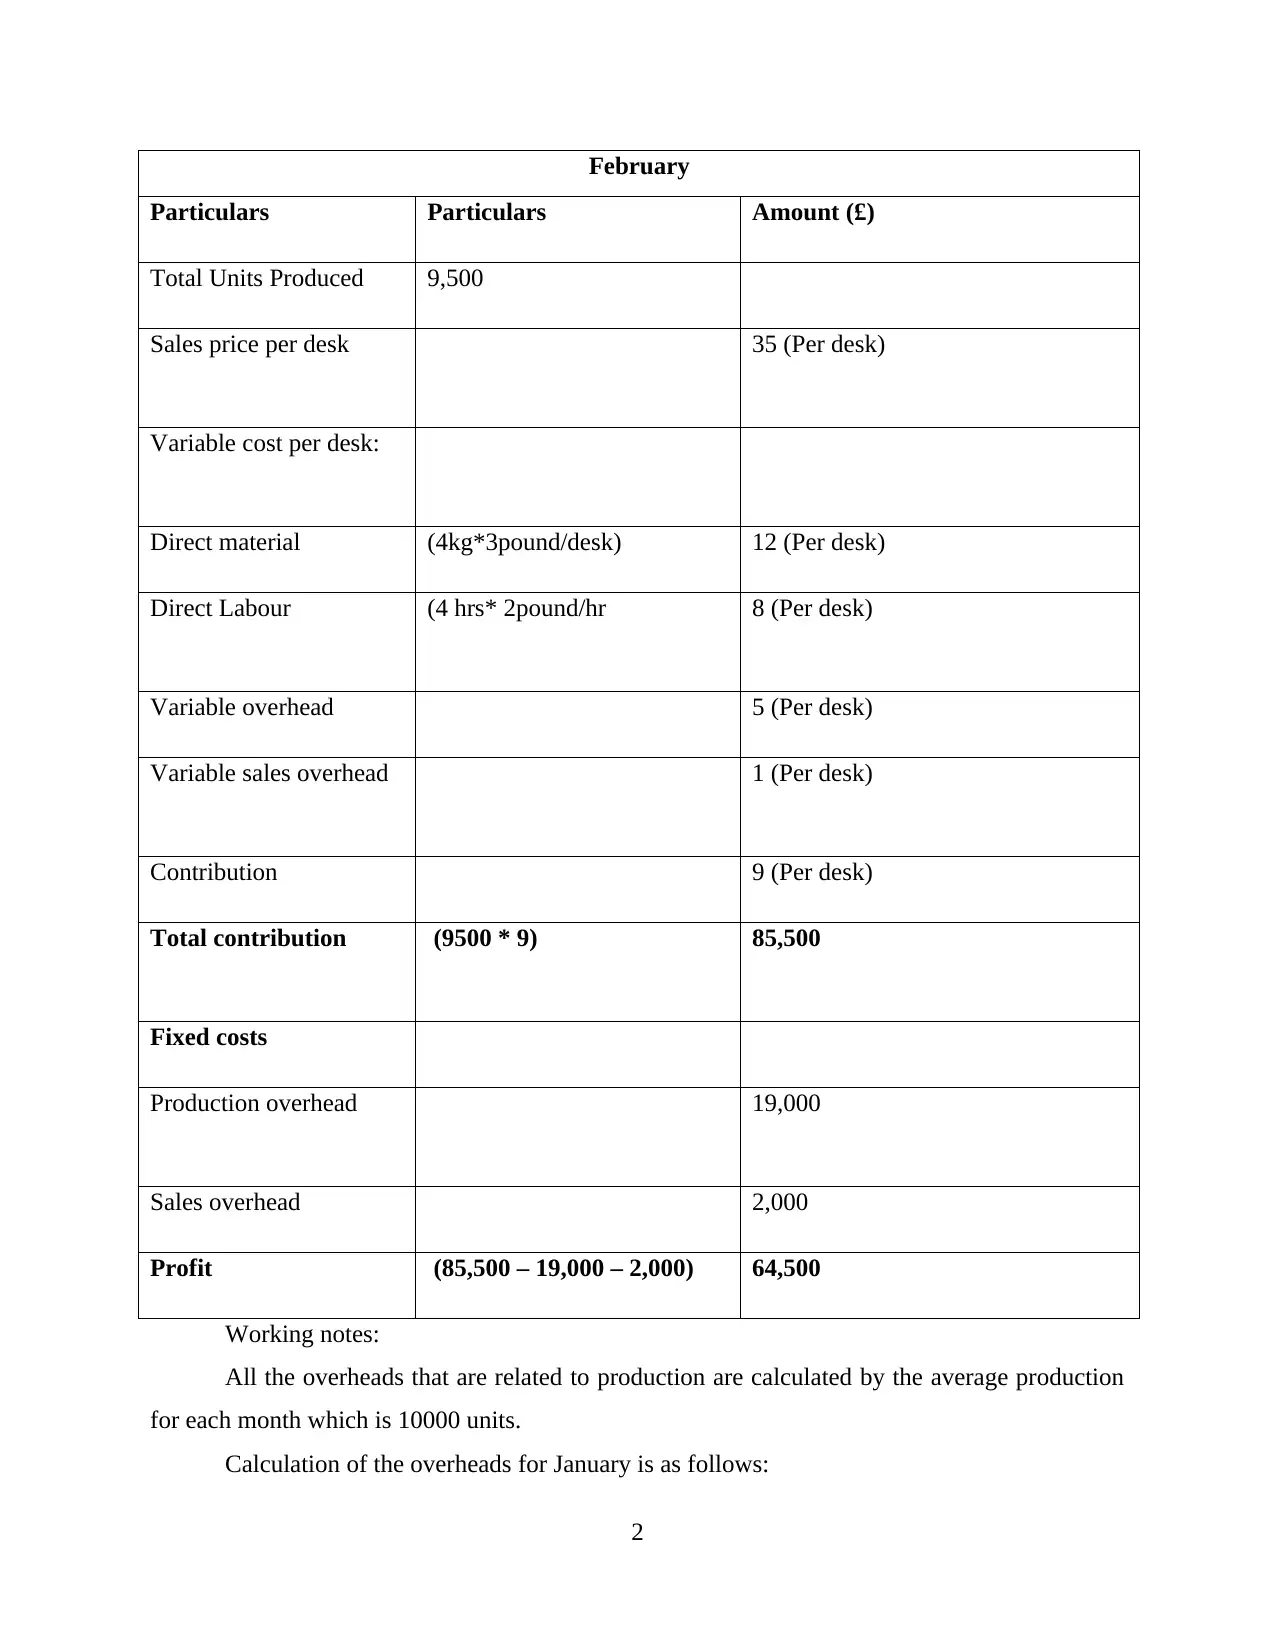
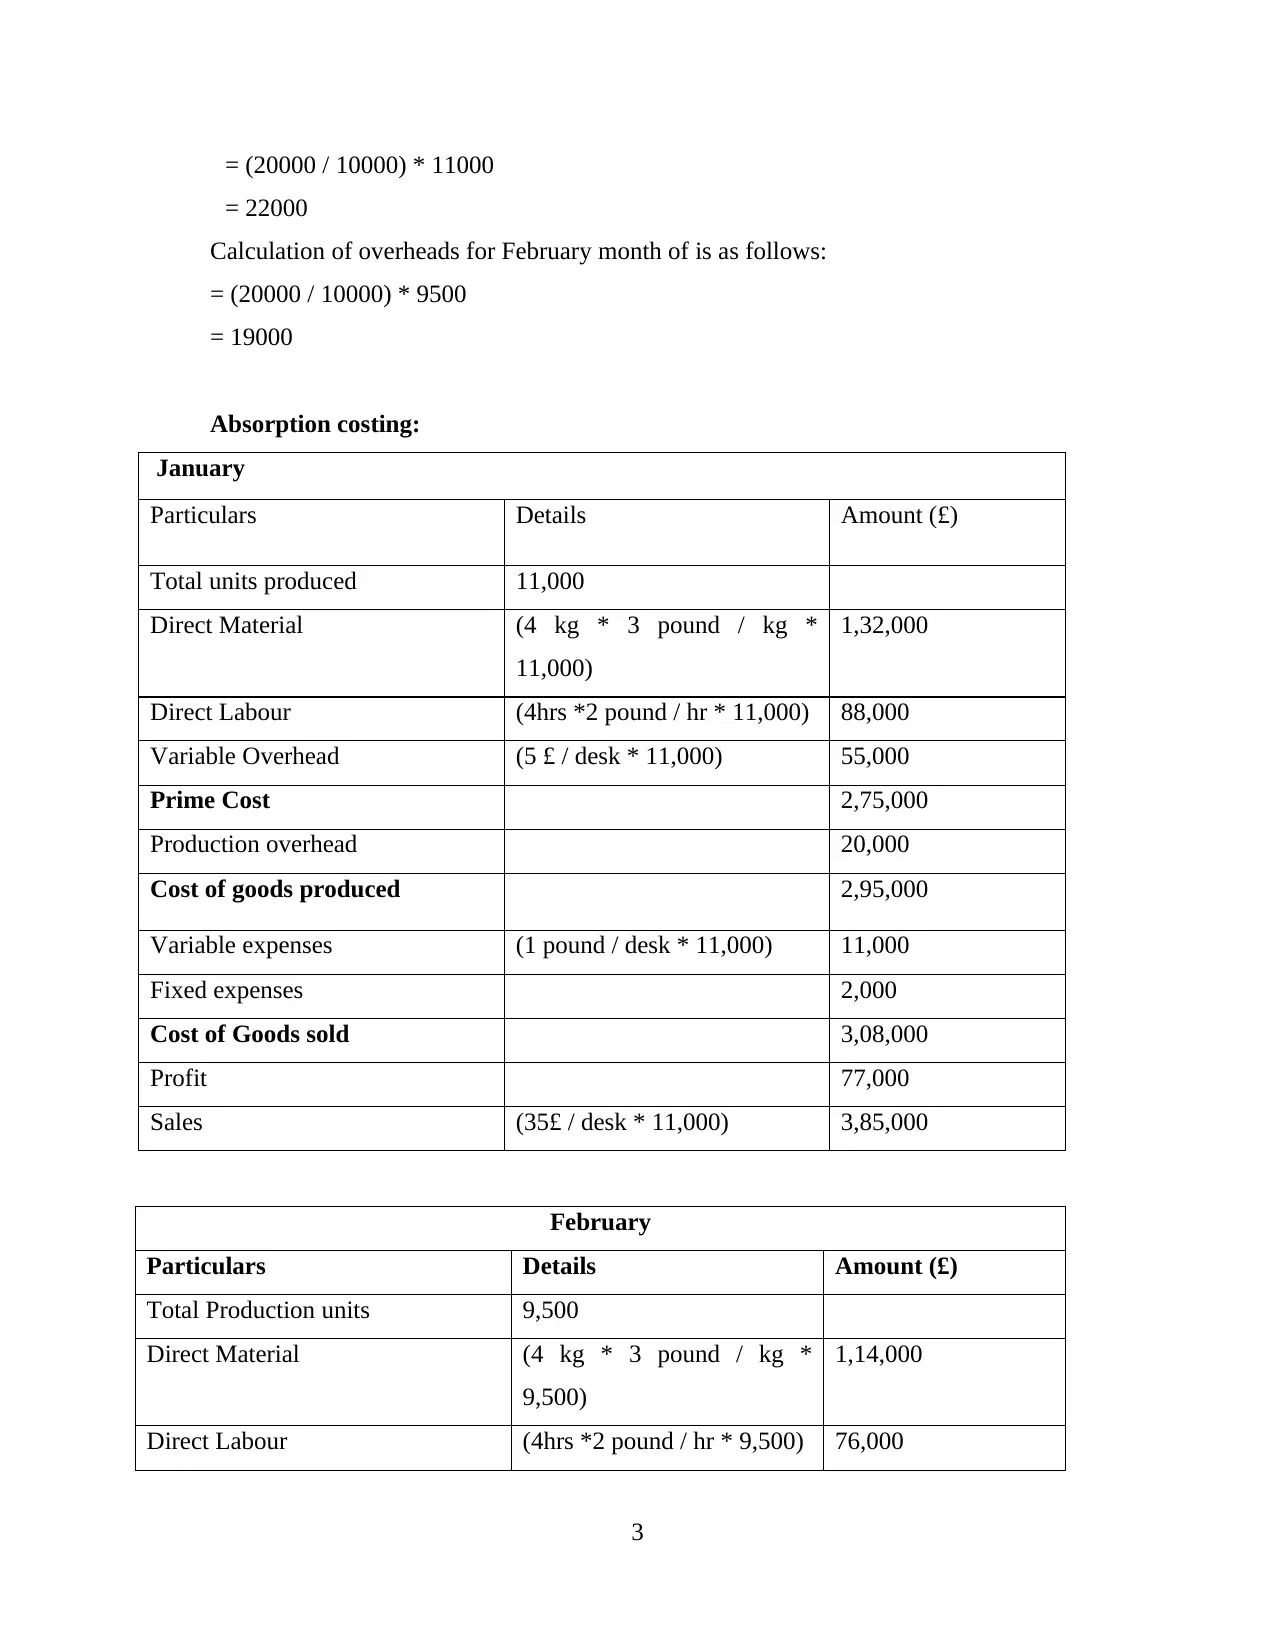
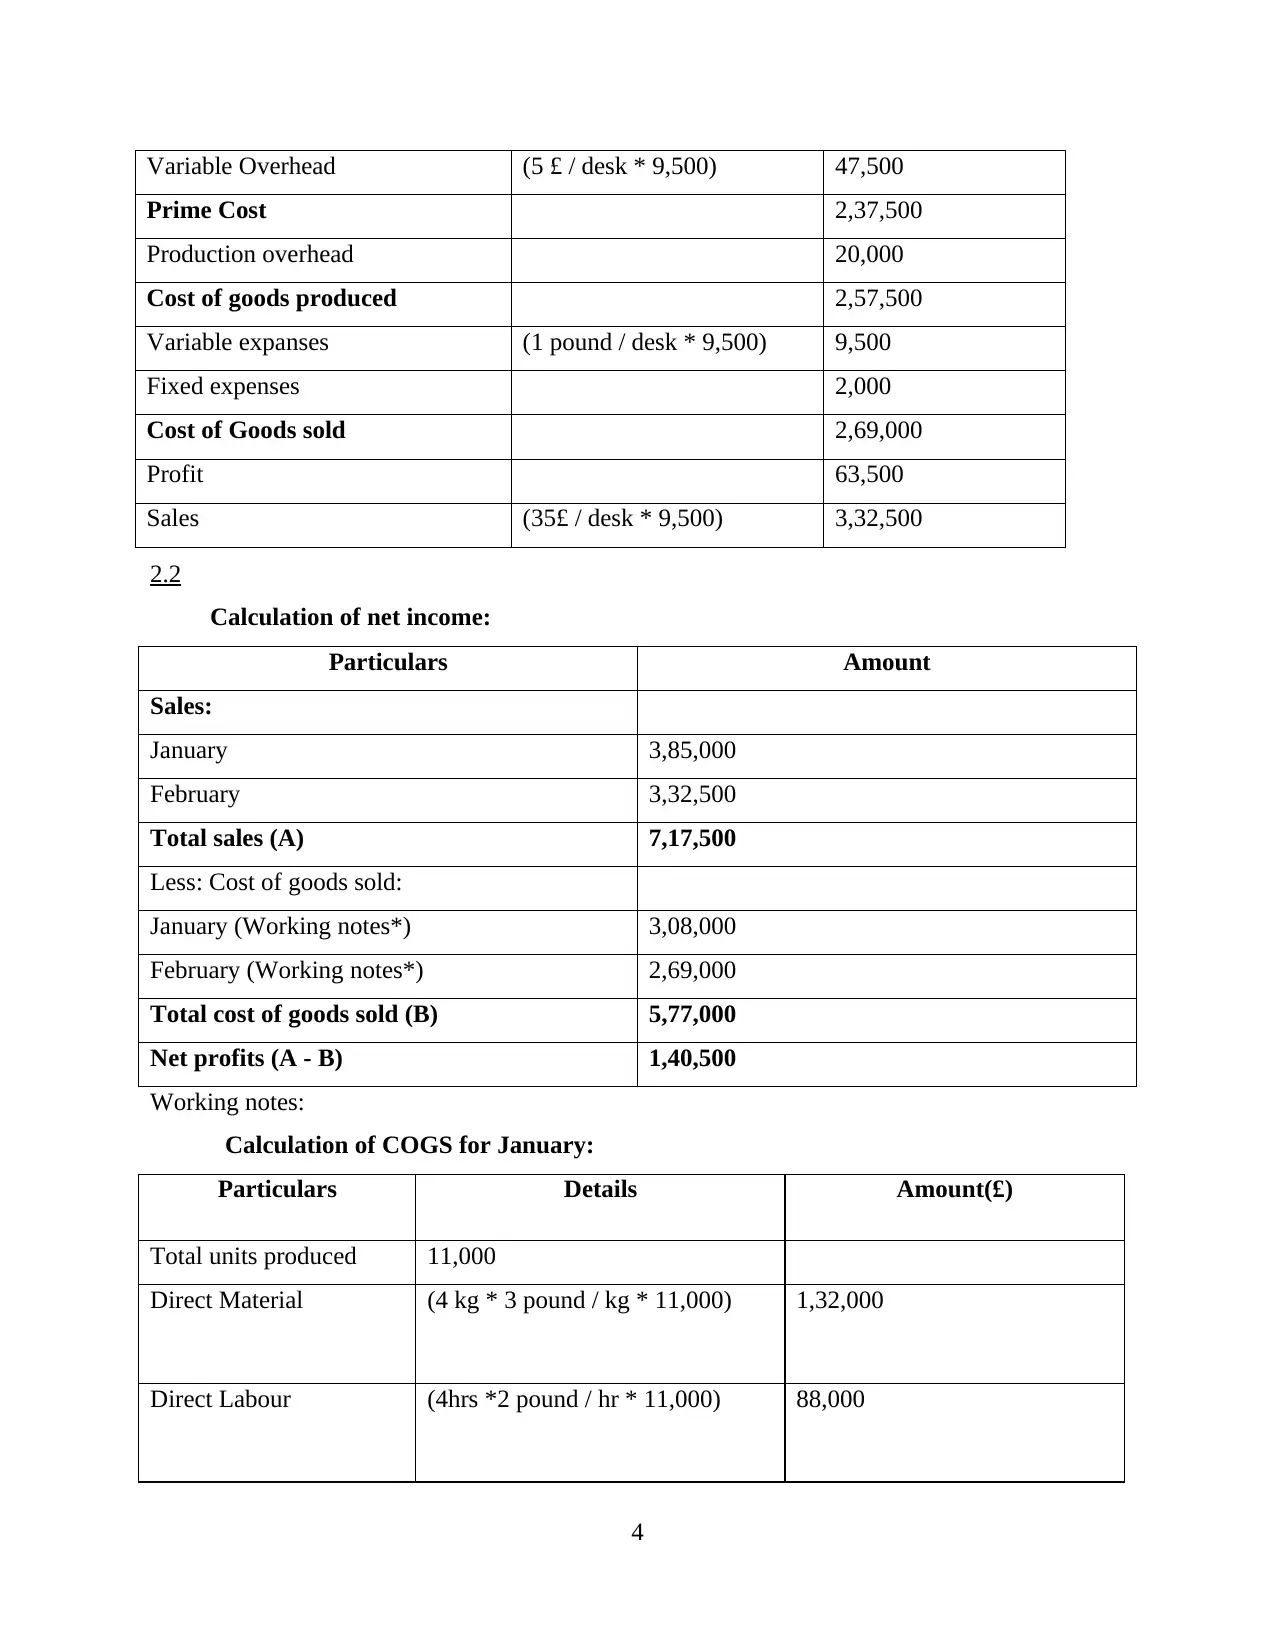
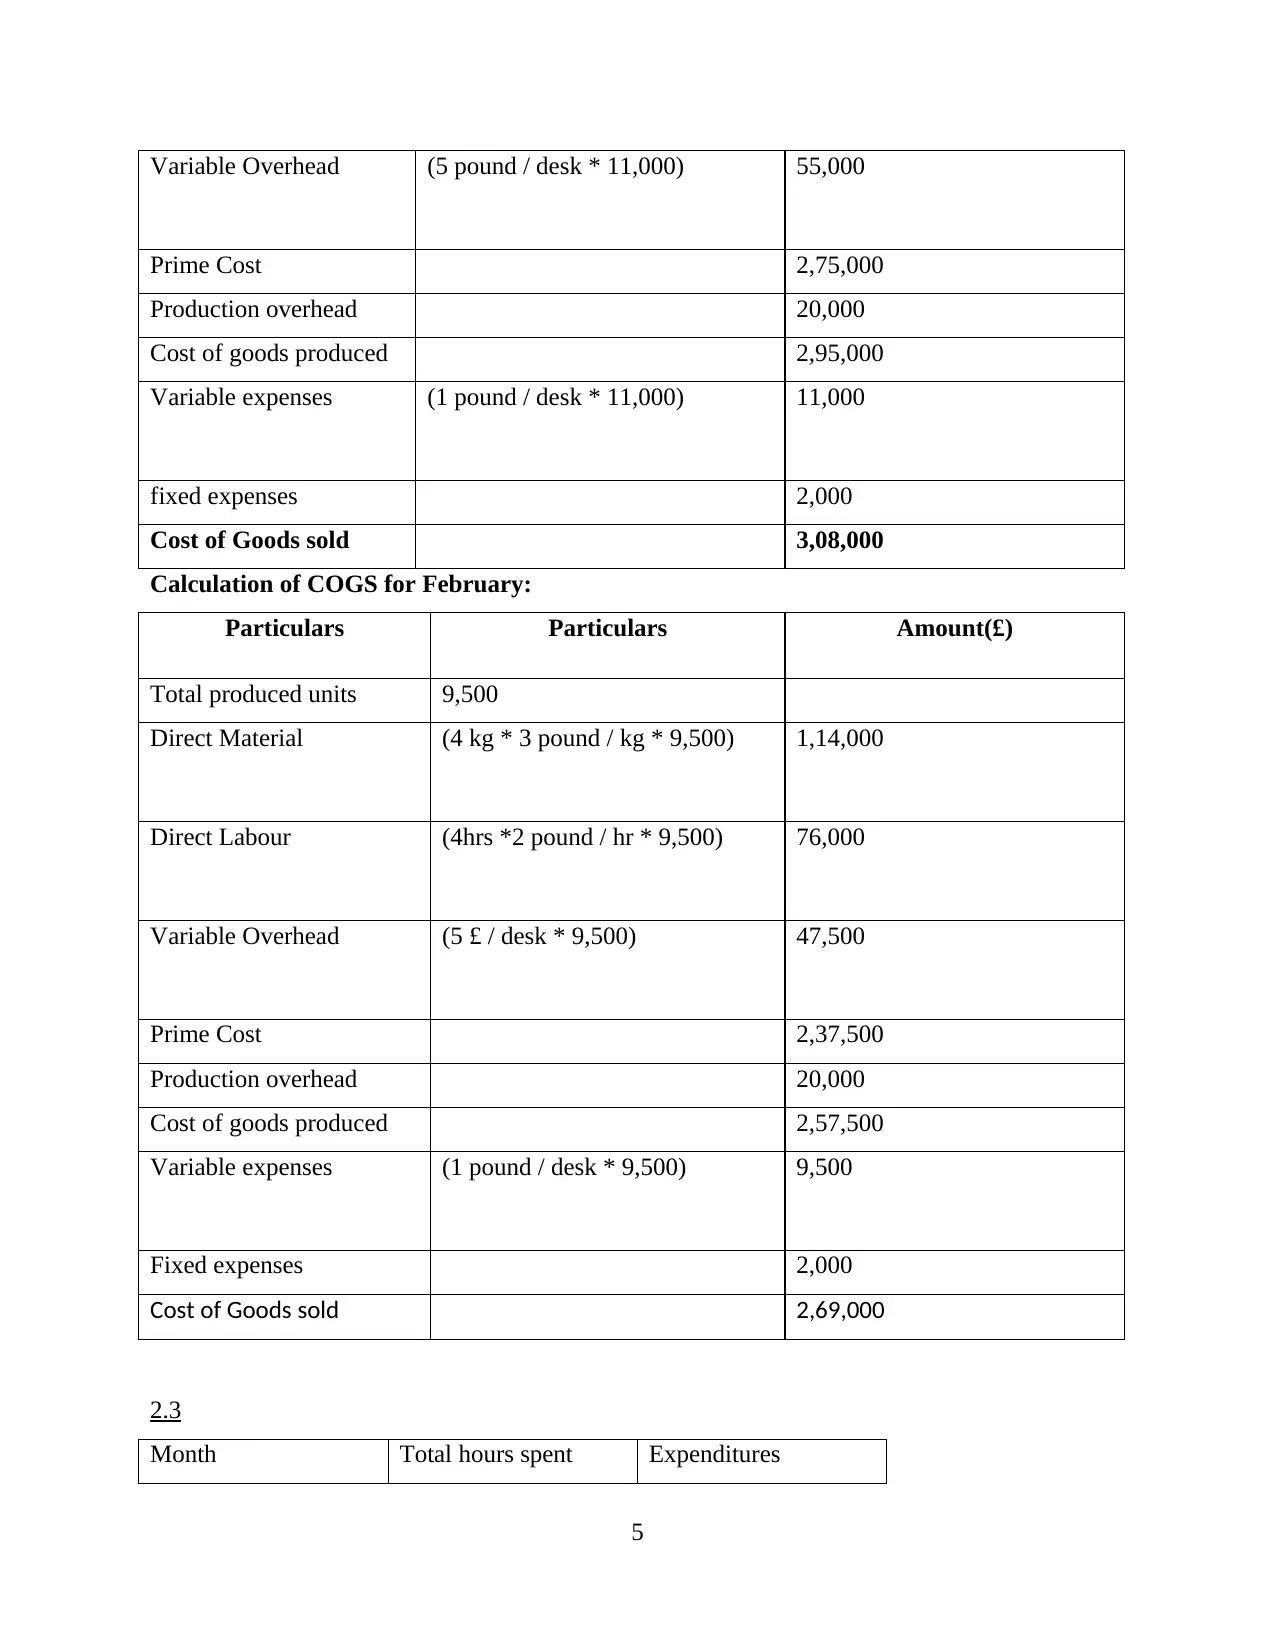
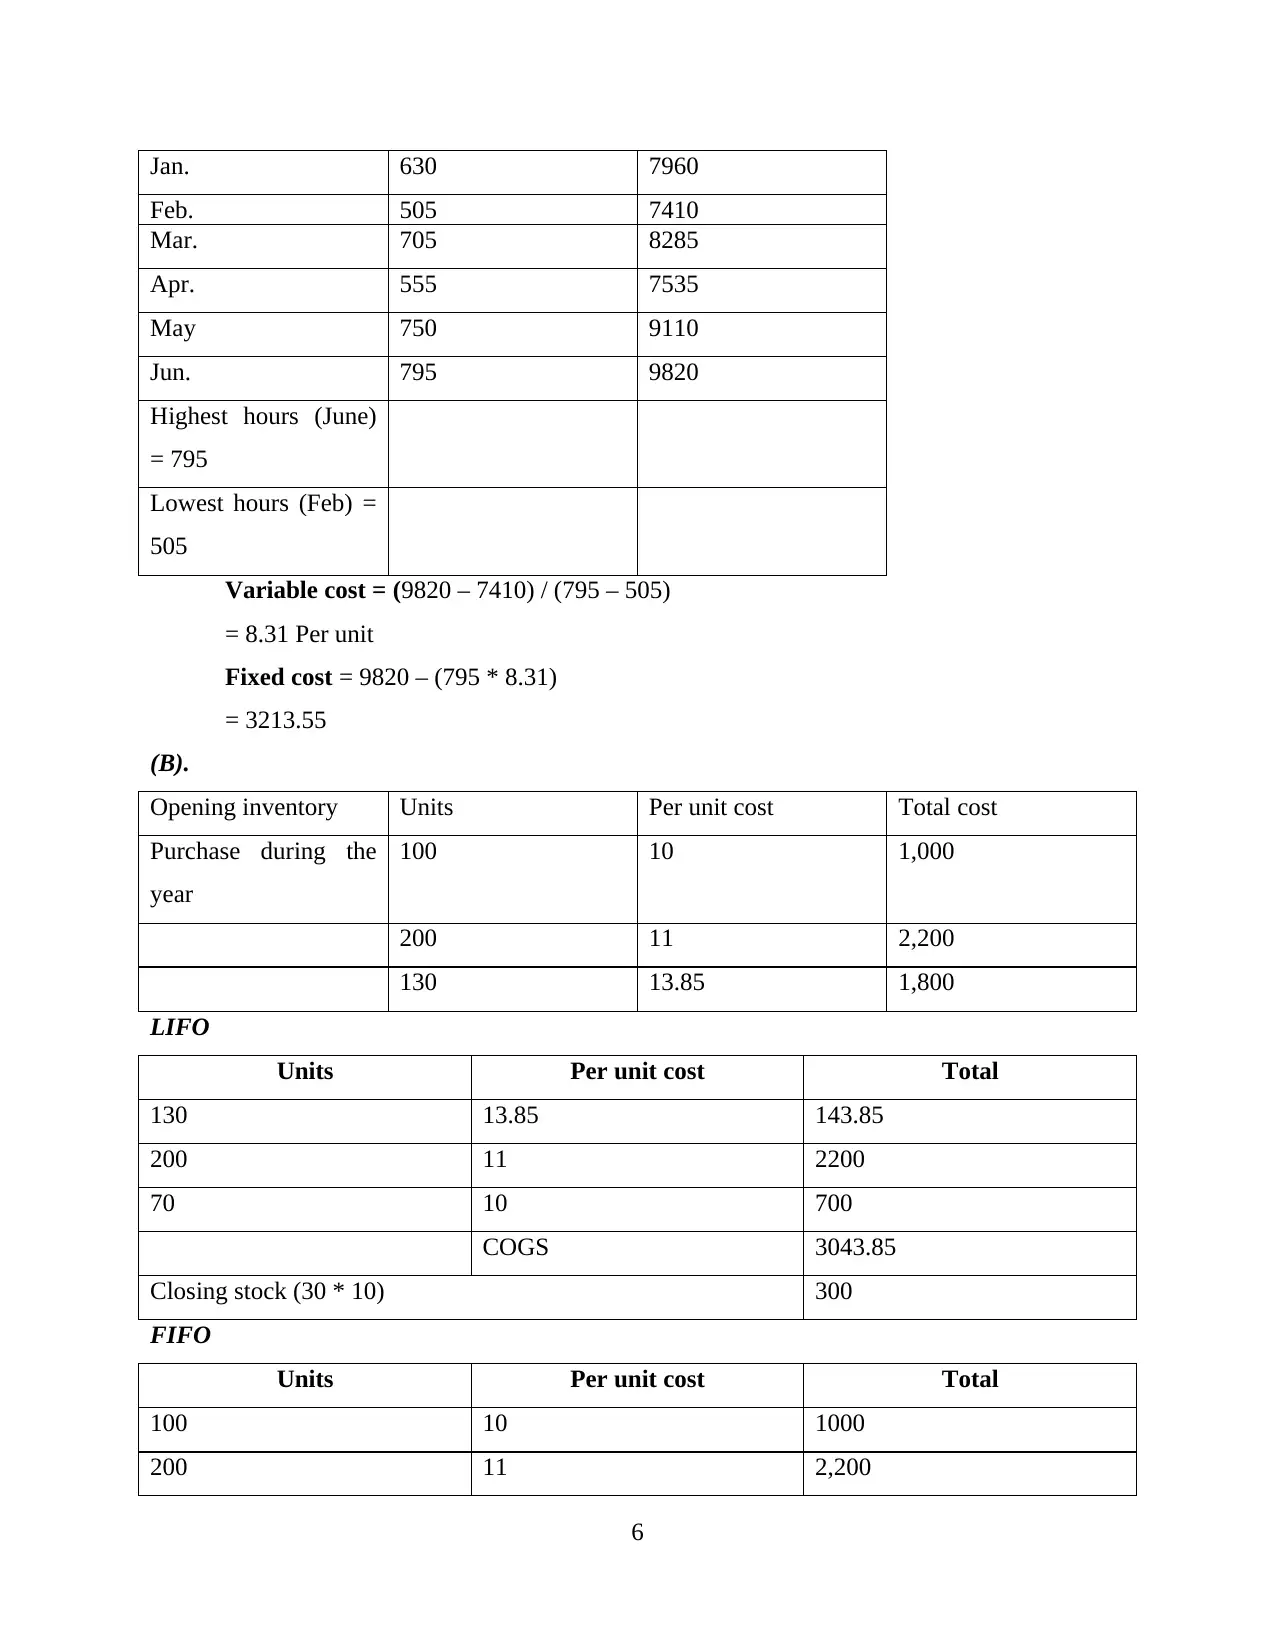
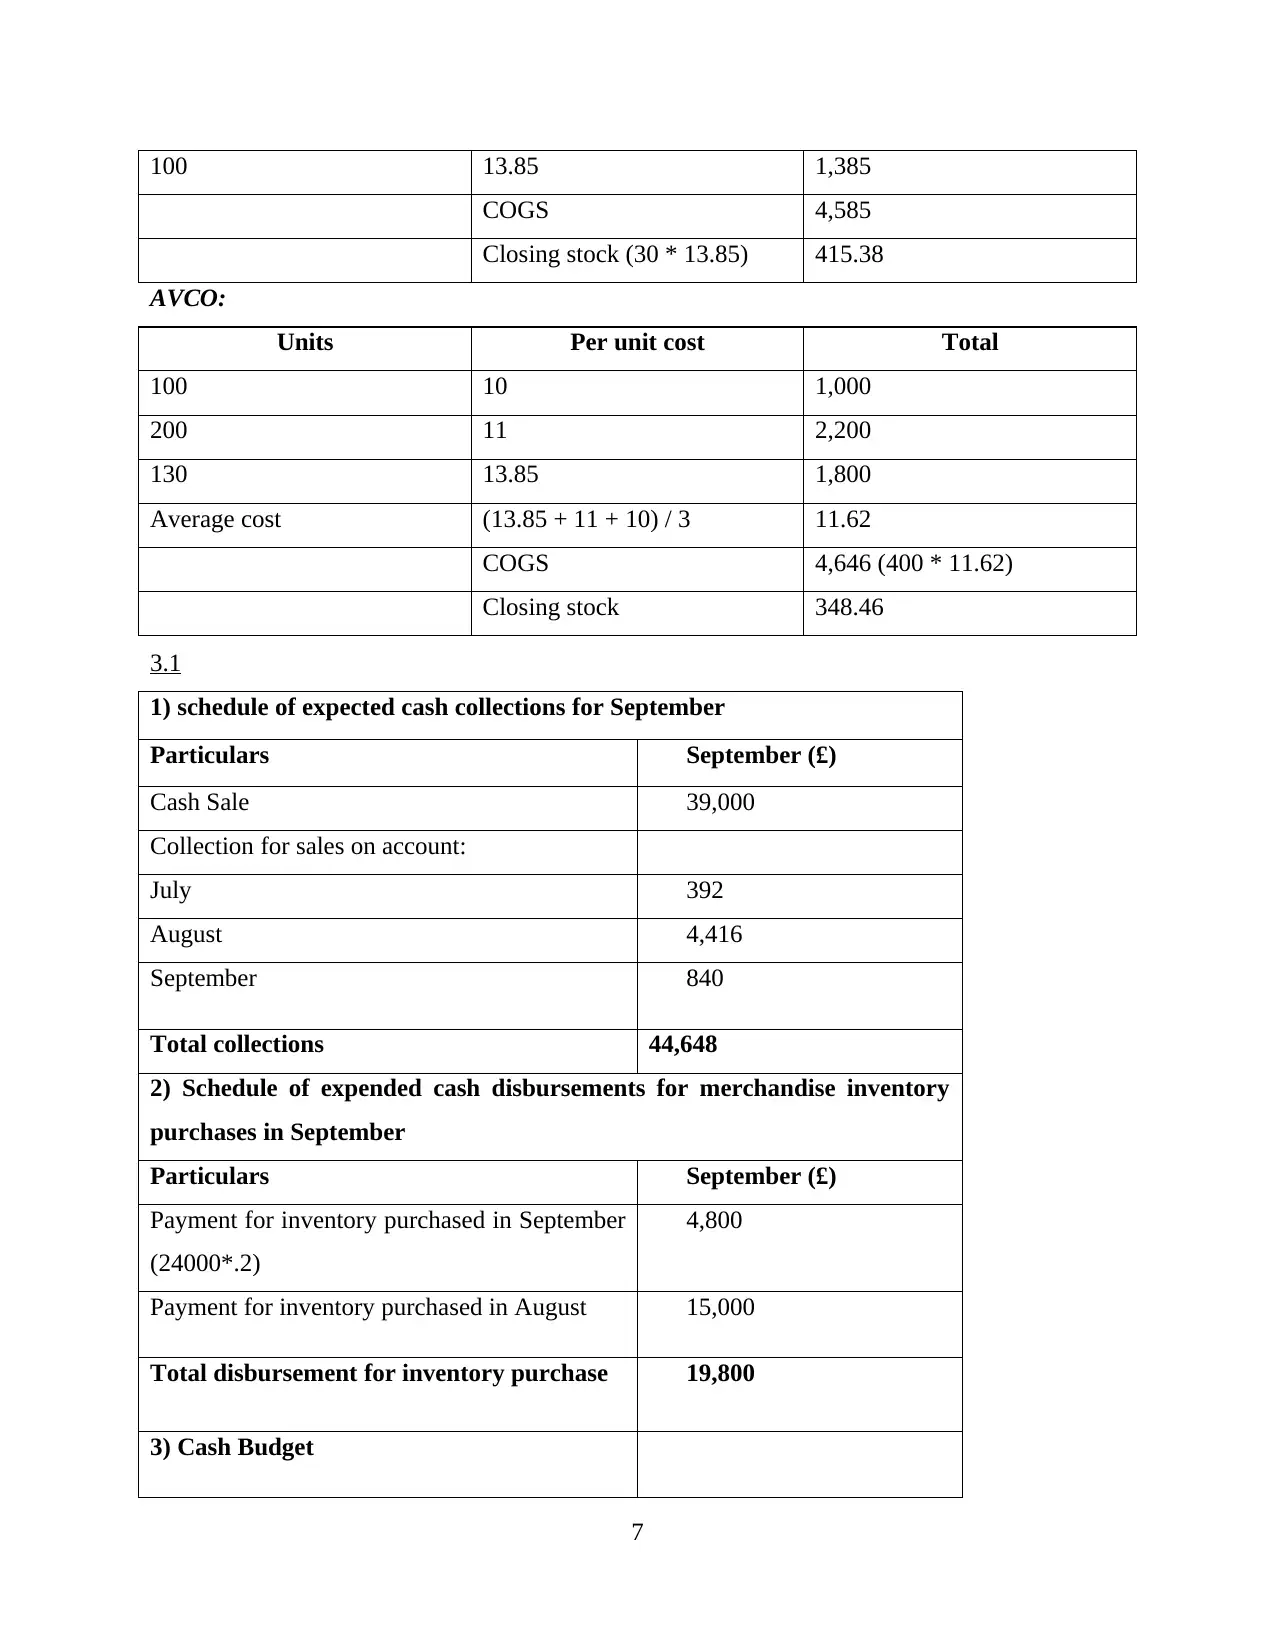
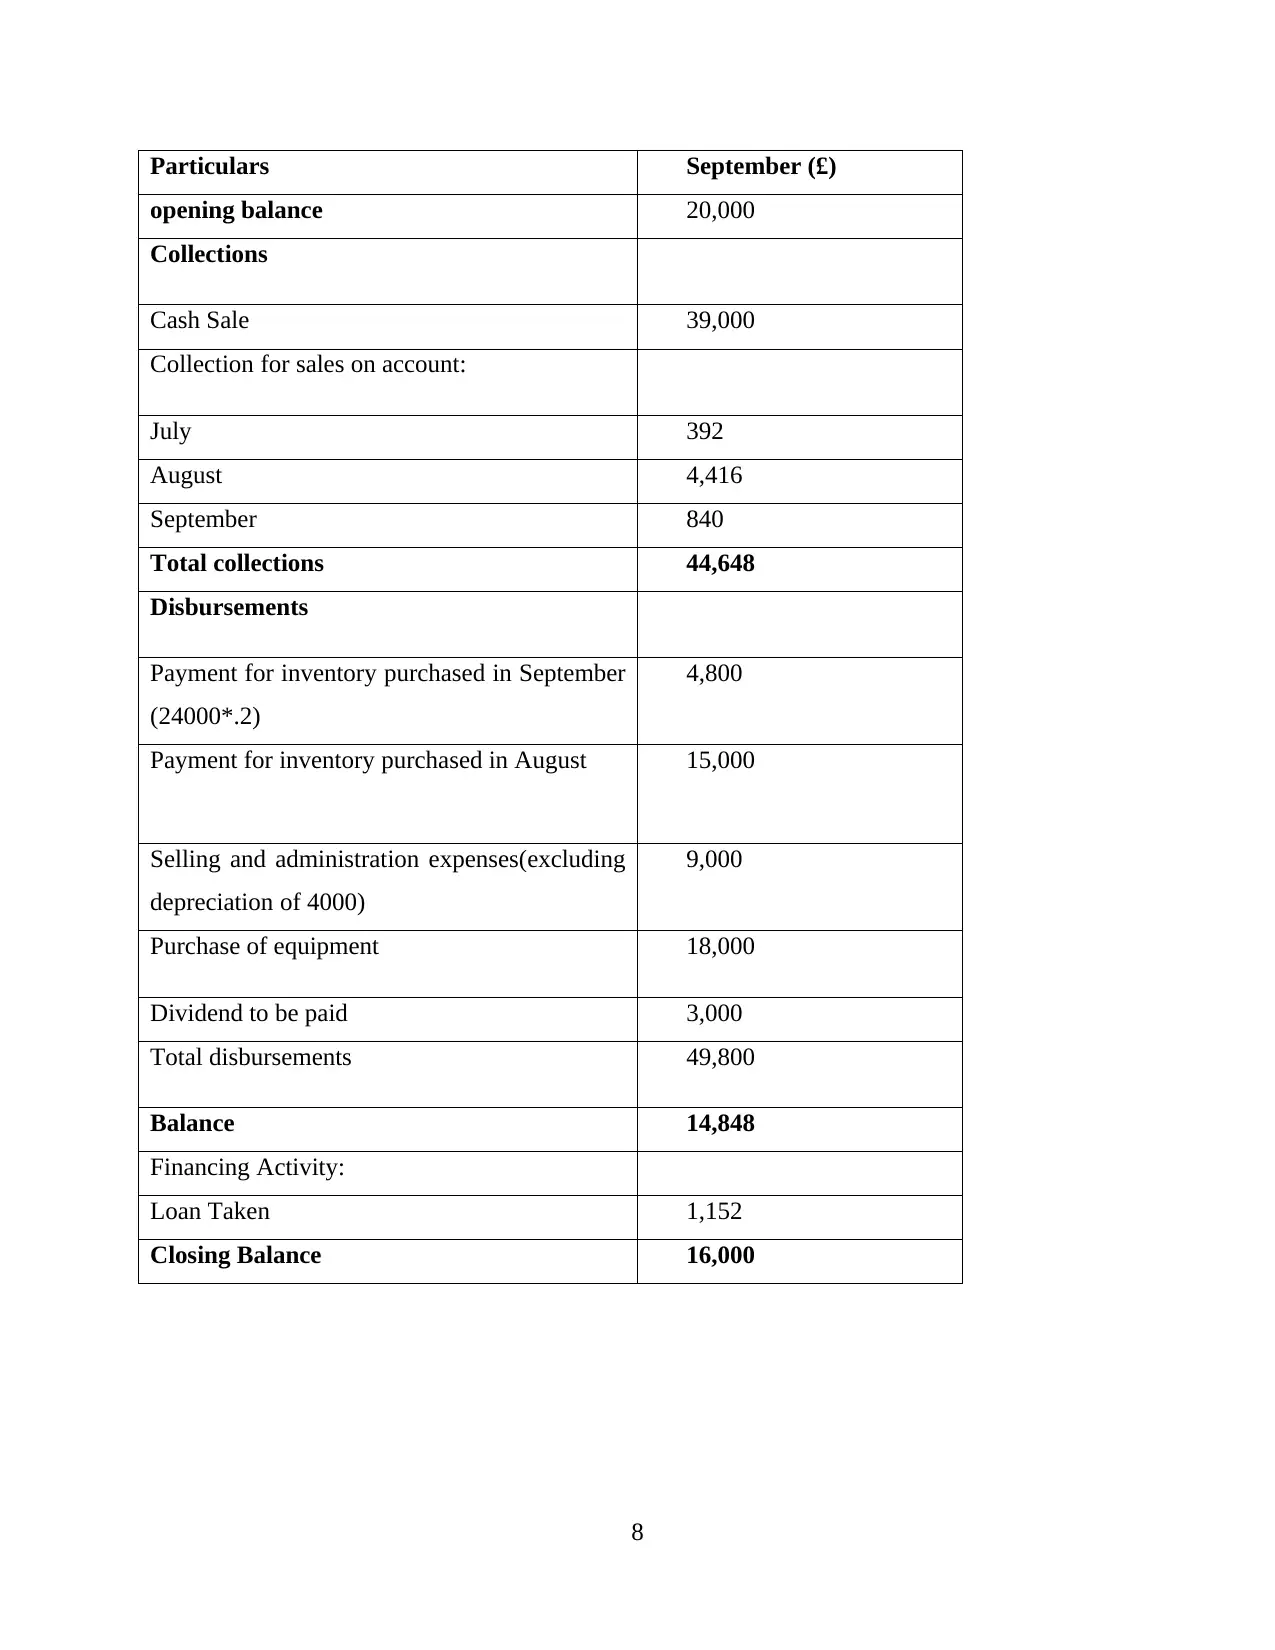
This report provides a comprehensive analysis of management accounting principles and techniques. It begins with an examination of costing methods, including marginal and absorption costing, providing detailed calculations and comparisons for January and February production periods. The report then delves into the calculation of net income using absorption costing, followed by an analysis of cost behavior, specifically focusing on variable and fixed costs using high-low method and the calculation of the variable and fixed costs. Furthermore, it explores inventory valuation methods, such as LIFO, FIFO, and AVCO, providing calculations for each method to determine cost of goods sold and closing stock. Finally, the report concludes with a cash budget analysis, including expected cash collections, cash disbursements, and financing activities, to assess the financial performance and cash flow management of a business.
Document Page
Management
Accounting
tabler-icon-diamond-filled.svg

Paraphrase This Document

Need a fresh take? Get an instant paraphrase of this document with our AI Paraphraser
Document Page
Table of Contents
Table of Contents.............................................................................................................................2
TASK 2............................................................................................................................................1
2.1................................................................................................................................................1
2.2................................................................................................................................................4
2.3................................................................................................................................................5
3.1................................................................................................................................................7
Document Page
TASK 2
2.1
Marginal costing:
January
Particulars Details Amount (£)
Total production units 11,000
Sales price per desk 35 (Per Desk)
Variable cost per desk:
Cost of direct material (4 kg * 3 pound / desk) 12 (Per Desk)
Cost of direct Labour (4hrs *2pound / hr) 8 (Per Desk)
Variable overhead 5 (Per Desk)
Variable sales overhead 1 (Per Desk)
Contribution 9 (Per Desk)
Total contribution (11,000 * 9) 99,000
Fixed costs
Production overhead Working notes* 22,000
Sales overhead 2,000
Profit (99,000 – 22,000 – 2,000) 75,000
1
Document Page
February
Particulars Particulars Amount (£)
Total Units Produced 9,500
Sales price per desk 35 (Per desk)
Variable cost per desk:
Direct material (4kg*3pound/desk) 12 (Per desk)
Direct Labour (4 hrs* 2pound/hr 8 (Per desk)
Variable overhead 5 (Per desk)
Variable sales overhead 1 (Per desk)
Contribution 9 (Per desk)
Total contribution (9500 * 9) 85,500
Fixed costs
Production overhead 19,000
Sales overhead 2,000
Profit (85,500 – 19,000 – 2,000) 64,500
Working notes:
All the overheads that are related to production are calculated by the average production
for each month which is 10000 units.
Calculation of the overheads for January is as follows:
2
tabler-icon-diamond-filled.svg

Paraphrase This Document

Need a fresh take? Get an instant paraphrase of this document with our AI Paraphraser
Document Page
= (20000 / 10000) * 11000
= 22000
Calculation of overheads for February month of is as follows:
= (20000 / 10000) * 9500
= 19000
Absorption costing:
January
Particulars Details Amount (£)
Total units produced 11,000
Direct Material (4 kg * 3 pound / kg *
11,000)
1,32,000
Direct Labour (4hrs *2 pound / hr * 11,000) 88,000
Variable Overhead (5 £ / desk * 11,000) 55,000
Prime Cost 2,75,000
Production overhead 20,000
Cost of goods produced 2,95,000
Variable expenses (1 pound / desk * 11,000) 11,000
Fixed expenses 2,000
Cost of Goods sold 3,08,000
Profit 77,000
Sales (35£ / desk * 11,000) 3,85,000
February
Particulars Details Amount (£)
Total Production units 9,500
Direct Material (4 kg * 3 pound / kg *
9,500)
1,14,000
Direct Labour (4hrs *2 pound / hr * 9,500) 76,000
3
Document Page
Variable Overhead (5 £ / desk * 9,500) 47,500
Prime Cost 2,37,500
Production overhead 20,000
Cost of goods produced 2,57,500
Variable expanses (1 pound / desk * 9,500) 9,500
Fixed expenses 2,000
Cost of Goods sold 2,69,000
Profit 63,500
Sales (35£ / desk * 9,500) 3,32,500
2.2
Calculation of net income:
Particulars Amount
Sales:
January 3,85,000
February 3,32,500
Total sales (A) 7,17,500
Less: Cost of goods sold:
January (Working notes*) 3,08,000
February (Working notes*) 2,69,000
Total cost of goods sold (B) 5,77,000
Net profits (A - B) 1,40,500
Working notes:
Calculation of COGS for January:
Particulars Details Amount(£)
Total units produced 11,000
Direct Material (4 kg * 3 pound / kg * 11,000) 1,32,000
Direct Labour (4hrs *2 pound / hr * 11,000) 88,000
4
Document Page
Variable Overhead (5 pound / desk * 11,000) 55,000
Prime Cost 2,75,000
Production overhead 20,000
Cost of goods produced 2,95,000
Variable expenses (1 pound / desk * 11,000) 11,000
fixed expenses 2,000
Cost of Goods sold 3,08,000
Calculation of COGS for February:
Particulars Particulars Amount(£)
Total produced units 9,500
Direct Material (4 kg * 3 pound / kg * 9,500) 1,14,000
Direct Labour (4hrs *2 pound / hr * 9,500) 76,000
Variable Overhead (5 £ / desk * 9,500) 47,500
Prime Cost 2,37,500
Production overhead 20,000
Cost of goods produced 2,57,500
Variable expenses (1 pound / desk * 9,500) 9,500
Fixed expenses 2,000
Cost of Goods sold 2,69,000
2.3
Month Total hours spent Expenditures
5
tabler-icon-diamond-filled.svg

Paraphrase This Document

Need a fresh take? Get an instant paraphrase of this document with our AI Paraphraser
Document Page
Jan. 630 7960
Feb. 505 7410
Mar. 705 8285
Apr. 555 7535
May 750 9110
Jun. 795 9820
Highest hours (June)
= 795
Lowest hours (Feb) =
505
Variable cost = (9820 – 7410) / (795 – 505)
= 8.31 Per unit
Fixed cost = 9820 – (795 * 8.31)
= 3213.55
(B).
Opening inventory Units Per unit cost Total cost
Purchase during the
year
100 10 1,000
200 11 2,200
130 13.85 1,800
LIFO
Units Per unit cost Total
130 13.85 143.85
200 11 2200
70 10 700
COGS 3043.85
Closing stock (30 * 10) 300
FIFO
Units Per unit cost Total
100 10 1000
200 11 2,200
6
Document Page
100 13.85 1,385
COGS 4,585
Closing stock (30 * 13.85) 415.38
AVCO:
Units Per unit cost Total
100 10 1,000
200 11 2,200
130 13.85 1,800
Average cost (13.85 + 11 + 10) / 3 11.62
COGS 4,646 (400 * 11.62)
Closing stock 348.46
3.1
1) schedule of expected cash collections for September
Particulars September (£)
Cash Sale 39,000
Collection for sales on account:
July 392
August 4,416
September 840
Total collections 44,648
2) Schedule of expended cash disbursements for merchandise inventory
purchases in September
Particulars September (£)
Payment for inventory purchased in September
(24000*.2)
4,800
Payment for inventory purchased in August 15,000
Total disbursement for inventory purchase 19,800
3) Cash Budget
7
Document Page
Particulars September (£)
opening balance 20,000
Collections
Cash Sale 39,000
Collection for sales on account:
July 392
August 4,416
September 840
Total collections 44,648
Disbursements
Payment for inventory purchased in September
(24000*.2)
4,800
Payment for inventory purchased in August 15,000
Selling and administration expenses(excluding
depreciation of 4000)
9,000
Purchase of equipment 18,000
Dividend to be paid 3,000
Total disbursements 49,800
Balance 14,848
Financing Activity:
Loan Taken 1,152
Closing Balance 16,000
8
chevron_up_icon
1 out of 10
circle_padding
hide_on_mobile
zoom_out_icon
[object Object]