Management Accounting Report: Costing, Budgeting, and Variance
VerifiedAdded on 2019/12/03
|16
|4489
|370
Report
AI Summary
This report provides a comprehensive overview of management accounting principles. It begins by classifying costs based on elements, function, nature, and behavior, and then calculates job and unit costs using absorption costing. The report then delves into budgeting, including the preparation of a cash budget and variance analysis. Performance indicators are discussed to identify areas for improvement, along with strategies for cost reduction, value enhancement, and quality improvement. The report covers cost sheet preparation and variance analysis. Finally, the report identifies responsibility centers and concludes with recommendations for corrective actions based on the variance analysis. The report is rich in tables and calculations to support the analysis.
MANAGEMENT
ACCOUNTING
ACCOUNTING
Paraphrase This Document
Need a fresh take? Get an instant paraphrase of this document with our AI Paraphraser
TABLE OF CONTENTS
INTRODUCTION...........................................................................................................................4
TASK 1............................................................................................................................................4
1.1 Classification of costs on the basis of element, function, nature and behavior...............4
1.2 Calculation of job cost and unit cost................................................................................5
1.3 Calculation of the cost by using absorption costing technique........................................5
1.4 Calculation of overhead absorption rate using direct labour hours..................................7
TASK 2............................................................................................................................................8
2.1 Preparation of cost sheet and variance analysis..............................................................8
2.2 various performance indicators used to identify areas of potential improvements.........9
2.3 Ways to reduce cost, enhance value and quality...........................................................10
3.1 Nature and purpose of budgeting process......................................................................10
3.2 Appropriate budgeting method for the organization and its need..................................11
3.3 Material purchase budget and production requirement budget......................................12
3.4 preparation of cash budget.............................................................................................12
TASK 4..........................................................................................................................................13
4.1, 4.2 Variance analysis and recommendation corrective actions....................................13
4.3 Identifications of responsibility centers.........................................................................14
CONCLCUSION...........................................................................................................................14
REFERENCES..............................................................................................................................15
INDEX OF TABLES
Table 1: Calculation of total cost and per unit cost for a job...........................................................5
Table 2: Calculation of overhead absorption rate using direct labour hours...................................7
Table 3: Preparation of budgeted and actual cost ( In £).................................................................7
Table 4: Variance analysis...............................................................................................................8
Table 5: Production budget for july, august and september ( In Units).........................................12
Table 6: Material purchase budget ( In Kg)...................................................................................12
Table 7: preparation of Cash budget..............................................................................................12
Table 8: Calculation of budgeted cost for 4000 units....................................................................13
Table 9: operating statement reconciling both budgeted and actual results..................................13
Table 10: Calculation of per unit variances...................................................................................13
⊘ This is a preview!⊘
Do you want full access?
Subscribe today to unlock all pages.
Trusted by 1+ million students worldwide
INTRODUCTION
This report is prepared on management accounting concepts. In this report costs are
discussed and classified in to various categories like function, nature and behavior. In the report
budget is also prepared and their results are also interpreted. By doing this an attempt is made to
identify possible reason for positive and negative variance in the budget. In the middle part of the
report cash budget is also prepared and under this cash inflow and outflow items are taken in the
budget. Trends in the cash inflows and outflows are analyzed and comments are made in respect
to these trends. At the ends of the report variance analysis is done in terms of sales, material and
labors. Along with this, responsibility centers are also discussed in detail at the end of the report.
TASK 1
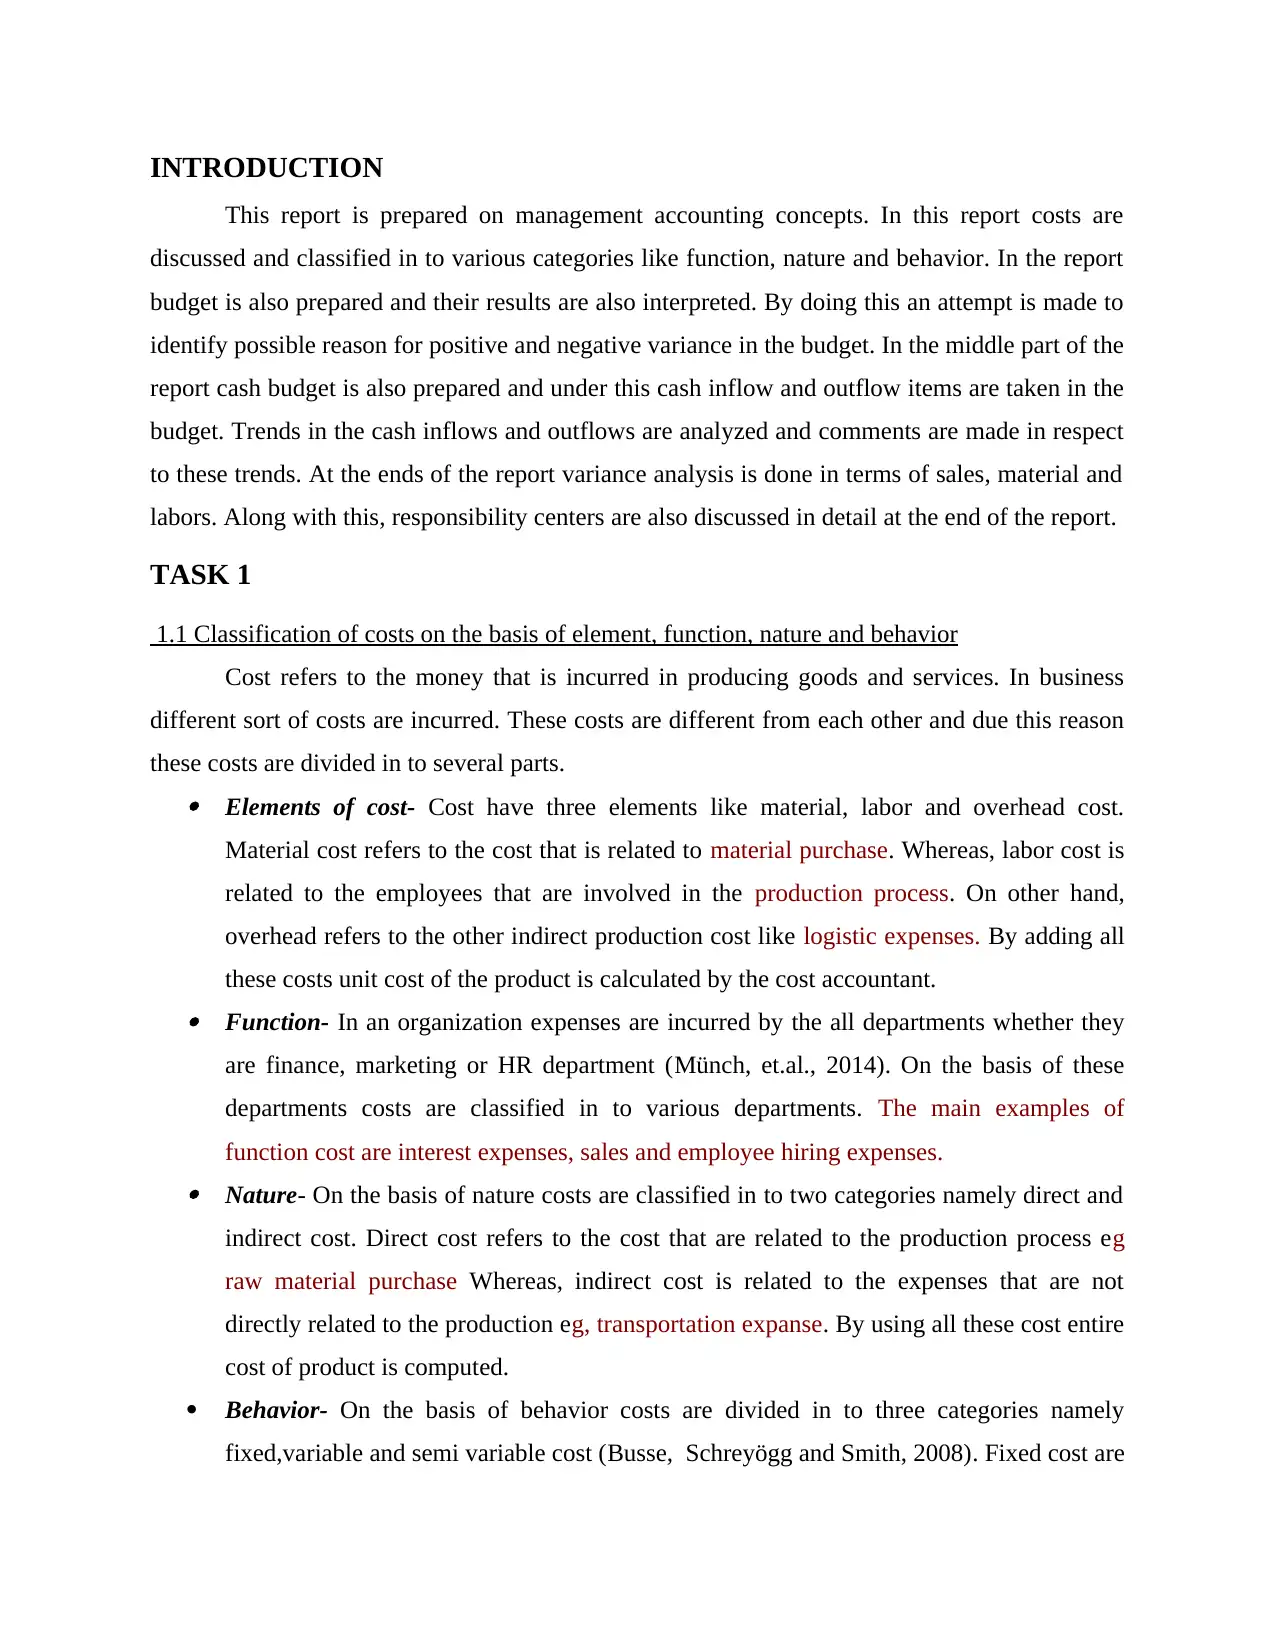
1.1 Classification of costs on the basis of element, function, nature and behavior
Cost refers to the money that is incurred in producing goods and services. In business
different sort of costs are incurred. These costs are different from each other and due this reason
these costs are divided in to several parts. Elements of cost- Cost have three elements like material, labor and overhead cost.
Material cost refers to the cost that is related to material purchase. Whereas, labor cost is
related to the employees that are involved in the production process. On other hand,
overhead refers to the other indirect production cost like logistic expenses. By adding all
these costs unit cost of the product is calculated by the cost accountant. Function- In an organization expenses are incurred by the all departments whether they
are finance, marketing or HR department (Münch, et.al., 2014). On the basis of these
departments costs are classified in to various departments. The main examples of
function cost are interest expenses, sales and employee hiring expenses. Nature- On the basis of nature costs are classified in to two categories namely direct and
indirect cost. Direct cost refers to the cost that are related to the production process eg
raw material purchase Whereas, indirect cost is related to the expenses that are not
directly related to the production eg, transportation expanse. By using all these cost entire
cost of product is computed.
Behavior- On the basis of behavior costs are divided in to three categories namely
fixed,variable and semi variable cost (Busse, Schreyögg and Smith, 2008). Fixed cost are
This report is prepared on management accounting concepts. In this report costs are
discussed and classified in to various categories like function, nature and behavior. In the report
budget is also prepared and their results are also interpreted. By doing this an attempt is made to
identify possible reason for positive and negative variance in the budget. In the middle part of the
report cash budget is also prepared and under this cash inflow and outflow items are taken in the
budget. Trends in the cash inflows and outflows are analyzed and comments are made in respect
to these trends. At the ends of the report variance analysis is done in terms of sales, material and
labors. Along with this, responsibility centers are also discussed in detail at the end of the report.
TASK 1
1.1 Classification of costs on the basis of element, function, nature and behavior
Cost refers to the money that is incurred in producing goods and services. In business
different sort of costs are incurred. These costs are different from each other and due this reason
these costs are divided in to several parts. Elements of cost- Cost have three elements like material, labor and overhead cost.
Material cost refers to the cost that is related to material purchase. Whereas, labor cost is
related to the employees that are involved in the production process. On other hand,
overhead refers to the other indirect production cost like logistic expenses. By adding all
these costs unit cost of the product is calculated by the cost accountant. Function- In an organization expenses are incurred by the all departments whether they
are finance, marketing or HR department (Münch, et.al., 2014). On the basis of these
departments costs are classified in to various departments. The main examples of
function cost are interest expenses, sales and employee hiring expenses. Nature- On the basis of nature costs are classified in to two categories namely direct and
indirect cost. Direct cost refers to the cost that are related to the production process eg
raw material purchase Whereas, indirect cost is related to the expenses that are not
directly related to the production eg, transportation expanse. By using all these cost entire
cost of product is computed.
Behavior- On the basis of behavior costs are divided in to three categories namely
fixed,variable and semi variable cost (Busse, Schreyögg and Smith, 2008). Fixed cost are
Paraphrase This Document
Need a fresh take? Get an instant paraphrase of this document with our AI Paraphraser
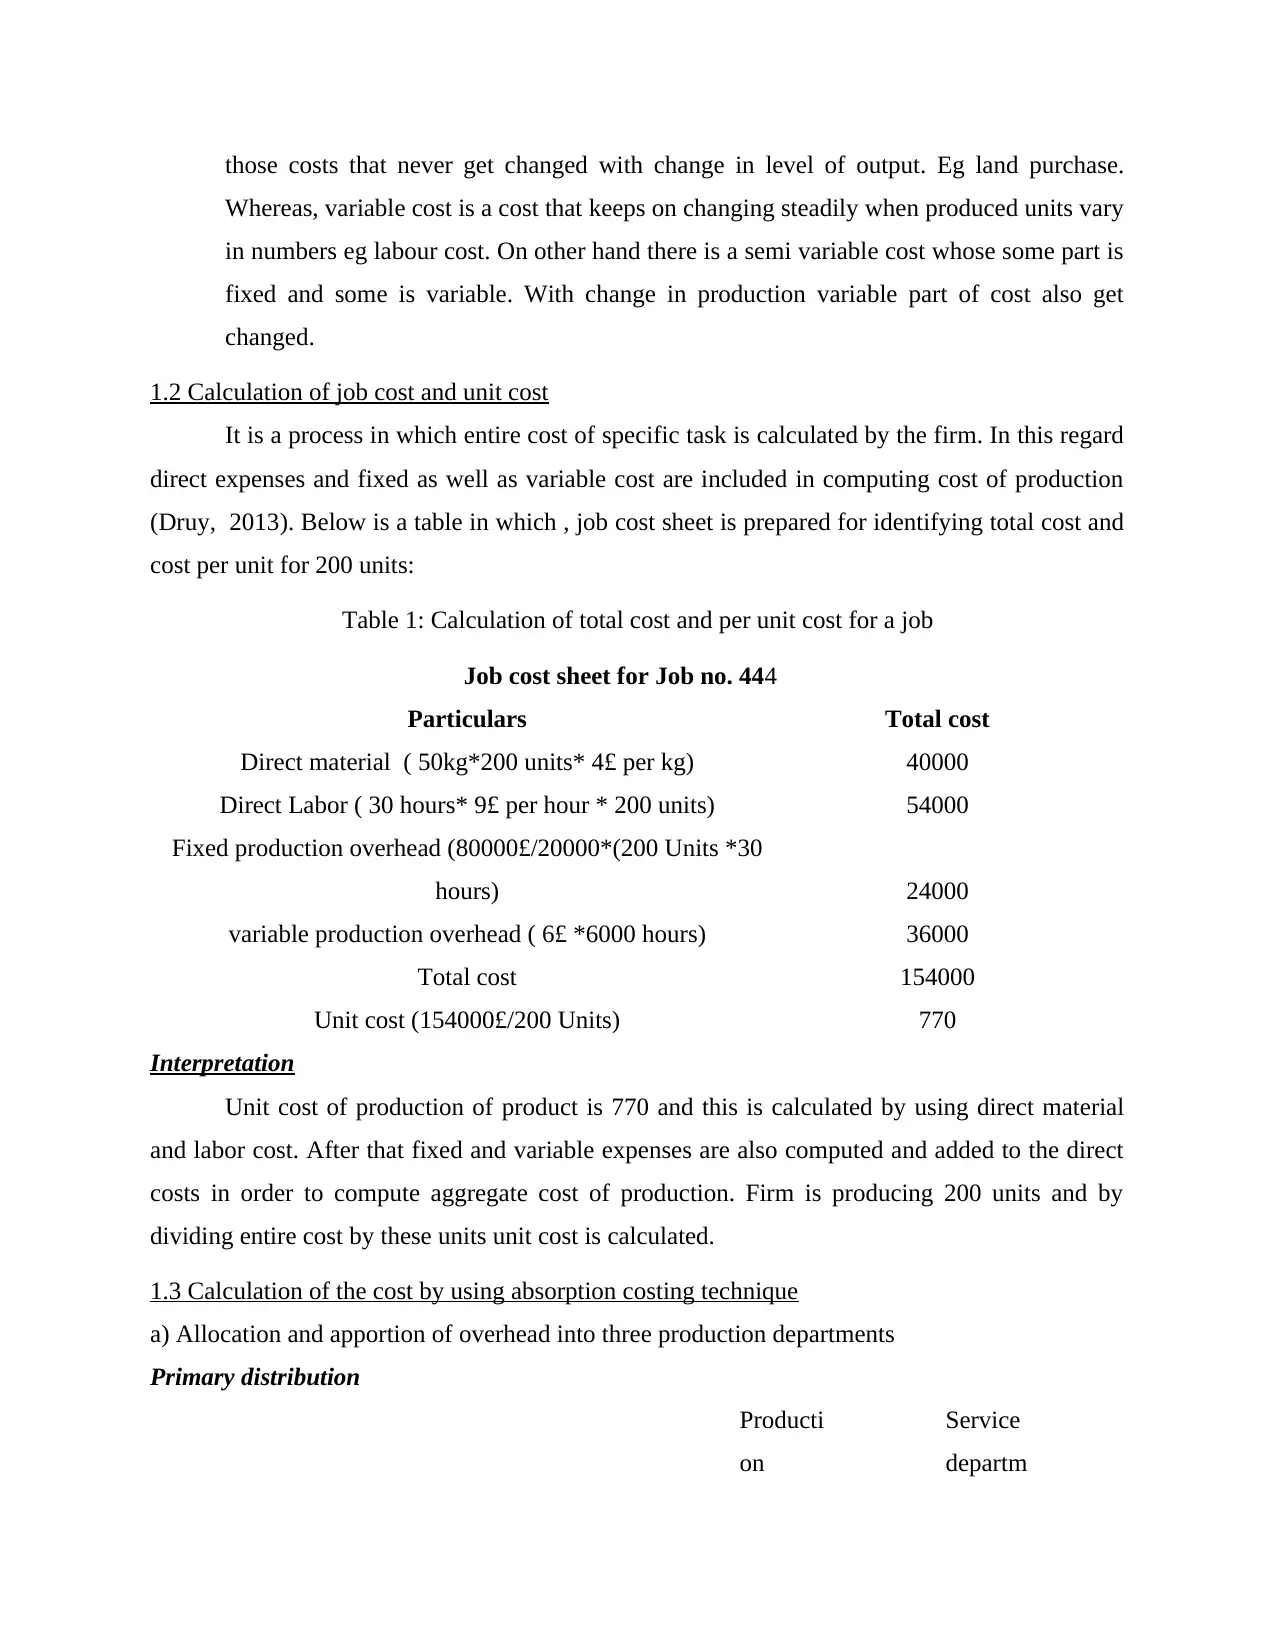
those costs that never get changed with change in level of output. Eg land purchase.
Whereas, variable cost is a cost that keeps on changing steadily when produced units vary
in numbers eg labour cost. On other hand there is a semi variable cost whose some part is
fixed and some is variable. With change in production variable part of cost also get
changed.
1.2 Calculation of job cost and unit cost
It is a process in which entire cost of specific task is calculated by the firm. In this regard
direct expenses and fixed as well as variable cost are included in computing cost of production
(Druy, 2013). Below is a table in which , job cost sheet is prepared for identifying total cost and
cost per unit for 200 units:
Table 1: Calculation of total cost and per unit cost for a job
Job cost sheet for Job no. 444
Particulars Total cost
Direct material ( 50kg*200 units* 4£ per kg) 40000
Direct Labor ( 30 hours* 9£ per hour * 200 units) 54000
Fixed production overhead (80000£/20000*(200 Units *30
hours) 24000
variable production overhead ( 6£ *6000 hours) 36000
Total cost 154000
Unit cost (154000£/200 Units) 770
Interpretation
Unit cost of production of product is 770 and this is calculated by using direct material
and labor cost. After that fixed and variable expenses are also computed and added to the direct
costs in order to compute aggregate cost of production. Firm is producing 200 units and by
dividing entire cost by these units unit cost is calculated.
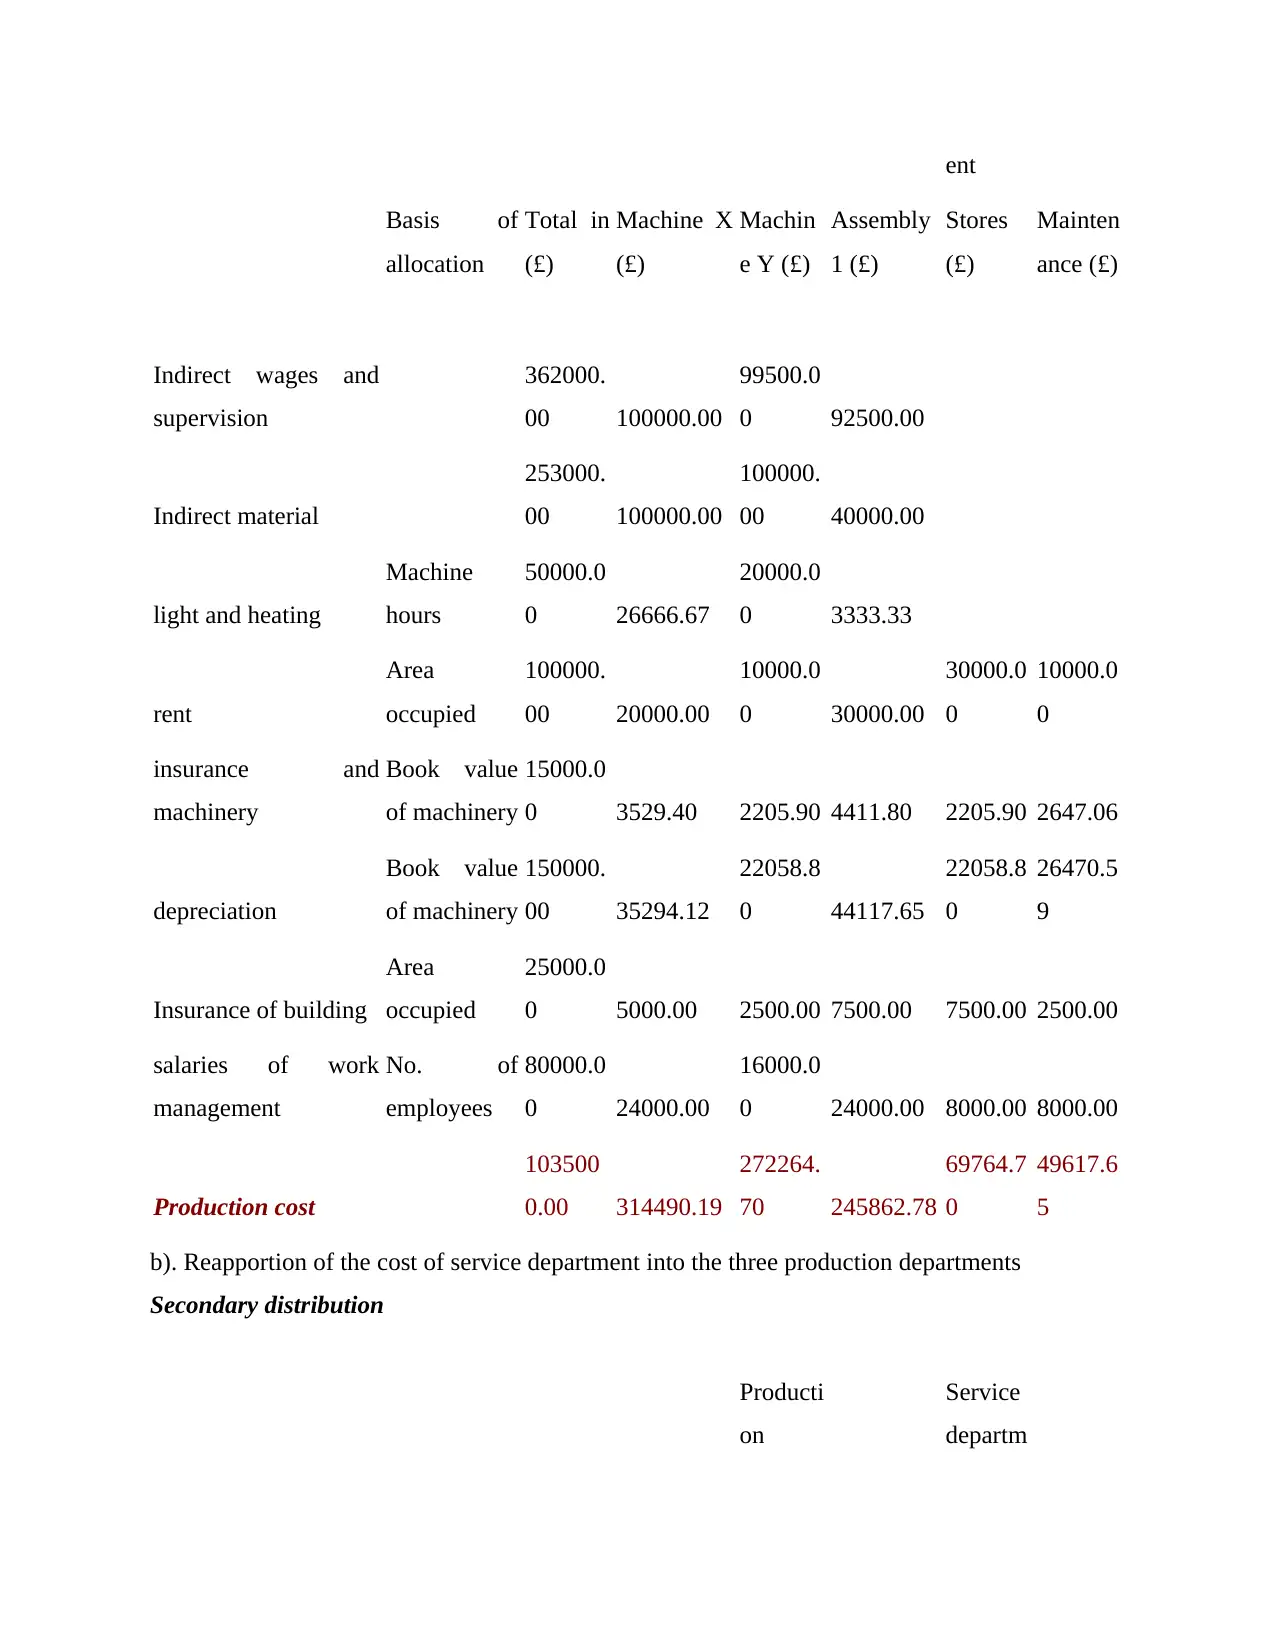
1.3 Calculation of the cost by using absorption costing technique
a) Allocation and apportion of overhead into three production departments
Primary distribution
Producti
on
Service
departm
Whereas, variable cost is a cost that keeps on changing steadily when produced units vary
in numbers eg labour cost. On other hand there is a semi variable cost whose some part is
fixed and some is variable. With change in production variable part of cost also get
changed.
1.2 Calculation of job cost and unit cost
It is a process in which entire cost of specific task is calculated by the firm. In this regard
direct expenses and fixed as well as variable cost are included in computing cost of production
(Druy, 2013). Below is a table in which , job cost sheet is prepared for identifying total cost and
cost per unit for 200 units:
Table 1: Calculation of total cost and per unit cost for a job
Job cost sheet for Job no. 444
Particulars Total cost
Direct material ( 50kg*200 units* 4£ per kg) 40000
Direct Labor ( 30 hours* 9£ per hour * 200 units) 54000
Fixed production overhead (80000£/20000*(200 Units *30
hours) 24000
variable production overhead ( 6£ *6000 hours) 36000
Total cost 154000
Unit cost (154000£/200 Units) 770
Interpretation
Unit cost of production of product is 770 and this is calculated by using direct material
and labor cost. After that fixed and variable expenses are also computed and added to the direct
costs in order to compute aggregate cost of production. Firm is producing 200 units and by
dividing entire cost by these units unit cost is calculated.
1.3 Calculation of the cost by using absorption costing technique
a) Allocation and apportion of overhead into three production departments
Primary distribution
Producti
on
Service
departm
ent
Basis of
allocation
Total in
(£)
Machine X
(£)
Machin
e Y (£)
Assembly
1 (£)
Stores
(£)
Mainten
ance (£)
Indirect wages and
supervision
362000.
00 100000.00
99500.0
0 92500.00
Indirect material
253000.
00 100000.00
100000.
00 40000.00
light and heating
Machine
hours
50000.0
0 26666.67
20000.0
0 3333.33
rent
Area
occupied
100000.
00 20000.00
10000.0
0 30000.00
30000.0
0
10000.0
0
insurance and
machinery
Book value
of machinery
15000.0
0 3529.40 2205.90 4411.80 2205.90 2647.06
depreciation
Book value
of machinery
150000.
00 35294.12
22058.8
0 44117.65
22058.8
0
26470.5
9
Insurance of building
Area
occupied
25000.0
0 5000.00 2500.00 7500.00 7500.00 2500.00
salaries of work
management
No. of
employees
80000.0
0 24000.00
16000.0
0 24000.00 8000.00 8000.00
Production cost
103500
0.00 314490.19
272264.
70 245862.78
69764.7
0
49617.6
5
b). Reapportion of the cost of service department into the three production departments
Secondary distribution
Producti
on
Service
departm
⊘ This is a preview!⊘
Do you want full access?
Subscribe today to unlock all pages.
Trusted by 1+ million students worldwide
ent
Basis of
allocation
Total in
(£) Machine X
Machin
e Y (£)
Assembly
1 (£)
Stores
(£)
Mainten
ance (£)
Primary distribution
(Earlier table)
103500
0.00 314490.19
272264.
70 245862.78
69764.7
0
49617.6
5
Stores
Direct
material 34882.35
26161.7
6 8720.59 69764.7 -
Maintenance
Direct
machine
hours 23816.47
15877.6
5 9923.53 -
49617.6
5
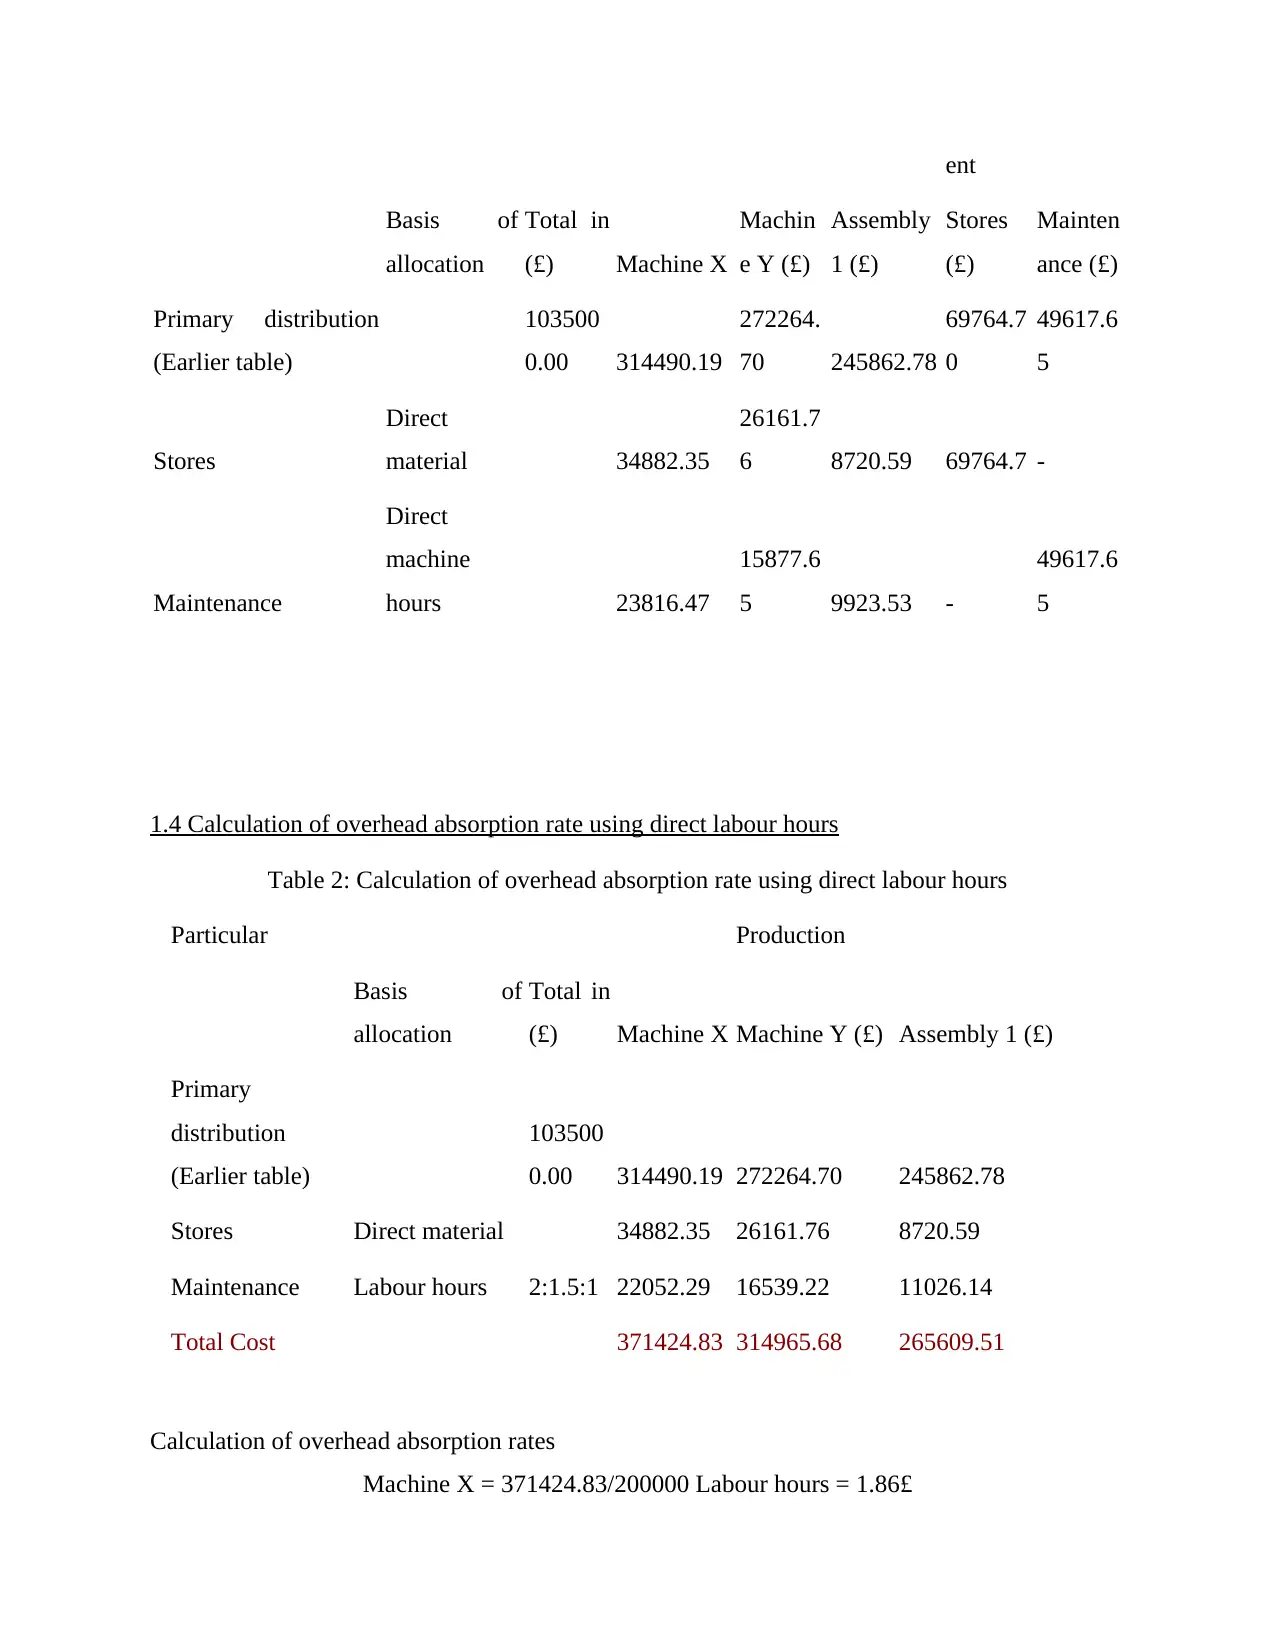
1.4 Calculation of overhead absorption rate using direct labour hours
Table 2: Calculation of overhead absorption rate using direct labour hours
Particular Production
Basis of
allocation
Total in
(£) Machine X Machine Y (£) Assembly 1 (£)
Primary
distribution
(Earlier table)
103500
0.00 314490.19 272264.70 245862.78
Stores Direct material 34882.35 26161.76 8720.59
Maintenance Labour hours 2:1.5:1 22052.29 16539.22 11026.14
Total Cost 371424.83 314965.68 265609.51
Calculation of overhead absorption rates
Machine X = 371424.83/200000 Labour hours = 1.86£
Basis of
allocation
Total in
(£) Machine X
Machin
e Y (£)
Assembly
1 (£)
Stores
(£)
Mainten
ance (£)
Primary distribution
(Earlier table)
103500
0.00 314490.19
272264.
70 245862.78
69764.7
0
49617.6
5
Stores
Direct
material 34882.35
26161.7
6 8720.59 69764.7 -
Maintenance
Direct
machine
hours 23816.47
15877.6
5 9923.53 -
49617.6
5
1.4 Calculation of overhead absorption rate using direct labour hours
Table 2: Calculation of overhead absorption rate using direct labour hours
Particular Production
Basis of
allocation
Total in
(£) Machine X Machine Y (£) Assembly 1 (£)
Primary
distribution
(Earlier table)
103500
0.00 314490.19 272264.70 245862.78
Stores Direct material 34882.35 26161.76 8720.59
Maintenance Labour hours 2:1.5:1 22052.29 16539.22 11026.14
Total Cost 371424.83 314965.68 265609.51
Calculation of overhead absorption rates
Machine X = 371424.83/200000 Labour hours = 1.86£
Paraphrase This Document
Need a fresh take? Get an instant paraphrase of this document with our AI Paraphraser
machine Y = 314965.68/150000 labour hours = 2.10£
Assembly = 265609.51/100000 labour hours = 2.66£
Difference: In case of labour hour apportion basis the cost is 22052.29£, 16539.22£ and
265609.51£. Whereas, in case of machine hours the maintenance cost for Machine X, Assembly
and Machine Y are 23816.47£, 9923.53£ and 15877.65£. so it will be better to charge cost at
labor hours.
TASK 2
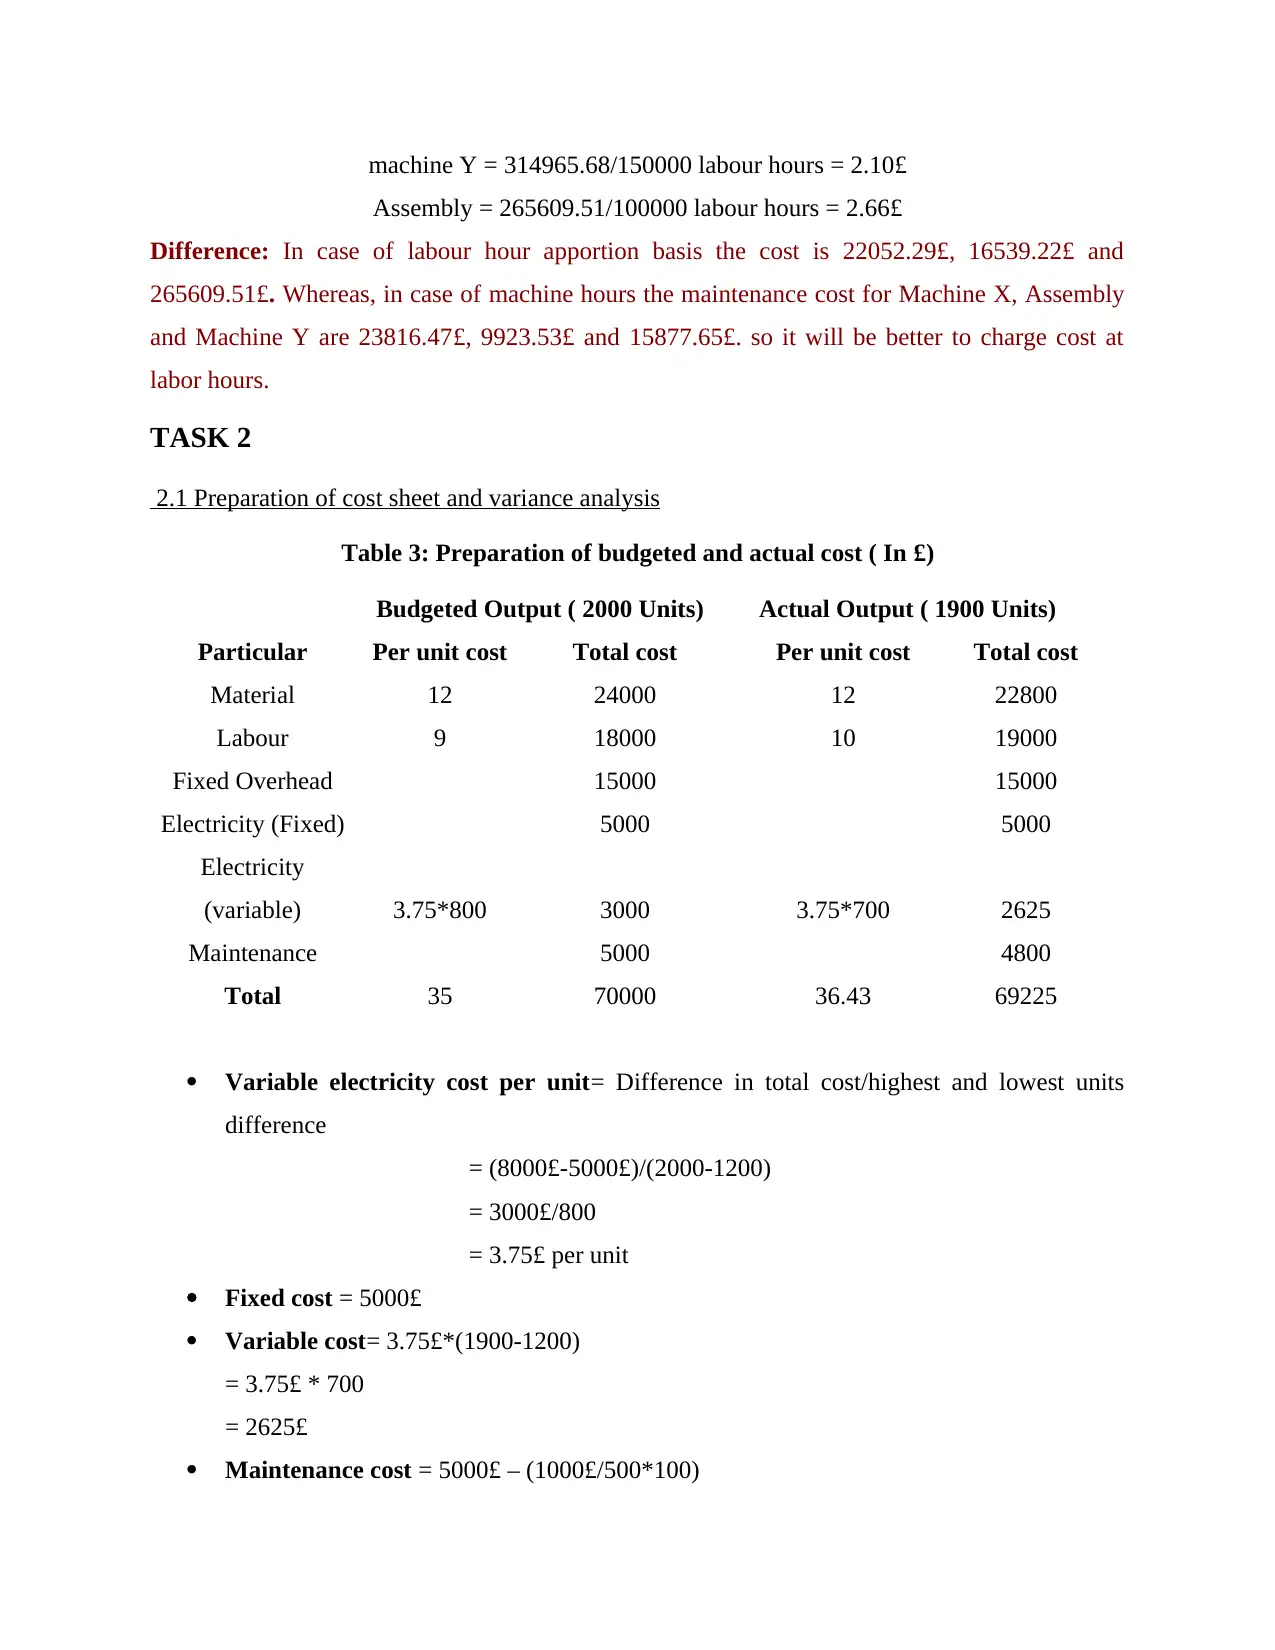
2.1 Preparation of cost sheet and variance analysis
Table 3: Preparation of budgeted and actual cost ( In £)
Budgeted Output ( 2000 Units) Actual Output ( 1900 Units)
Particular Per unit cost Total cost Per unit cost Total cost
Material 12 24000 12 22800
Labour 9 18000 10 19000
Fixed Overhead 15000 15000
Electricity (Fixed) 5000 5000
Electricity
(variable) 3.75*800 3000 3.75*700 2625
Maintenance 5000 4800
Total 35 70000 36.43 69225
Variable electricity cost per unit= Difference in total cost/highest and lowest units
difference
= (8000£-5000£)/(2000-1200)
= 3000£/800
= 3.75£ per unit
Fixed cost = 5000£
Variable cost= 3.75£*(1900-1200)
= 3.75£ * 700
= 2625£
Maintenance cost = 5000£ – (1000£/500*100)
Assembly = 265609.51/100000 labour hours = 2.66£
Difference: In case of labour hour apportion basis the cost is 22052.29£, 16539.22£ and
265609.51£. Whereas, in case of machine hours the maintenance cost for Machine X, Assembly
and Machine Y are 23816.47£, 9923.53£ and 15877.65£. so it will be better to charge cost at
labor hours.
TASK 2
2.1 Preparation of cost sheet and variance analysis
Table 3: Preparation of budgeted and actual cost ( In £)
Budgeted Output ( 2000 Units) Actual Output ( 1900 Units)
Particular Per unit cost Total cost Per unit cost Total cost
Material 12 24000 12 22800
Labour 9 18000 10 19000
Fixed Overhead 15000 15000
Electricity (Fixed) 5000 5000
Electricity
(variable) 3.75*800 3000 3.75*700 2625
Maintenance 5000 4800
Total 35 70000 36.43 69225
Variable electricity cost per unit= Difference in total cost/highest and lowest units
difference
= (8000£-5000£)/(2000-1200)
= 3000£/800
= 3.75£ per unit
Fixed cost = 5000£
Variable cost= 3.75£*(1900-1200)
= 3.75£ * 700
= 2625£
Maintenance cost = 5000£ – (1000£/500*100)
= 5000£ – 200£ = 4800£
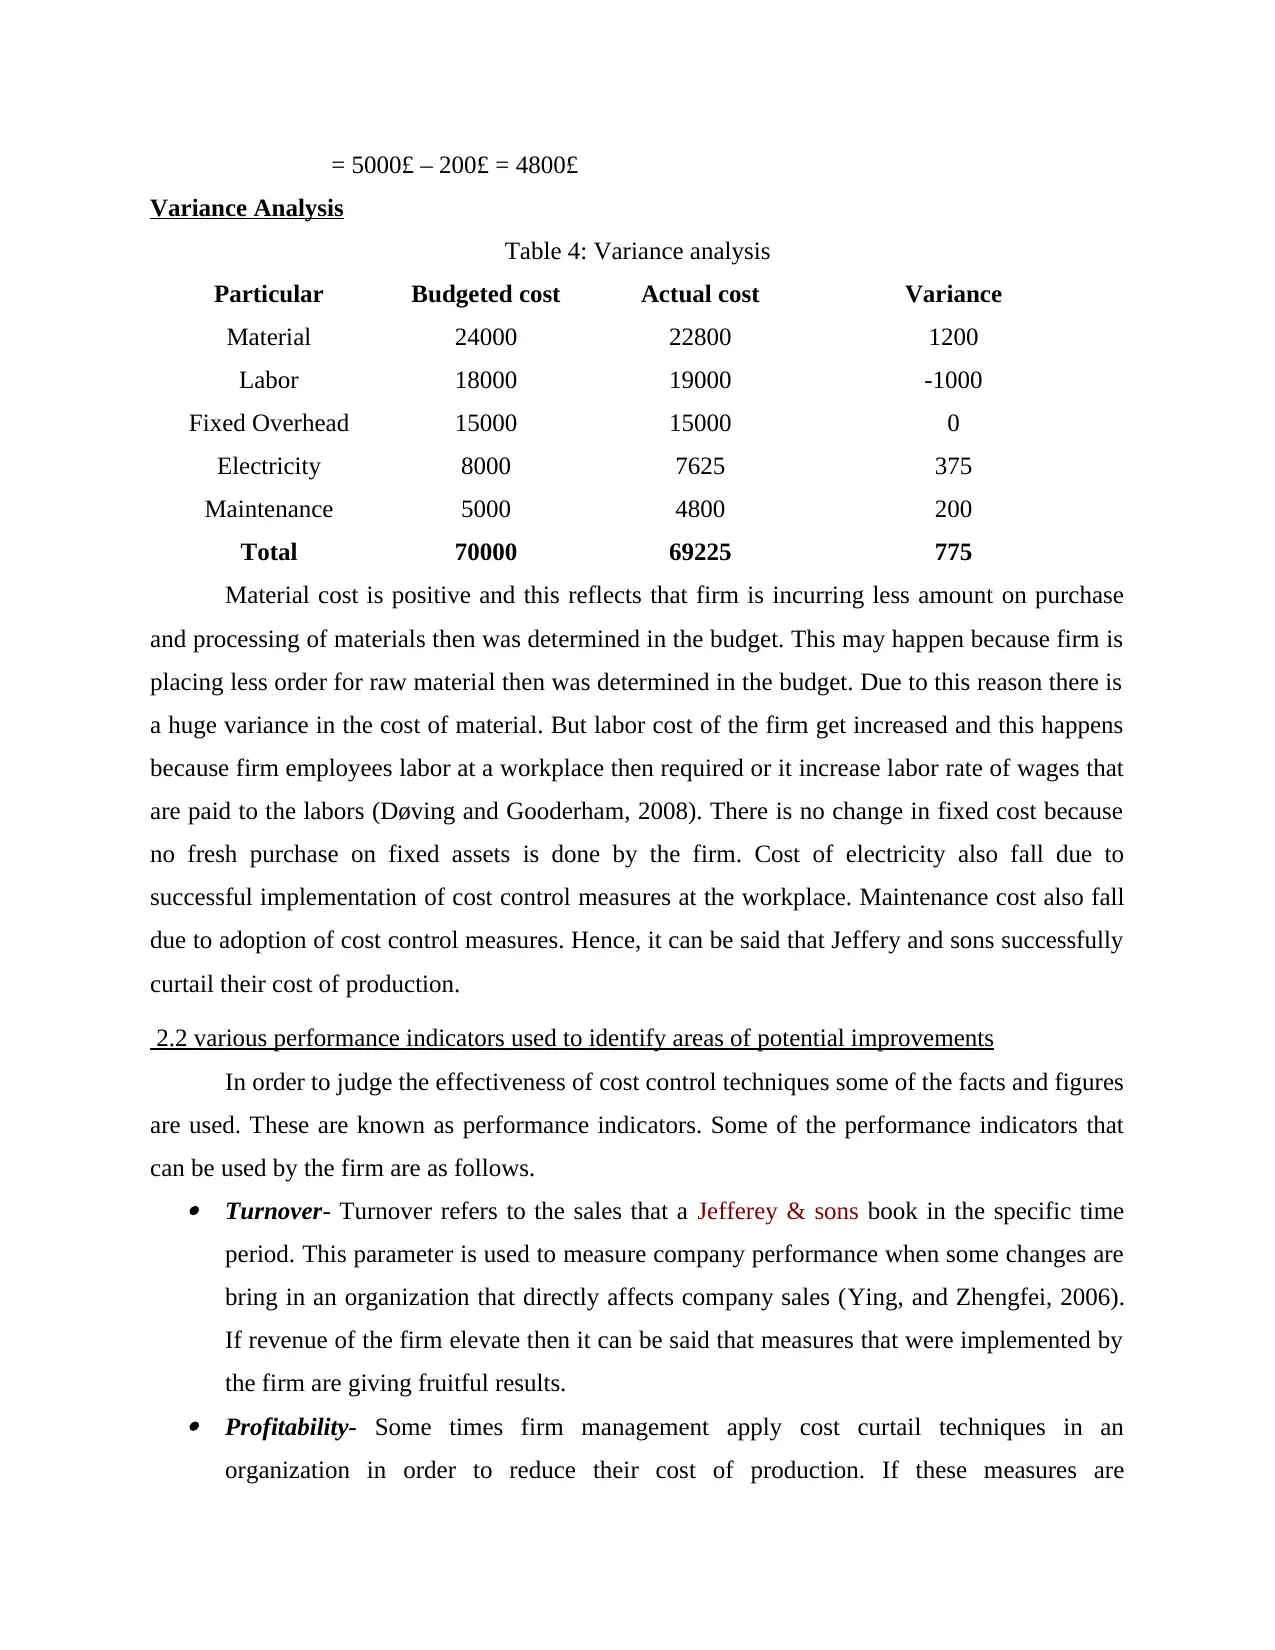
Variance Analysis
Table 4: Variance analysis
Particular Budgeted cost Actual cost Variance
Material 24000 22800 1200
Labor 18000 19000 -1000
Fixed Overhead 15000 15000 0
Electricity 8000 7625 375
Maintenance 5000 4800 200
Total 70000 69225 775
Material cost is positive and this reflects that firm is incurring less amount on purchase
and processing of materials then was determined in the budget. This may happen because firm is
placing less order for raw material then was determined in the budget. Due to this reason there is
a huge variance in the cost of material. But labor cost of the firm get increased and this happens
because firm employees labor at a workplace then required or it increase labor rate of wages that
are paid to the labors (Døving and Gooderham, 2008). There is no change in fixed cost because
no fresh purchase on fixed assets is done by the firm. Cost of electricity also fall due to
successful implementation of cost control measures at the workplace. Maintenance cost also fall
due to adoption of cost control measures. Hence, it can be said that Jeffery and sons successfully
curtail their cost of production.
2.2 various performance indicators used to identify areas of potential improvements
In order to judge the effectiveness of cost control techniques some of the facts and figures
are used. These are known as performance indicators. Some of the performance indicators that
can be used by the firm are as follows. Turnover- Turnover refers to the sales that a Jefferey & sons book in the specific time
period. This parameter is used to measure company performance when some changes are
bring in an organization that directly affects company sales (Ying, and Zhengfei, 2006).
If revenue of the firm elevate then it can be said that measures that were implemented by
the firm are giving fruitful results. Profitability- Some times firm management apply cost curtail techniques in an
organization in order to reduce their cost of production. If these measures are
⊘ This is a preview!⊘
Do you want full access?
Subscribe today to unlock all pages.
Trusted by 1+ million students worldwide
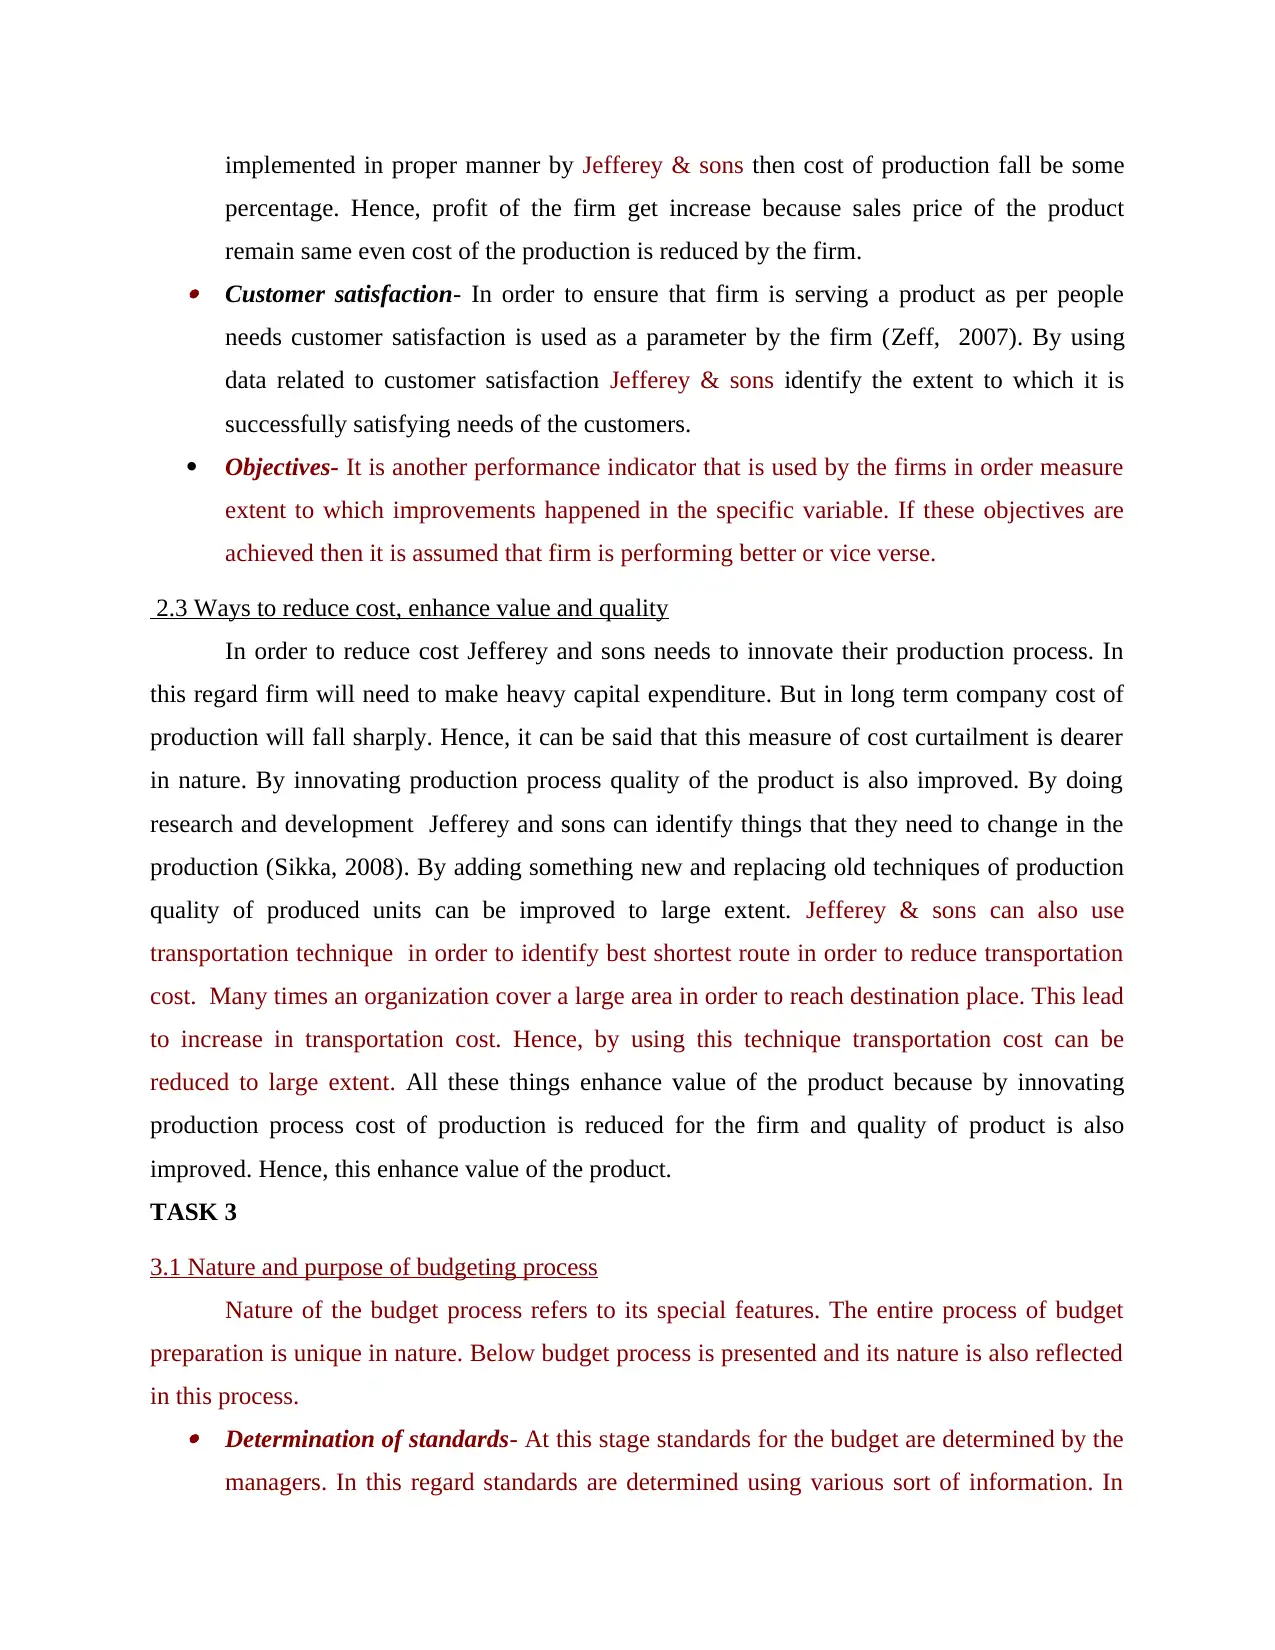
implemented in proper manner by Jefferey & sons then cost of production fall be some
percentage. Hence, profit of the firm get increase because sales price of the product
remain same even cost of the production is reduced by the firm. Customer satisfaction- In order to ensure that firm is serving a product as per people
needs customer satisfaction is used as a parameter by the firm (Zeff, 2007). By using
data related to customer satisfaction Jefferey & sons identify the extent to which it is
successfully satisfying needs of the customers.
Objectives- It is another performance indicator that is used by the firms in order measure
extent to which improvements happened in the specific variable. If these objectives are
achieved then it is assumed that firm is performing better or vice verse.
2.3 Ways to reduce cost, enhance value and quality
In order to reduce cost Jefferey and sons needs to innovate their production process. In
this regard firm will need to make heavy capital expenditure. But in long term company cost of
production will fall sharply. Hence, it can be said that this measure of cost curtailment is dearer
in nature. By innovating production process quality of the product is also improved. By doing
research and development Jefferey and sons can identify things that they need to change in the
production (Sikka, 2008). By adding something new and replacing old techniques of production
quality of produced units can be improved to large extent. Jefferey & sons can also use
transportation technique in order to identify best shortest route in order to reduce transportation
cost. Many times an organization cover a large area in order to reach destination place. This lead
to increase in transportation cost. Hence, by using this technique transportation cost can be
reduced to large extent. All these things enhance value of the product because by innovating
production process cost of production is reduced for the firm and quality of product is also
improved. Hence, this enhance value of the product.
TASK 3
3.1 Nature and purpose of budgeting process
Nature of the budget process refers to its special features. The entire process of budget
preparation is unique in nature. Below budget process is presented and its nature is also reflected
in this process. Determination of standards- At this stage standards for the budget are determined by the
managers. In this regard standards are determined using various sort of information. In
Paraphrase This Document
Need a fresh take? Get an instant paraphrase of this document with our AI Paraphraser
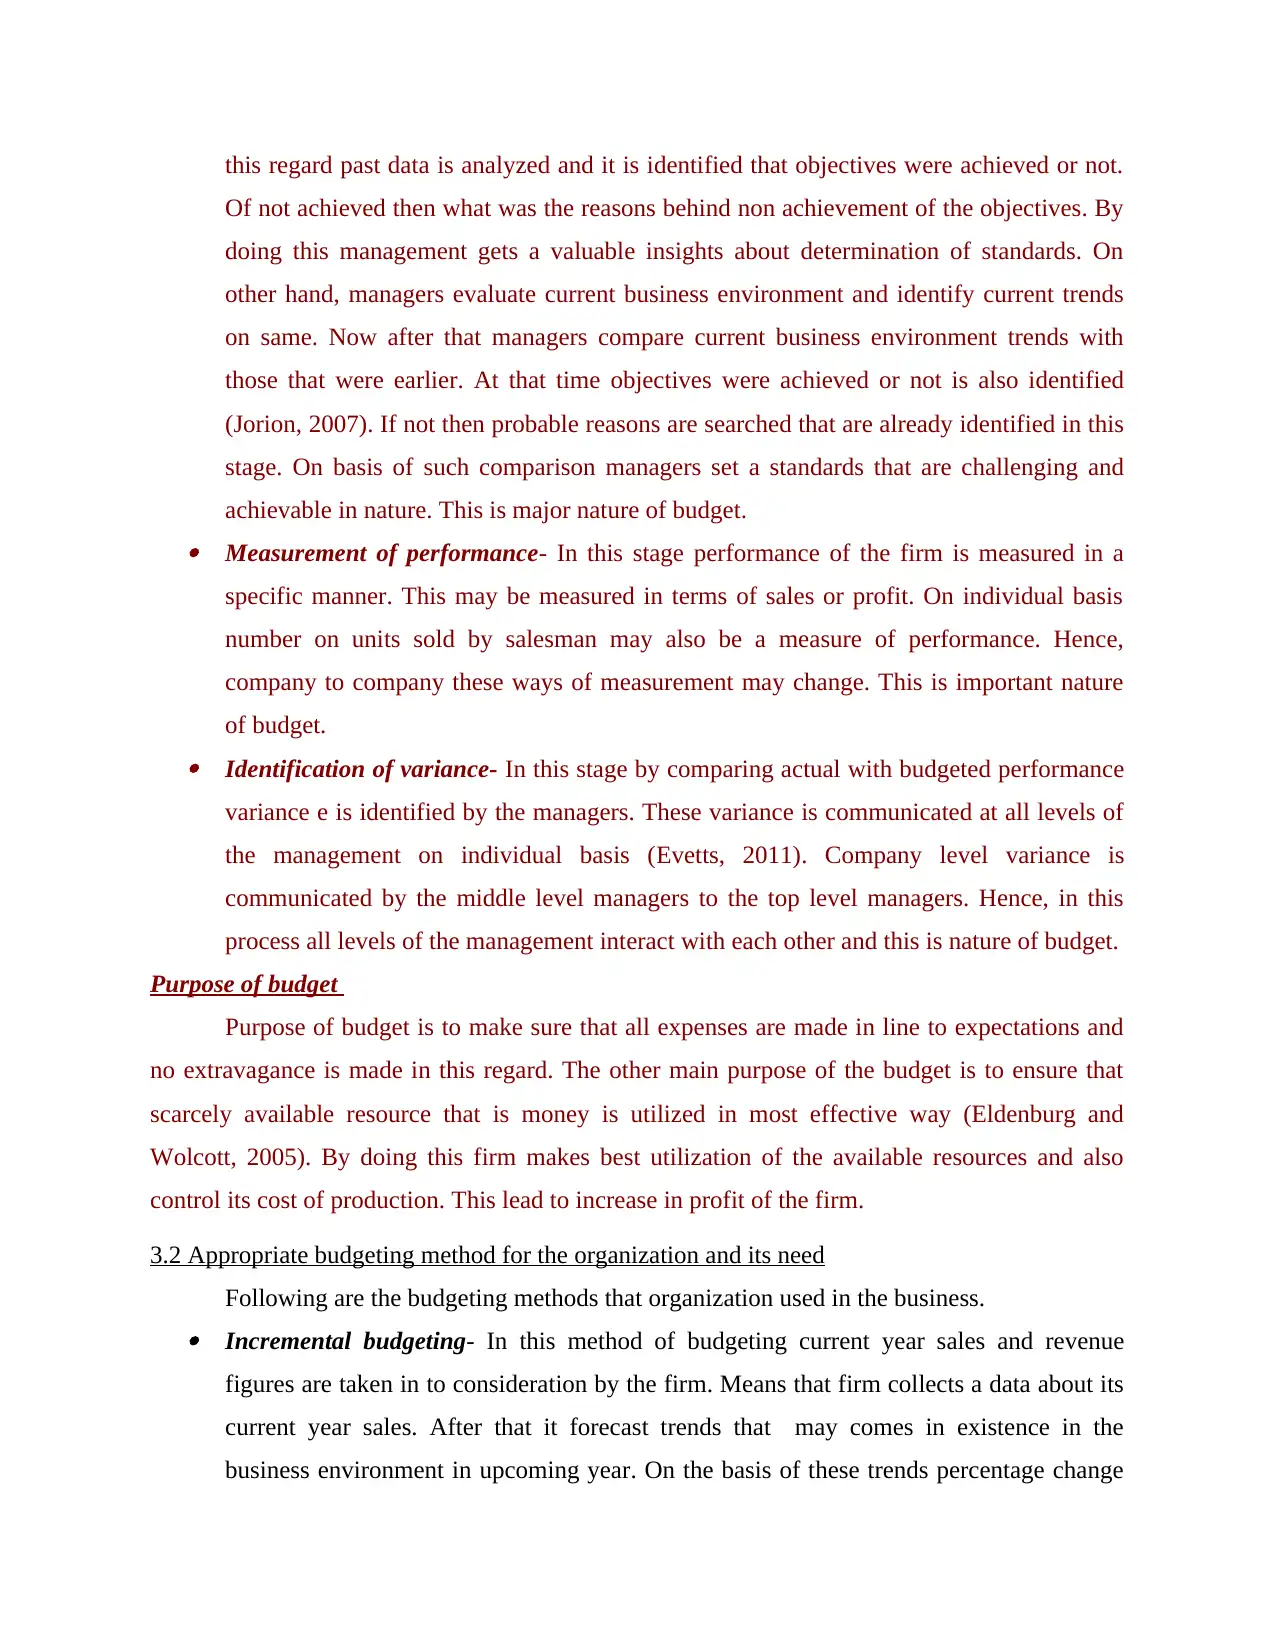
this regard past data is analyzed and it is identified that objectives were achieved or not.
Of not achieved then what was the reasons behind non achievement of the objectives. By
doing this management gets a valuable insights about determination of standards. On
other hand, managers evaluate current business environment and identify current trends
on same. Now after that managers compare current business environment trends with
those that were earlier. At that time objectives were achieved or not is also identified
(Jorion, 2007). If not then probable reasons are searched that are already identified in this
stage. On basis of such comparison managers set a standards that are challenging and
achievable in nature. This is major nature of budget. Measurement of performance- In this stage performance of the firm is measured in a
specific manner. This may be measured in terms of sales or profit. On individual basis
number on units sold by salesman may also be a measure of performance. Hence,
company to company these ways of measurement may change. This is important nature
of budget. Identification of variance- In this stage by comparing actual with budgeted performance
variance e is identified by the managers. These variance is communicated at all levels of
the management on individual basis (Evetts, 2011). Company level variance is
communicated by the middle level managers to the top level managers. Hence, in this
process all levels of the management interact with each other and this is nature of budget.
Purpose of budget
Purpose of budget is to make sure that all expenses are made in line to expectations and
no extravagance is made in this regard. The other main purpose of the budget is to ensure that
scarcely available resource that is money is utilized in most effective way (Eldenburg and
Wolcott, 2005). By doing this firm makes best utilization of the available resources and also
control its cost of production. This lead to increase in profit of the firm.
3.2 Appropriate budgeting method for the organization and its need
Following are the budgeting methods that organization used in the business. Incremental budgeting- In this method of budgeting current year sales and revenue
figures are taken in to consideration by the firm. Means that firm collects a data about its
current year sales. After that it forecast trends that may comes in existence in the
business environment in upcoming year. On the basis of these trends percentage change
in sales, profit and cost is identified by the firm (Guthrie, 2005). That percentage change
is calculated by using current figures and added to them in order to draft budget for the
next fiscal year. Zero based budgeting- In this way if budgeting old values are not used. Budget is
prepared by identifying all activities of the business. Then resources are allocated to these
activities in order to create a budget. Values of these resources are estimated and by using
these value is budget is prepared. But this technique is often not used by the firm because
there is a high chances of inclusion of unrealistic values in the budget.
Top down budgeting- In this method, first of all higher cost factors are determined in the
budget at first stage. Then lower cost factors are envisaged on the basis of higher level
task cost (Mongiello, M., 2015). In this regard top and middle level managers consult
with each other. Thus, this budget is known as top down budgeting.
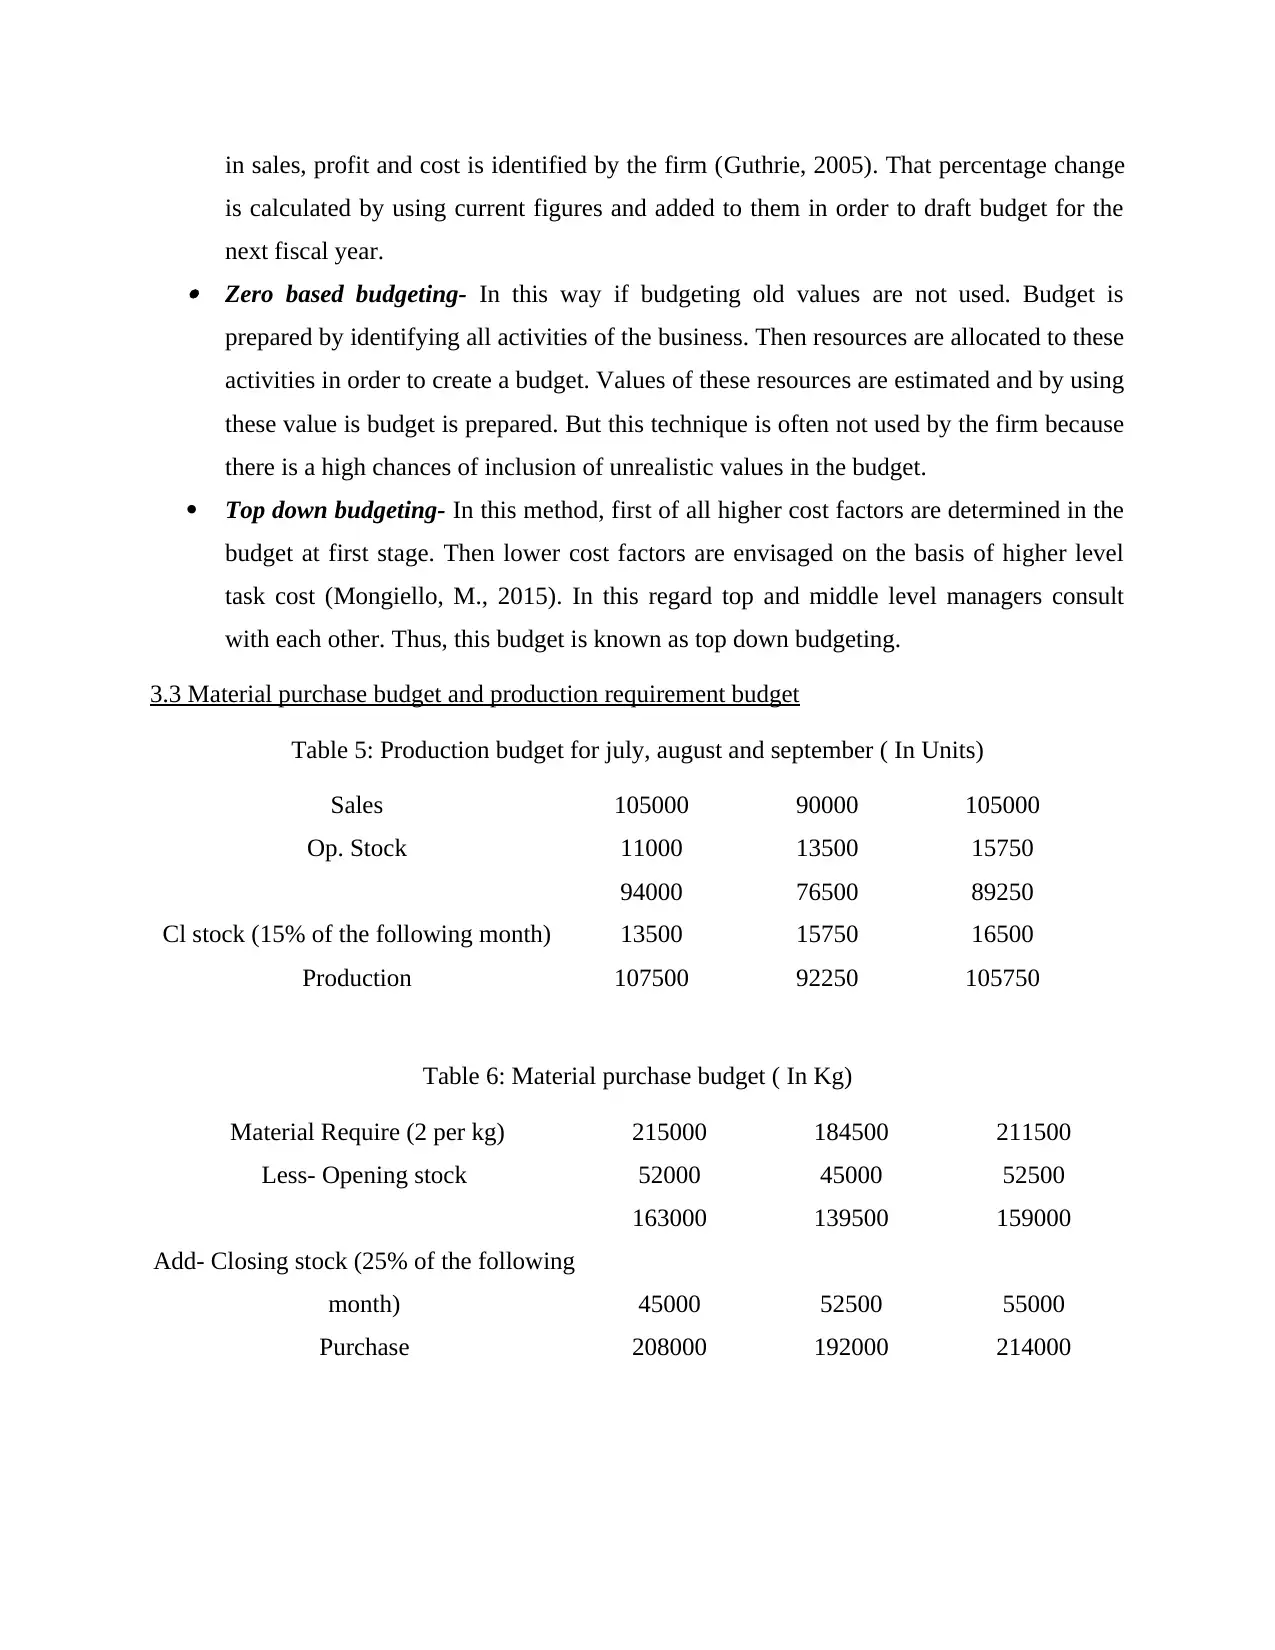
3.3 Material purchase budget and production requirement budget
Table 5: Production budget for july, august and september ( In Units)
Sales 105000 90000 105000
Op. Stock 11000 13500 15750
94000 76500 89250
Cl stock (15% of the following month) 13500 15750 16500
Production 107500 92250 105750
Table 6: Material purchase budget ( In Kg)
Material Require (2 per kg) 215000 184500 211500
Less- Opening stock 52000 45000 52500
163000 139500 159000
Add- Closing stock (25% of the following
month) 45000 52500 55000
Purchase 208000 192000 214000
is calculated by using current figures and added to them in order to draft budget for the
next fiscal year. Zero based budgeting- In this way if budgeting old values are not used. Budget is
prepared by identifying all activities of the business. Then resources are allocated to these
activities in order to create a budget. Values of these resources are estimated and by using
these value is budget is prepared. But this technique is often not used by the firm because
there is a high chances of inclusion of unrealistic values in the budget.
Top down budgeting- In this method, first of all higher cost factors are determined in the
budget at first stage. Then lower cost factors are envisaged on the basis of higher level
task cost (Mongiello, M., 2015). In this regard top and middle level managers consult
with each other. Thus, this budget is known as top down budgeting.
3.3 Material purchase budget and production requirement budget
Table 5: Production budget for july, august and september ( In Units)
Sales 105000 90000 105000
Op. Stock 11000 13500 15750
94000 76500 89250
Cl stock (15% of the following month) 13500 15750 16500
Production 107500 92250 105750
Table 6: Material purchase budget ( In Kg)
Material Require (2 per kg) 215000 184500 211500
Less- Opening stock 52000 45000 52500
163000 139500 159000
Add- Closing stock (25% of the following
month) 45000 52500 55000
Purchase 208000 192000 214000
⊘ This is a preview!⊘
Do you want full access?
Subscribe today to unlock all pages.
Trusted by 1+ million students worldwide
1 out of 16
Related Documents


Your All-in-One AI-Powered Toolkit for Academic Success.
+13062052269
info@desklib.com
Available 24*7 on WhatsApp / Email
![[object Object]](/_next/static/media/star-bottom.7253800d.svg)
Unlock your academic potential
Copyright © 2020–2026 A2Z Services. All Rights Reserved. Developed and managed by ZUCOL.