Project 1: Management Accounting Analysis, [Course Name], Semester [X]

Verified

Added on  2020/05/16

|9
|2296
|31
Project
AI Summary
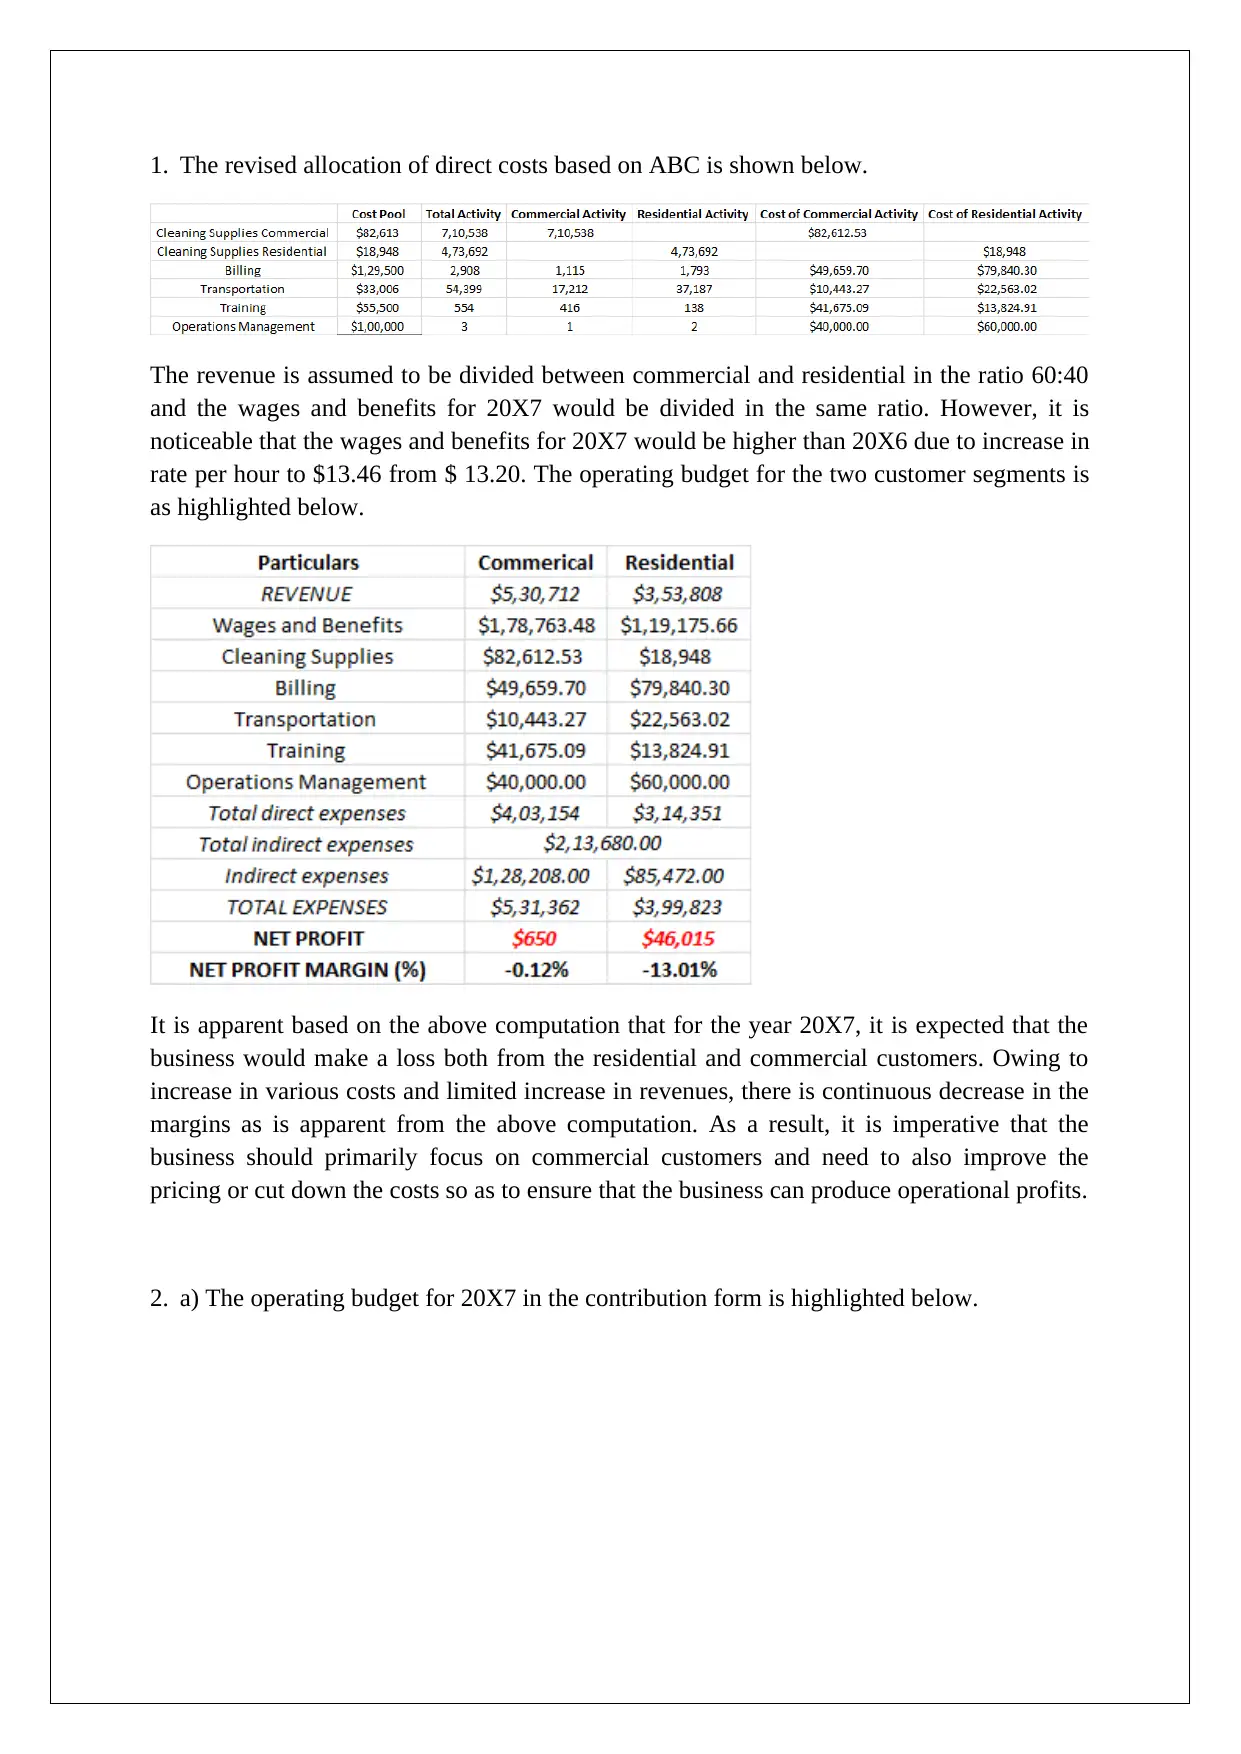
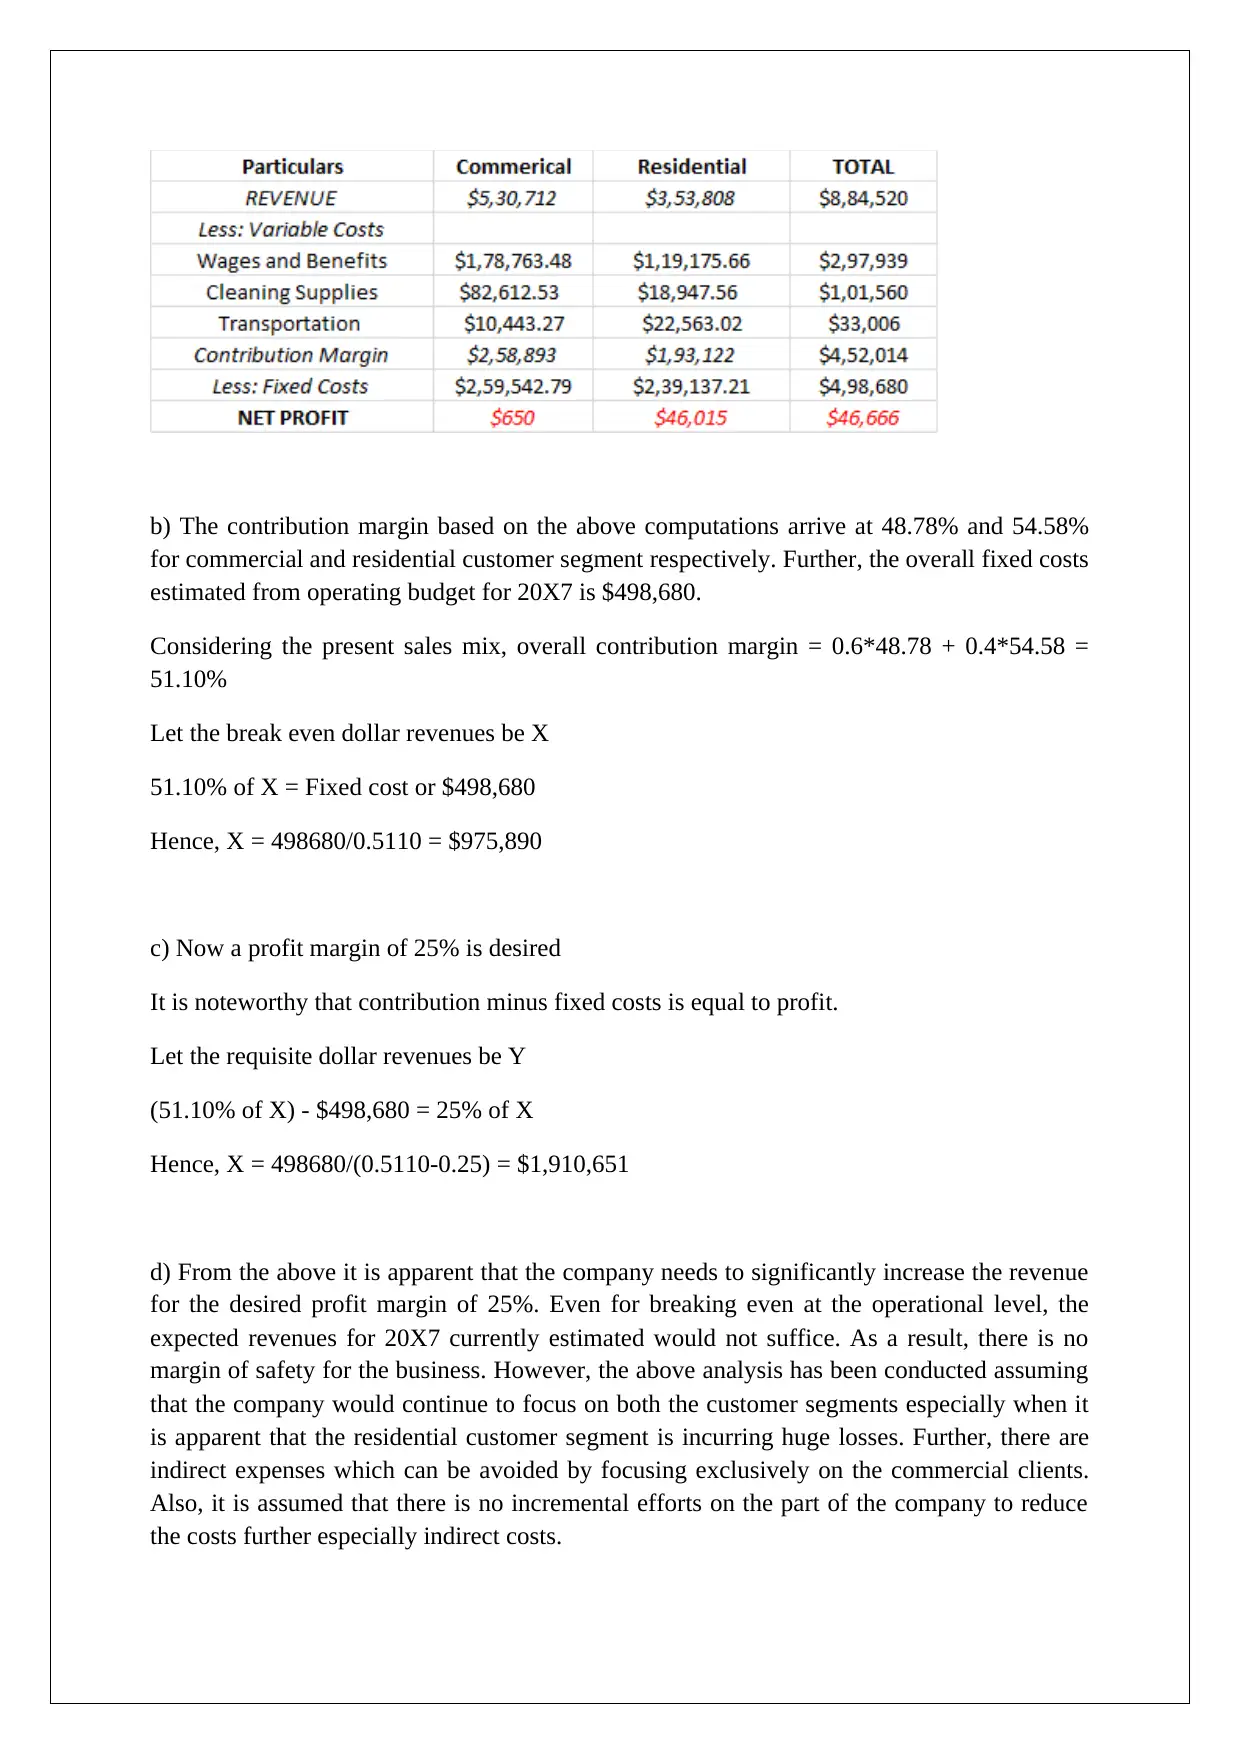
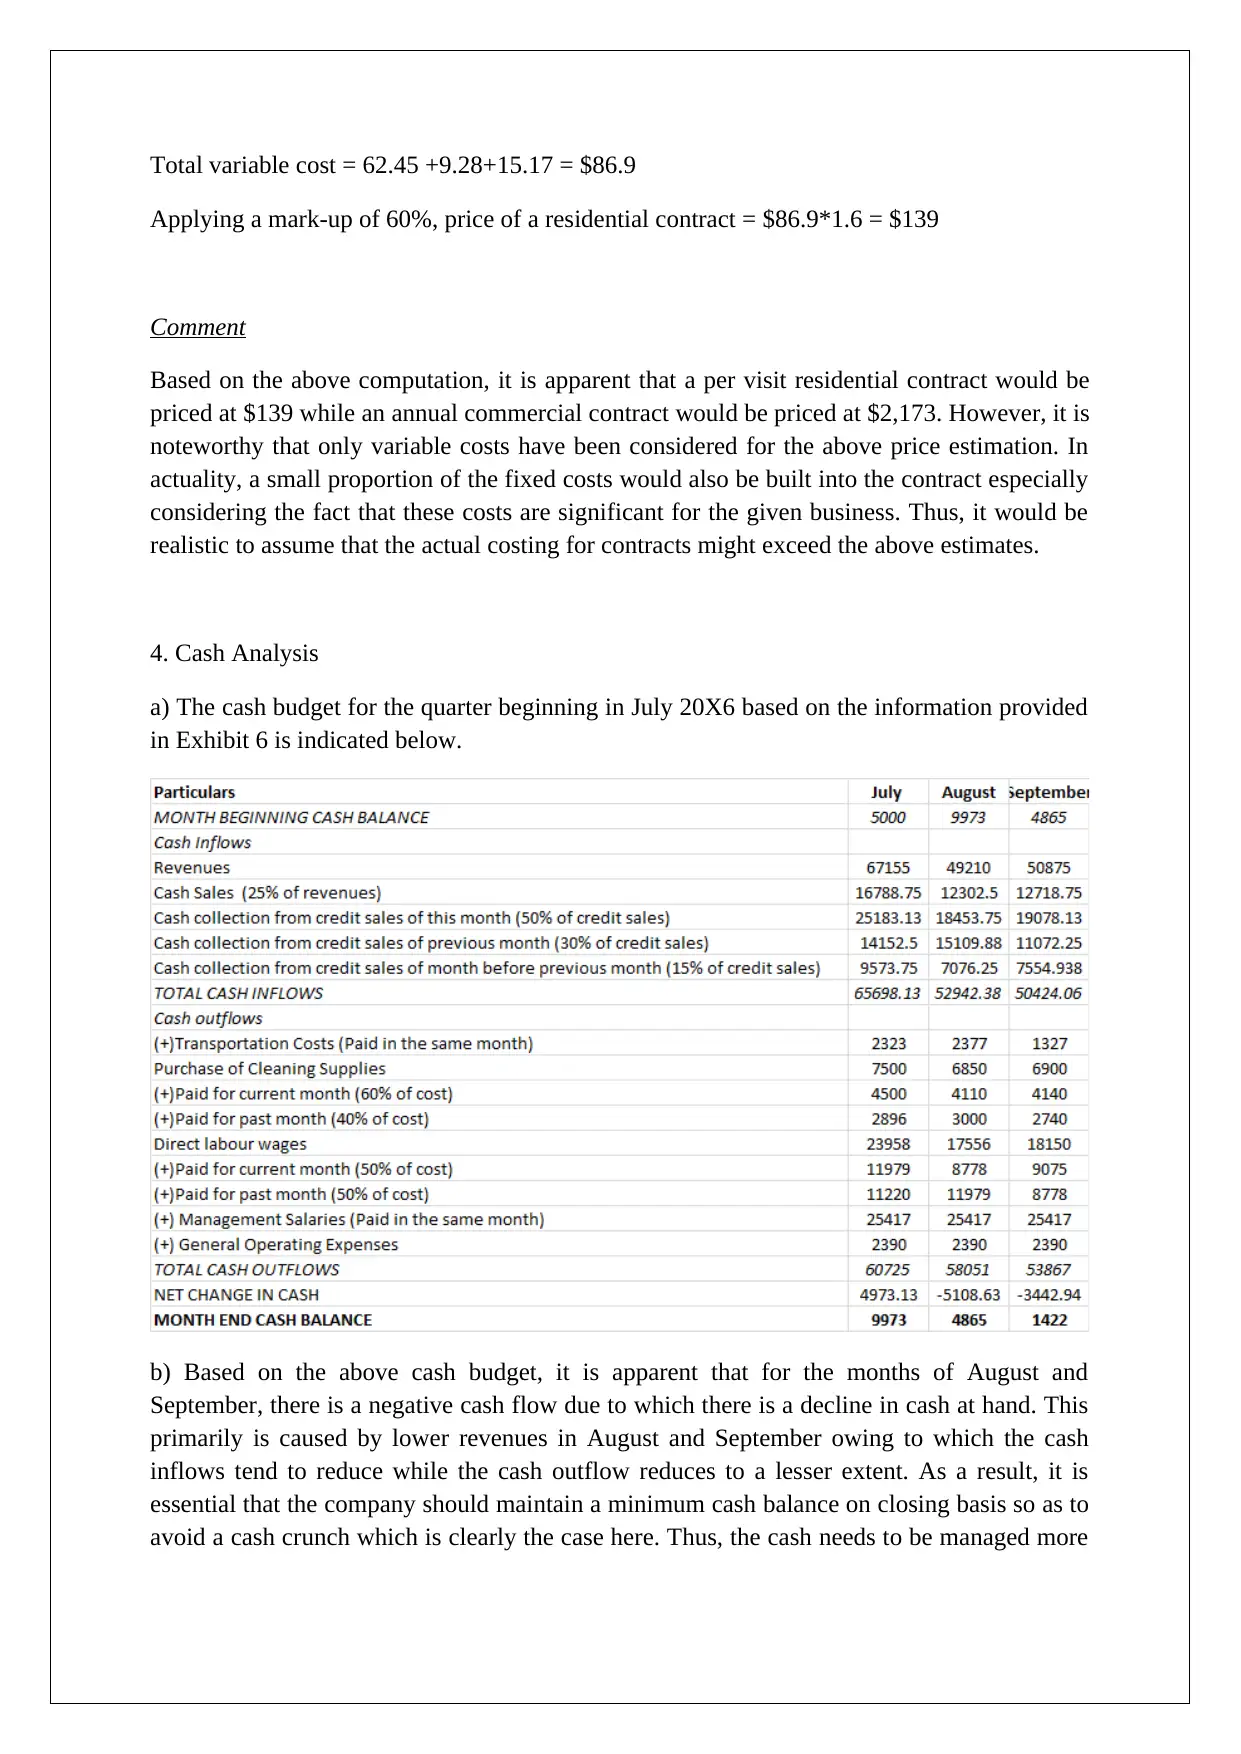
This management accounting project analyzes a company's financial performance, focusing on profit, cost, and cash flow. The project begins with a profit analysis, highlighting revenue and expense trends, and identifies unfavorable variances in direct and indirect expenses, leading to a decline in gross margin. A detailed costing analysis follows, examining overhead costs, direct labor hours, and the application of overhead rates. Regression analysis is used to determine the relationship between direct labor hours and transportation and cleaning supply costs. The project then explores Activity-Based Costing (ABC) to allocate costs more accurately across different customer segments. Project 2 involves creating an operating budget for the following year, analyzing contribution margins, break-even points, and revenue targets. The project also delves into pricing strategies for commercial and residential contracts, considering variable costs and markups. Finally, a cash budget is developed to assess the company's cash flow, identifying periods of negative cash flow and the need for financial management. The project emphasizes the importance of cost control, strategic pricing, and effective financial planning for improved profitability.
Document Page
MANAGEMENT ACCOUNTING
STUDENT ID:
[Pick the date]
tabler-icon-diamond-filled.svg

Paraphrase This Document

Need a fresh take? Get an instant paraphrase of this document with our AI Paraphraser
Document Page
PROJECT 1
1. Profit Analysis
With regards to revenue, it is apparent that for 20X6, there has been an increase of about 12%
on a y-o-y basis. Also, the actual revenue for 20X6 is about 5% higher than the budgeted
amount for the same year. This clearly augers well for the company and implies that the
revenue performance of the business has exceeded expectations in 20X6.
The concerning aspect for the company is with regards to direct expenses in 20X6. Even
though on a y-o-y basis, there has been an increase of 12% in the sales, but the increase in
wages, transportation costs, cleaning supplies have increased by more than 25% due to which
there has been a significant decline in the gross margin. As a result, absolute gross margin in
20X6 is lower than the corresponding figure in 20X5 even though the revenue in 20X6 is
higher. Also, all the items under the direct expenses are exhibiting unfavourable variance
over their budgeted cost in 20X6 which highlights the higher direct expenses seen in 20X6
are unexpected by the company also.
With regards to indirect expenses as well, it is apparent that each of the item has an
unfavourable variance which reflects that the actual expenses have exceeded the budgeted
expenses. A noticeable unfavourable deviation is with regards to training and administration
costs which are higher by more than 10% from the budget estimates. Also, as compared to
last year, there has been a 33% increase in the promotional expense which may have been
responsible for the rising revenues. Thus, it is apparent that based on exhibit 1, the business
should be worried about the unfavourable deviation in expenses (especially in direct
expenses) which has led to erosion of profit margins.
2. Costing Analysis
a) It is apparent that the overhead costs comprise of costs related to cleaning supplies,
operation manager salaries along with transportation costs. The actual costs for the above
items for 20X6 are listed below.
Cleaning Supplies (20X6) = $88,541
Transportation Costs (20X6) = $30,281
Salaries of operations managers (20X6) = $120,000
Total overhead costs (20X6) = 88541 + 30281 + 120000 = $238,822
Total direct costs (20X6) = $292,184
Number of hours of direct labour = 292184/13.2 = 22,135.15
Actual overhead rate = 238822/22135.15 = $ 10.79 per direct labour hour
Document Page
However, the overhead rate considered is $ 10 per labour hour. Hence, under the current
practice of applying $ 10 per direct labour hour as the overhead rate, the overhead rate is
underapplied as the actual overhead rate exceeds the currently applied rate.
b) Based on the regression results summary highlighted in Exhibit 3, it is apparent that there
is weak linear relationship between transportation costs and direct labour hours. This is
apparent from the R2 value of 0.13697 which implies that changes in direct labour hours
are capable of offering explanation to only about 13.7% of the changes in transportation
costs. Also, the slope of the regression line does not seem significant as is apparent from
the t value of the slope which would lead to a p value in excess of 0.05 (assumed
significance level). Thus, it is apparent that direct labour hour is not a reliable estimator of
transportation costs.
With regards to regression result between cleaning supply costs and labour hours, it is
apparent that the linear relationship is strong. This is reflected from the R2 value of 0.6963
which implies that changes in direct labour hours are capable of offering explanation to about
69.63% of the changes cleaning supply costs. Further, this is also supported by the
corresponding t stat of the slope which would lead to a p value of lower than 0.05 (assumed
significance level). Hence, it would be appropriate to conclude that direct labour hour is a
reliable estimator of cleaning supply costs.
On the basis of the above, it may be appropriate to conclude that transportation costs should
not be linked to direct labour hours which would enable better prediction of the overhead
rate.
c) The requisite regression equation for cleaning supplies is as highlighted below.
Cleaning supplies cost = 5922. 62 + 0.78922*Direct labour hours
Clearly from the above equation, the fixed cleaning supplies cost would be $5,922.62 while
the variable supplies cost would amount to $ 0.78922 per direct labour hours.
Direct labour hours (20X6) = 22,135.15 (as computed in part a)
Hence, cleaning supplies cost = 5922.62 + 0.78922*22135.15 = $23,392. 12
Thus, total overhead costs (20X6) = 23392.12 + 30281 + 120000 = $173,673.1
Thus, revised overhead application rate = 173,673.1/22135.15 = $7.85 per labour hour
Therefore, the computation above reflects that the current application rate of $ 10 per direct
labour hour is higher than the computed rate above. Hence, there is over-application of the
overhead rate based on the above calculations.
Document Page
d) The derivation of the respective costs based on ABC costing is highlighted below.
The breakup of revenue from residential and commercial is in the ratio of 40:60 and the
wages and benefits also have to be divided in the same ratio. Based on this understanding a
partial operating profit computation and profit margin is as highlighted below.
The reasons for difference between the traditional and ABC costing are highlighted below.
The ABC costing tends to derive costs based on the respective activities unlike
traditional costing whereby overheads costs are linked to direct costs.
Since ABC tends to break the overhead cost into various cost drivers, hence it
facilitates better allocation of cost. In case of traditional costing, no such basis is
available and hence direct cost linkage is the only plausible choice.
ABC also allows more appropriate cost allocation across the various divisions or
department which is not possible under traditional costing which tends to apply
overhead rates at a uniform rate which is clearly incorrect as exhibited above.
e) It is apparent from the above analysis that currently there is an under application of the
overhead rate as the actual overhead rate is higher than $ 10 per direct hour that is being
applied. Also, the regression analysis has indicated that the direct labour hour is a good
indicator for cleaning supplies cost but the same cannot be said for transportation costs. If
the cleaning supplies cost are determined using regression, then the current overhead rate
would be over applied as the computed rate works out to be lesser than $ 10 per direct
labour hour. Also, ABC costing is imperative for determining the actual profit margins of
the various segments by ensuring better allocation of overhead costs. Based on this, it is
apparent that the residential customer segment seems to be operationally loss making
while the commercial customer segment is operationally highly profitable.
Project 2
tabler-icon-diamond-filled.svg

Paraphrase This Document

Need a fresh take? Get an instant paraphrase of this document with our AI Paraphraser
Document Page
1. The revised allocation of direct costs based on ABC is shown below.
The revenue is assumed to be divided between commercial and residential in the ratio 60:40
and the wages and benefits for 20X7 would be divided in the same ratio. However, it is
noticeable that the wages and benefits for 20X7 would be higher than 20X6 due to increase in
rate per hour to $13.46 from $ 13.20. The operating budget for the two customer segments is
as highlighted below.
It is apparent based on the above computation that for the year 20X7, it is expected that the
business would make a loss both from the residential and commercial customers. Owing to
increase in various costs and limited increase in revenues, there is continuous decrease in the
margins as is apparent from the above computation. As a result, it is imperative that the
business should primarily focus on commercial customers and need to also improve the
pricing or cut down the costs so as to ensure that the business can produce operational profits.
2. a) The operating budget for 20X7 in the contribution form is highlighted below.
Document Page
b) The contribution margin based on the above computations arrive at 48.78% and 54.58%
for commercial and residential customer segment respectively. Further, the overall fixed costs
estimated from operating budget for 20X7 is $498,680.
Considering the present sales mix, overall contribution margin = 0.6*48.78 + 0.4*54.58 =
51.10%
Let the break even dollar revenues be X
51.10% of X = Fixed cost or $498,680
Hence, X = 498680/0.5110 = $975,890
c) Now a profit margin of 25% is desired
It is noteworthy that contribution minus fixed costs is equal to profit.
Let the requisite dollar revenues be Y
(51.10% of X) - $498,680 = 25% of X
Hence, X = 498680/(0.5110-0.25) = $1,910,651
d) From the above it is apparent that the company needs to significantly increase the revenue
for the desired profit margin of 25%. Even for breaking even at the operational level, the
expected revenues for 20X7 currently estimated would not suffice. As a result, there is no
margin of safety for the business. However, the above analysis has been conducted assuming
that the company would continue to focus on both the customer segments especially when it
is apparent that the residential customer segment is incurring huge losses. Further, there are
indirect expenses which can be avoided by focusing exclusively on the commercial clients.
Also, it is assumed that there is no incremental efforts on the part of the company to reduce
the costs further especially indirect costs.
Document Page
3. In order to arrive at the price to be charged, it is imperative to estimate the variable costs
that would be incurred in serving the given clients.
Commercial Client
Total area = 1950 m2
A cleaning agent in one hour is able to clean an average area of 50 m2
Hence, direct labour hours required = 1950/50 = 39 hours
Benefit and wage per hour (20X7) = $ 13.46
Thus, benefit and wage cost = 13.46*39 = $524.94
Cleaning supplies per m2 (20X7) = 82613/710538 = $ 0.11627
Cleaning supplies cost = 1950*0.11627 = $226.72
Transportation cost per km (20X7) = 33006/54339 = $0.6067
Total annual distance to be covered for serving the client = 50*20 = 1000km
Transportation cost = 1000*0.6067 = $606.7
Total variable cost = 524.94 +226.72+606.7 = $1,358.36
Applying a mark-up of 60%, price of a commercial contract = $1,358.36 *1.6 = $2,173
Residential Client
Total area = 232 m2
A cleaning agent in one hour is able to clean an average area of 50 m2
Hence, direct labour hours required = 232/50 = 4.64 hours
Benefit and wage per hour (20X7) = $ 13.46
Thus, benefit and wage cost = 13.46*4.64= $62.45
Cleaning supplies per m2 (20X7) = 18948/473692 = $ 0.039999
Cleaning supplies cost = 232*0.039999 = $9.28
Transportation cost per km (20X7) = 33006/54339 = $0.6067
Total distance to be covered for serving the client = 25 km
Transportation cost = 25*0.6067 = $15.17
tabler-icon-diamond-filled.svg

Paraphrase This Document

Need a fresh take? Get an instant paraphrase of this document with our AI Paraphraser
Document Page
Total variable cost = 62.45 +9.28+15.17 = $86.9
Applying a mark-up of 60%, price of a residential contract = $86.9*1.6 = $139
Comment
Based on the above computation, it is apparent that a per visit residential contract would be
priced at $139 while an annual commercial contract would be priced at $2,173. However, it is
noteworthy that only variable costs have been considered for the above price estimation. In
actuality, a small proportion of the fixed costs would also be built into the contract especially
considering the fact that these costs are significant for the given business. Thus, it would be
realistic to assume that the actual costing for contracts might exceed the above estimates.
4. Cash Analysis
a) The cash budget for the quarter beginning in July 20X6 based on the information provided
in Exhibit 6 is indicated below.
b) Based on the above cash budget, it is apparent that for the months of August and
September, there is a negative cash flow due to which there is a decline in cash at hand. This
primarily is caused by lower revenues in August and September owing to which the cash
inflows tend to reduce while the cash outflow reduces to a lesser extent. As a result, it is
essential that the company should maintain a minimum cash balance on closing basis so as to
avoid a cash crunch which is clearly the case here. Thus, the cash needs to be managed more
Document Page
prudently so as to ensure that the closing balance does go below a defined level and cash
should be poured in the lean months so as to maintain smooth operations.
chevron_up_icon
1 out of 9
circle_padding
hide_on_mobile
zoom_out_icon
[object Object]