Management Accounting Report: Jeffrey and Sons, Semester 1
VerifiedAdded on 2020/01/15
|20
|5194
|130
Report
AI Summary
This report delves into the core concepts of management accounting, offering a detailed analysis of cost classifications, job costing, and absorption costing techniques. It meticulously calculates job costs for a specific scenario, demonstrating the application of different costing methods. The report then explores absorption costing, including the allocation of overheads and the calculation of overhead absorption rates, ultimately analyzing the impact of different allocation bases. Furthermore, the report constructs and analyzes a cost report, identifying variances, their causes, and potential corrective actions. Key performance indicators are discussed, along with methods to reduce costs and enhance product quality. The report also examines the budgeting process, proposing suitable budgeting methods for Jeffrey and Sons, and prepares production and material budgets, as well as a cash budget. Finally, it addresses variance analysis, preparing an operating statement and providing recommendations for improvement, all within the context of a manufacturing organization named Jeffrey and Sons, aiming to achieve its organizational goals.
MANAGEMENT
ACCOUNTING
ACCOUNTING
Paraphrase This Document
Need a fresh take? Get an instant paraphrase of this document with our AI Paraphraser
TABLE OF CONTENTS
INTRODUCTION...........................................................................................................................1
TASK 1............................................................................................................................................1
1.1 Types of cost classification....................................................................................................1
1.2 Calculation of job costs.........................................................................................................2
1.3 Absorption costing technique................................................................................................3
1.4 Analysing the cost data..........................................................................................................5
Task 2...............................................................................................................................................6
2.1 Preparation and analysis of cost report..................................................................................6
2.2 Performance indicator for areas of improvements.................................................................7
2.3 Methods to reduce the cost, improve quality.........................................................................8
Task 3...............................................................................................................................................9
3.1 Budgeting process..................................................................................................................9
3.2 Budgeting methods for Jeffrey and Sons.............................................................................10
3.3 Preparation of production and material budget...................................................................11
3.4 Preparation of cash budget...................................................................................................12
Task 4.............................................................................................................................................13
4.1 Identify variances, its causes and taking corrective actions................................................13
4.2 Preparation of operating statement......................................................................................14
4.3 Report the findings..............................................................................................................15
CONCLUSION..............................................................................................................................15
REFERENCES..............................................................................................................................16
List of tables
Table 1: Classification of Costs.......................................................................................................1
Table 2: Calculation of unit cost and total job cost for job 444......................................................2
Table 3: Allocation of overheads to the production department.....................................................3
Table 4: Reapportioning the service or support department costs to the production departments..4
Table 5: Calculation of Overhead Absorption Rates.......................................................................5
Table 6: Calculation of overhead charge.........................................................................................5
Table 7: Calculation of overhead absorption rates using labour hours as a basis...........................5
Table 8: Calculation of cost.............................................................................................................5
Table 9: Calculation of Actual Costs for business...........................................................................6
Table 10: The difference between the highest and lowest costs......................................................6
Table 11: Cost Report......................................................................................................................6
Table 12: Production budget of Jeffrey & Son's............................................................................11
Table 13: Material purchase budget of Jeffrey & Son's................................................................12
Table 14: Cash Budget...................................................................................................................12
Table 15: Calculation of variances................................................................................................13
Table 16; Operating Statement......................................................................................................14
⊘ This is a preview!⊘
Do you want full access?
Subscribe today to unlock all pages.
Trusted by 1+ million students worldwide
INTRODUCTION
Management accounting is a branch of accounting which helps in taking different types
of managerial decisions for the company. The interpretation of figures assists in adopting
strategic actions. The purpose of this research study is to analyse the cost information within the
business. It shows the impact of budgeting process on the organization (Jorgensen, Patrick and
Soderstrom, 2012). Further the development of cost reduction and management procedures are
also shown. The report shows how the data is collected, compiled and evaluated. The whole
information is processed to make it useful for the business managers. At last the report will end
in investigating the process of budgetary planning and control. The study is in context with a
manufacturing organization named Jeffrey and Sons. It will discuss all the various management
accounting practices and technique for achieving the organizational goals.
TASK 1
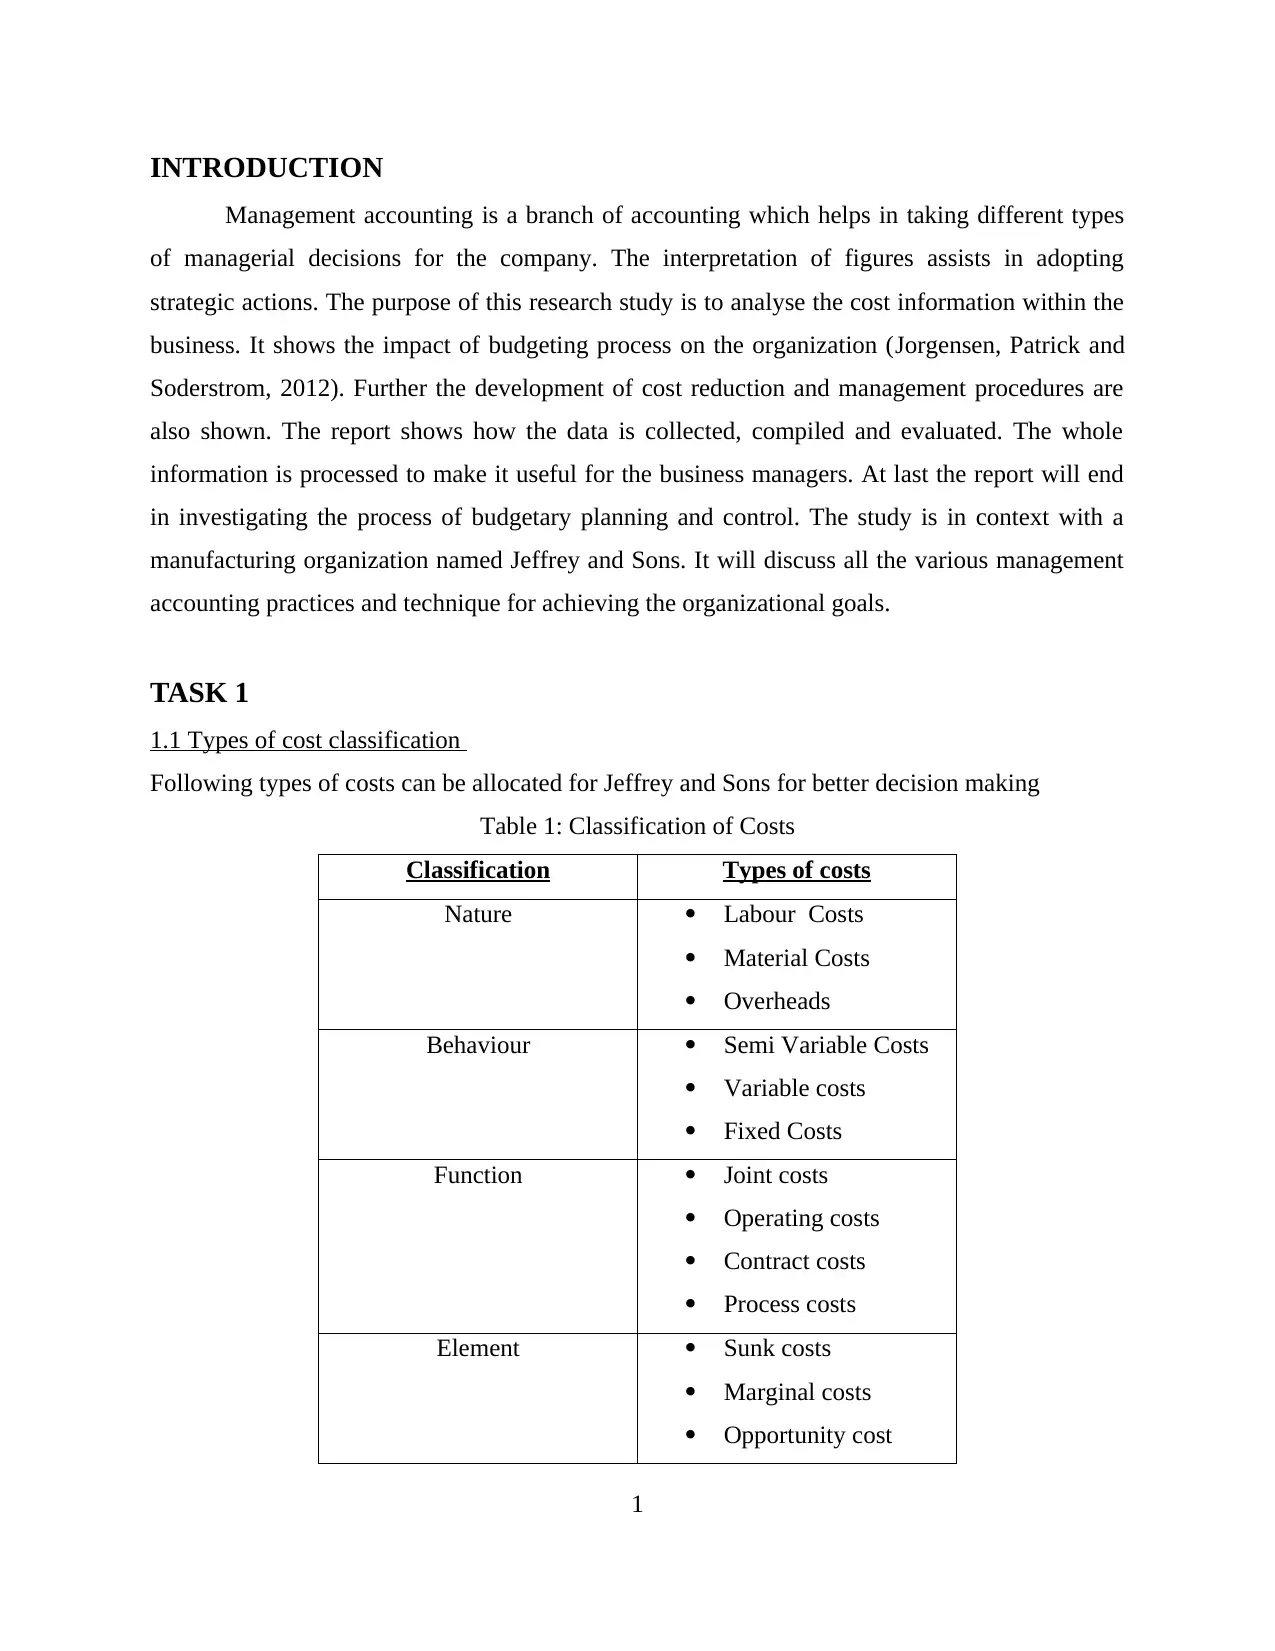
1.1 Types of cost classification
Following types of costs can be allocated for Jeffrey and Sons for better decision making
Table 1: Classification of Costs
Classification Types of costs
Nature Labour Costs
Material Costs
Overheads
Behaviour Semi Variable Costs
Variable costs
Fixed Costs
Function Joint costs
Operating costs
Contract costs
Process costs
Element Sunk costs
Marginal costs
Opportunity cost
1
Management accounting is a branch of accounting which helps in taking different types
of managerial decisions for the company. The interpretation of figures assists in adopting
strategic actions. The purpose of this research study is to analyse the cost information within the
business. It shows the impact of budgeting process on the organization (Jorgensen, Patrick and
Soderstrom, 2012). Further the development of cost reduction and management procedures are
also shown. The report shows how the data is collected, compiled and evaluated. The whole
information is processed to make it useful for the business managers. At last the report will end
in investigating the process of budgetary planning and control. The study is in context with a
manufacturing organization named Jeffrey and Sons. It will discuss all the various management
accounting practices and technique for achieving the organizational goals.
TASK 1
1.1 Types of cost classification
Following types of costs can be allocated for Jeffrey and Sons for better decision making
Table 1: Classification of Costs
Classification Types of costs
Nature Labour Costs
Material Costs
Overheads
Behaviour Semi Variable Costs
Variable costs
Fixed Costs
Function Joint costs
Operating costs
Contract costs
Process costs
Element Sunk costs
Marginal costs
Opportunity cost
1
Paraphrase This Document
Need a fresh take? Get an instant paraphrase of this document with our AI Paraphraser
Differential cost
Normal costs
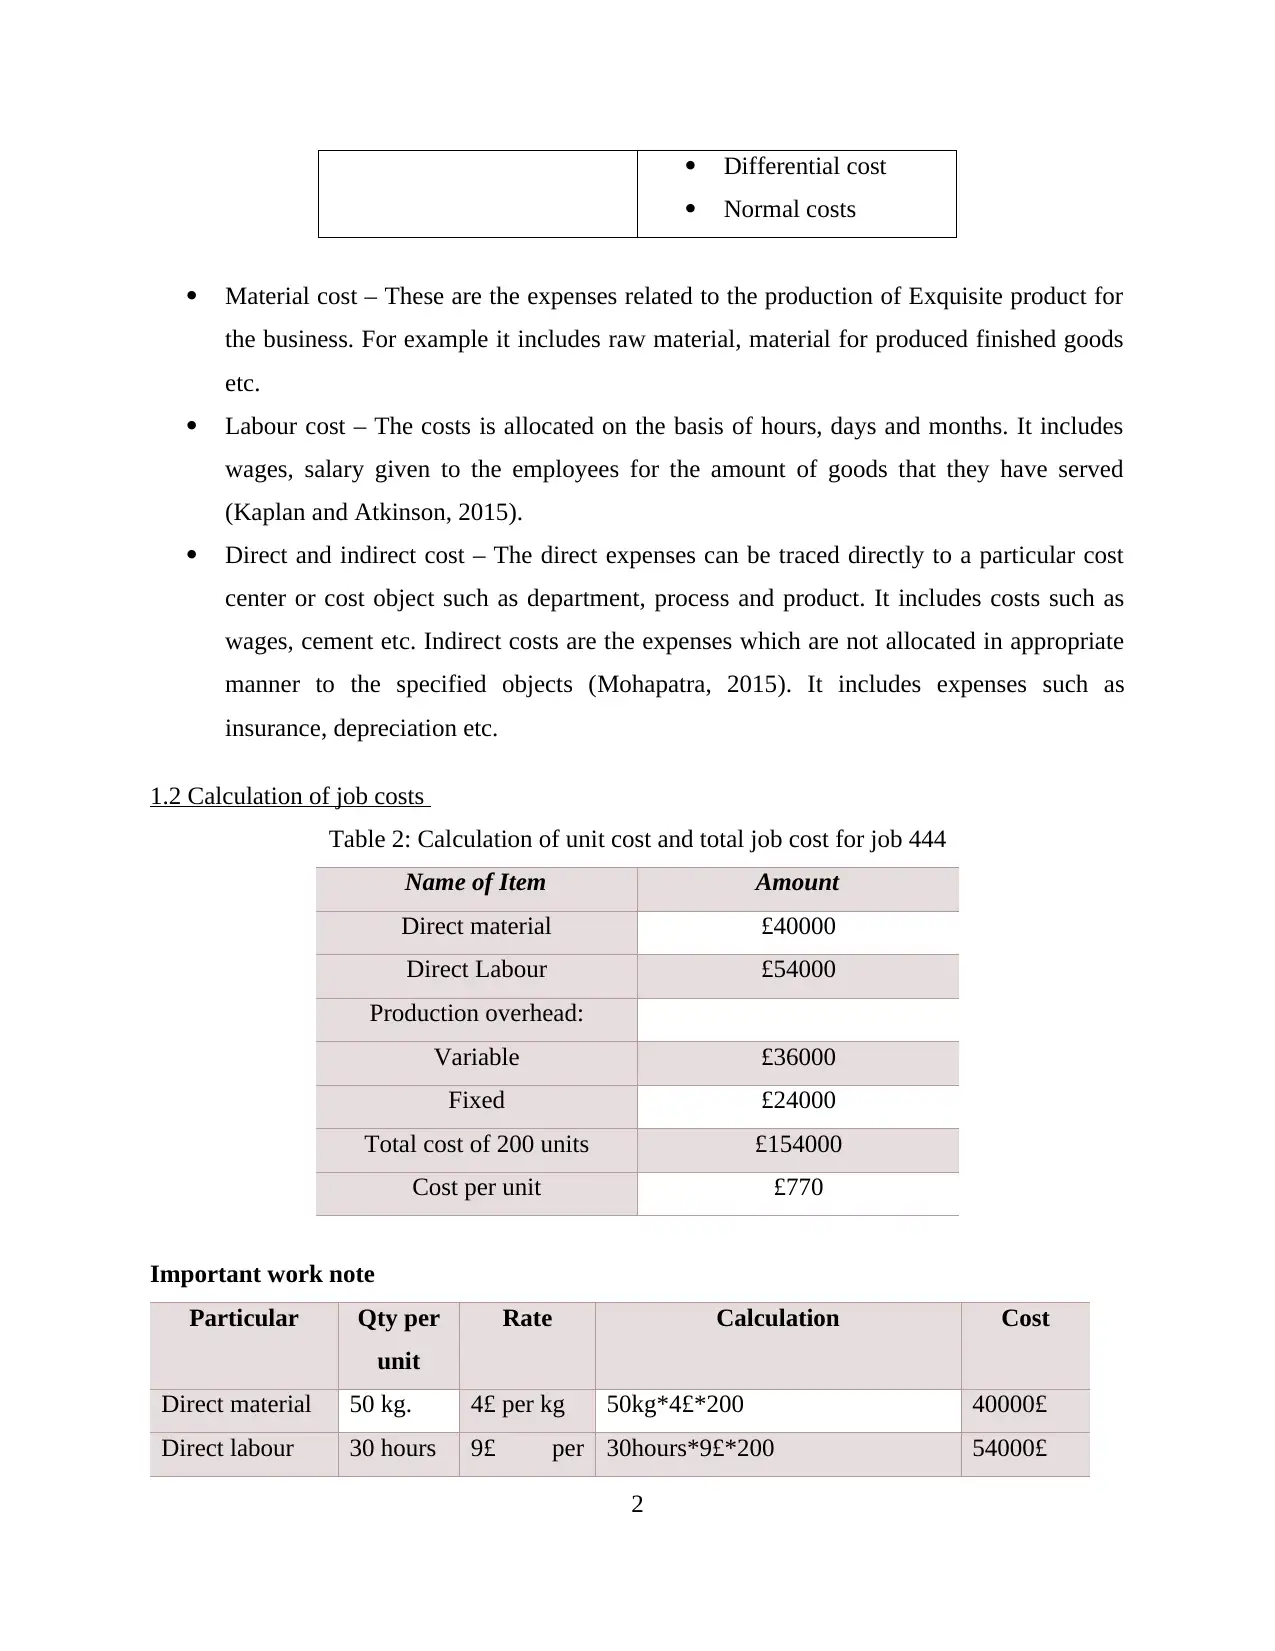
Material cost – These are the expenses related to the production of Exquisite product for
the business. For example it includes raw material, material for produced finished goods
etc.
Labour cost – The costs is allocated on the basis of hours, days and months. It includes
wages, salary given to the employees for the amount of goods that they have served
(Kaplan and Atkinson, 2015).
Direct and indirect cost – The direct expenses can be traced directly to a particular cost
center or cost object such as department, process and product. It includes costs such as
wages, cement etc. Indirect costs are the expenses which are not allocated in appropriate
manner to the specified objects (Mohapatra, 2015). It includes expenses such as
insurance, depreciation etc.
1.2 Calculation of job costs
Table 2: Calculation of unit cost and total job cost for job 444
Name of Item Amount
Direct material £40000
Direct Labour £54000
Production overhead:
Variable £36000
Fixed £24000
Total cost of 200 units £154000
Cost per unit £770
Important work note
Particular Qty per
unit
Rate Calculation Cost
Direct material 50 kg. 4£ per kg 50kg*4£*200 40000£
Direct labour 30 hours 9£ per 30hours*9£*200 54000£
2
Normal costs
Material cost – These are the expenses related to the production of Exquisite product for
the business. For example it includes raw material, material for produced finished goods
etc.
Labour cost – The costs is allocated on the basis of hours, days and months. It includes
wages, salary given to the employees for the amount of goods that they have served
(Kaplan and Atkinson, 2015).
Direct and indirect cost – The direct expenses can be traced directly to a particular cost
center or cost object such as department, process and product. It includes costs such as
wages, cement etc. Indirect costs are the expenses which are not allocated in appropriate
manner to the specified objects (Mohapatra, 2015). It includes expenses such as
insurance, depreciation etc.
1.2 Calculation of job costs
Table 2: Calculation of unit cost and total job cost for job 444
Name of Item Amount
Direct material £40000
Direct Labour £54000
Production overhead:
Variable £36000
Fixed £24000
Total cost of 200 units £154000
Cost per unit £770
Important work note
Particular Qty per
unit
Rate Calculation Cost
Direct material 50 kg. 4£ per kg 50kg*4£*200 40000£
Direct labour 30 hours 9£ per 30hours*9£*200 54000£
2
hour
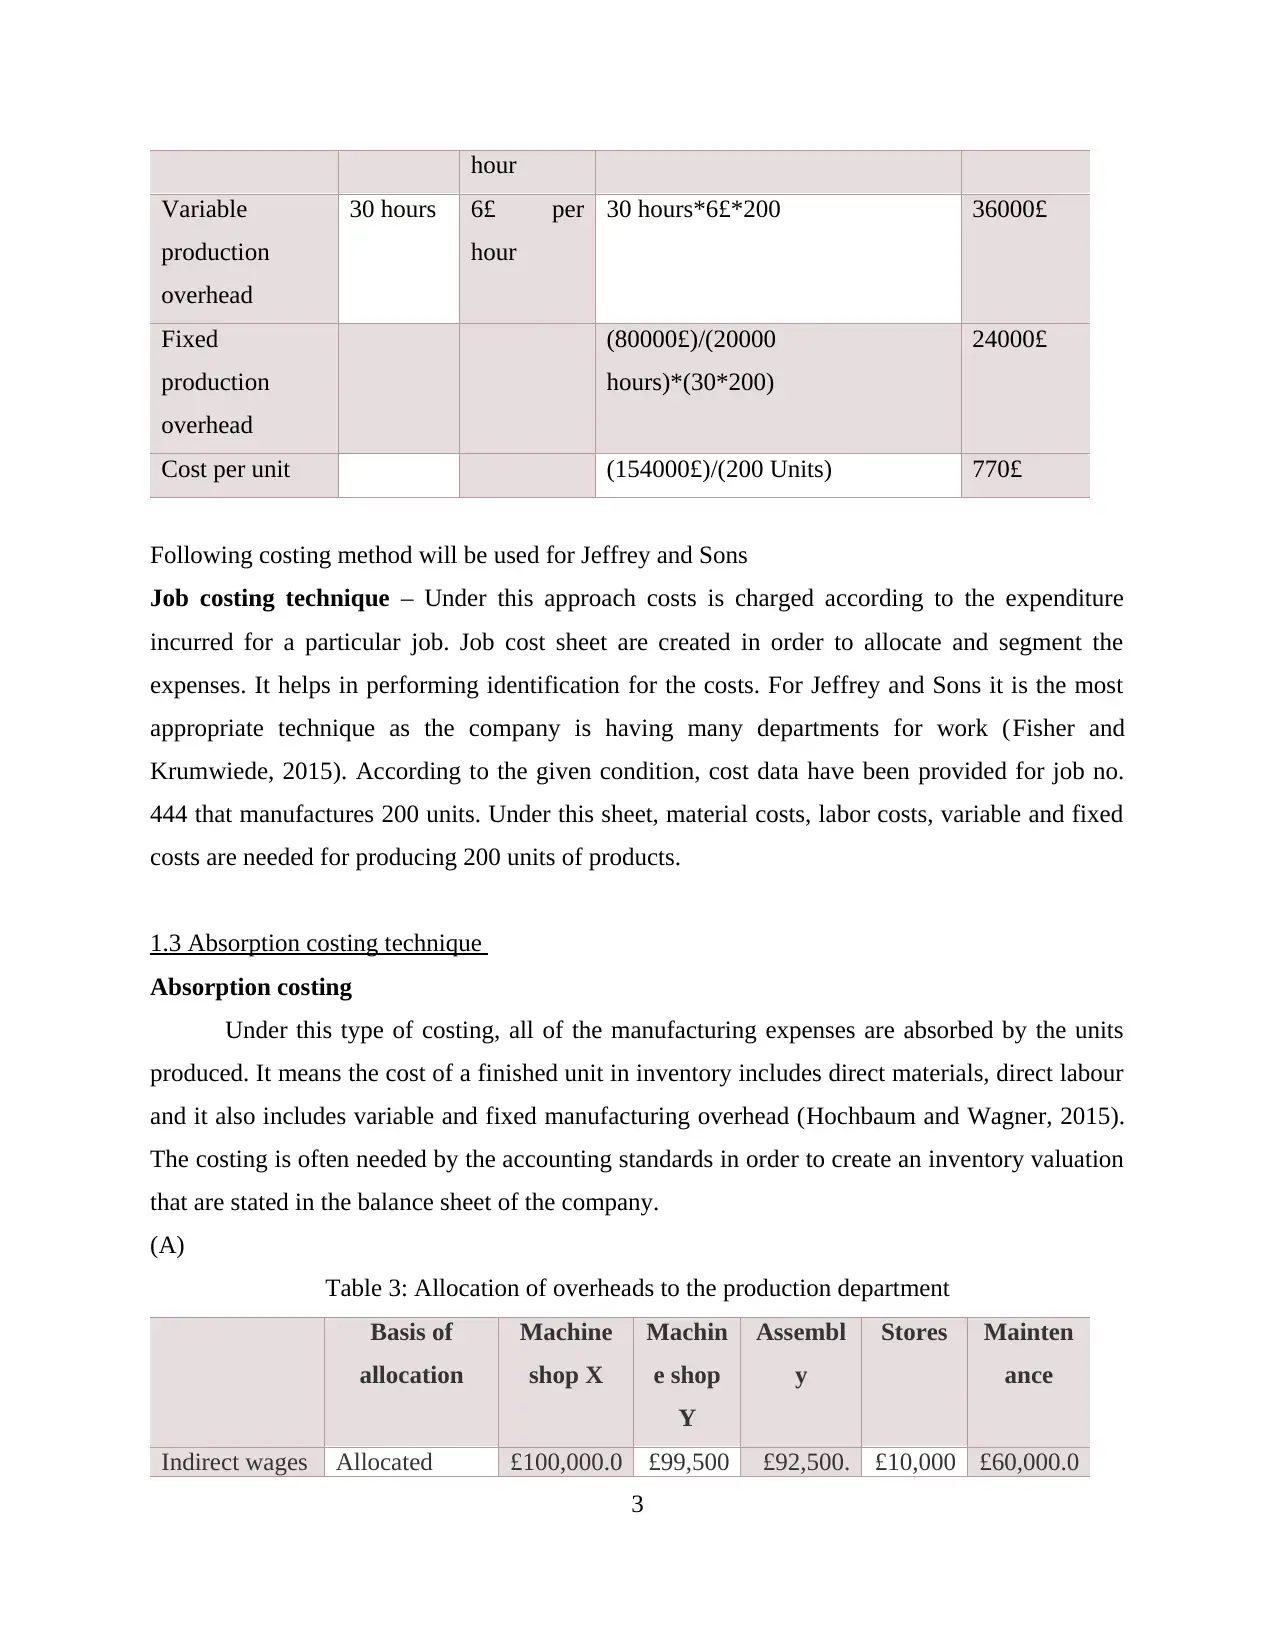
Variable
production
overhead
30 hours 6£ per
hour
30 hours*6£*200 36000£
Fixed
production
overhead
(80000£)/(20000
hours)*(30*200)
24000£
Cost per unit (154000£)/(200 Units) 770£
Following costing method will be used for Jeffrey and Sons
Job costing technique – Under this approach costs is charged according to the expenditure
incurred for a particular job. Job cost sheet are created in order to allocate and segment the
expenses. It helps in performing identification for the costs. For Jeffrey and Sons it is the most
appropriate technique as the company is having many departments for work (Fisher and
Krumwiede, 2015). According to the given condition, cost data have been provided for job no.
444 that manufactures 200 units. Under this sheet, material costs, labor costs, variable and fixed
costs are needed for producing 200 units of products.
1.3 Absorption costing technique
Absorption costing
Under this type of costing, all of the manufacturing expenses are absorbed by the units
produced. It means the cost of a finished unit in inventory includes direct materials, direct labour
and it also includes variable and fixed manufacturing overhead (Hochbaum and Wagner, 2015).
The costing is often needed by the accounting standards in order to create an inventory valuation
that are stated in the balance sheet of the company.
(A)
Table 3: Allocation of overheads to the production department
Basis of
allocation
Machine
shop X
Machin
e shop
Y
Assembl
y
Stores Mainten
ance
Indirect wages Allocated £100,000.0 £99,500 £92,500. £10,000 £60,000.0
3
⊘ This is a preview!⊘
Do you want full access?
Subscribe today to unlock all pages.
Trusted by 1+ million students worldwide
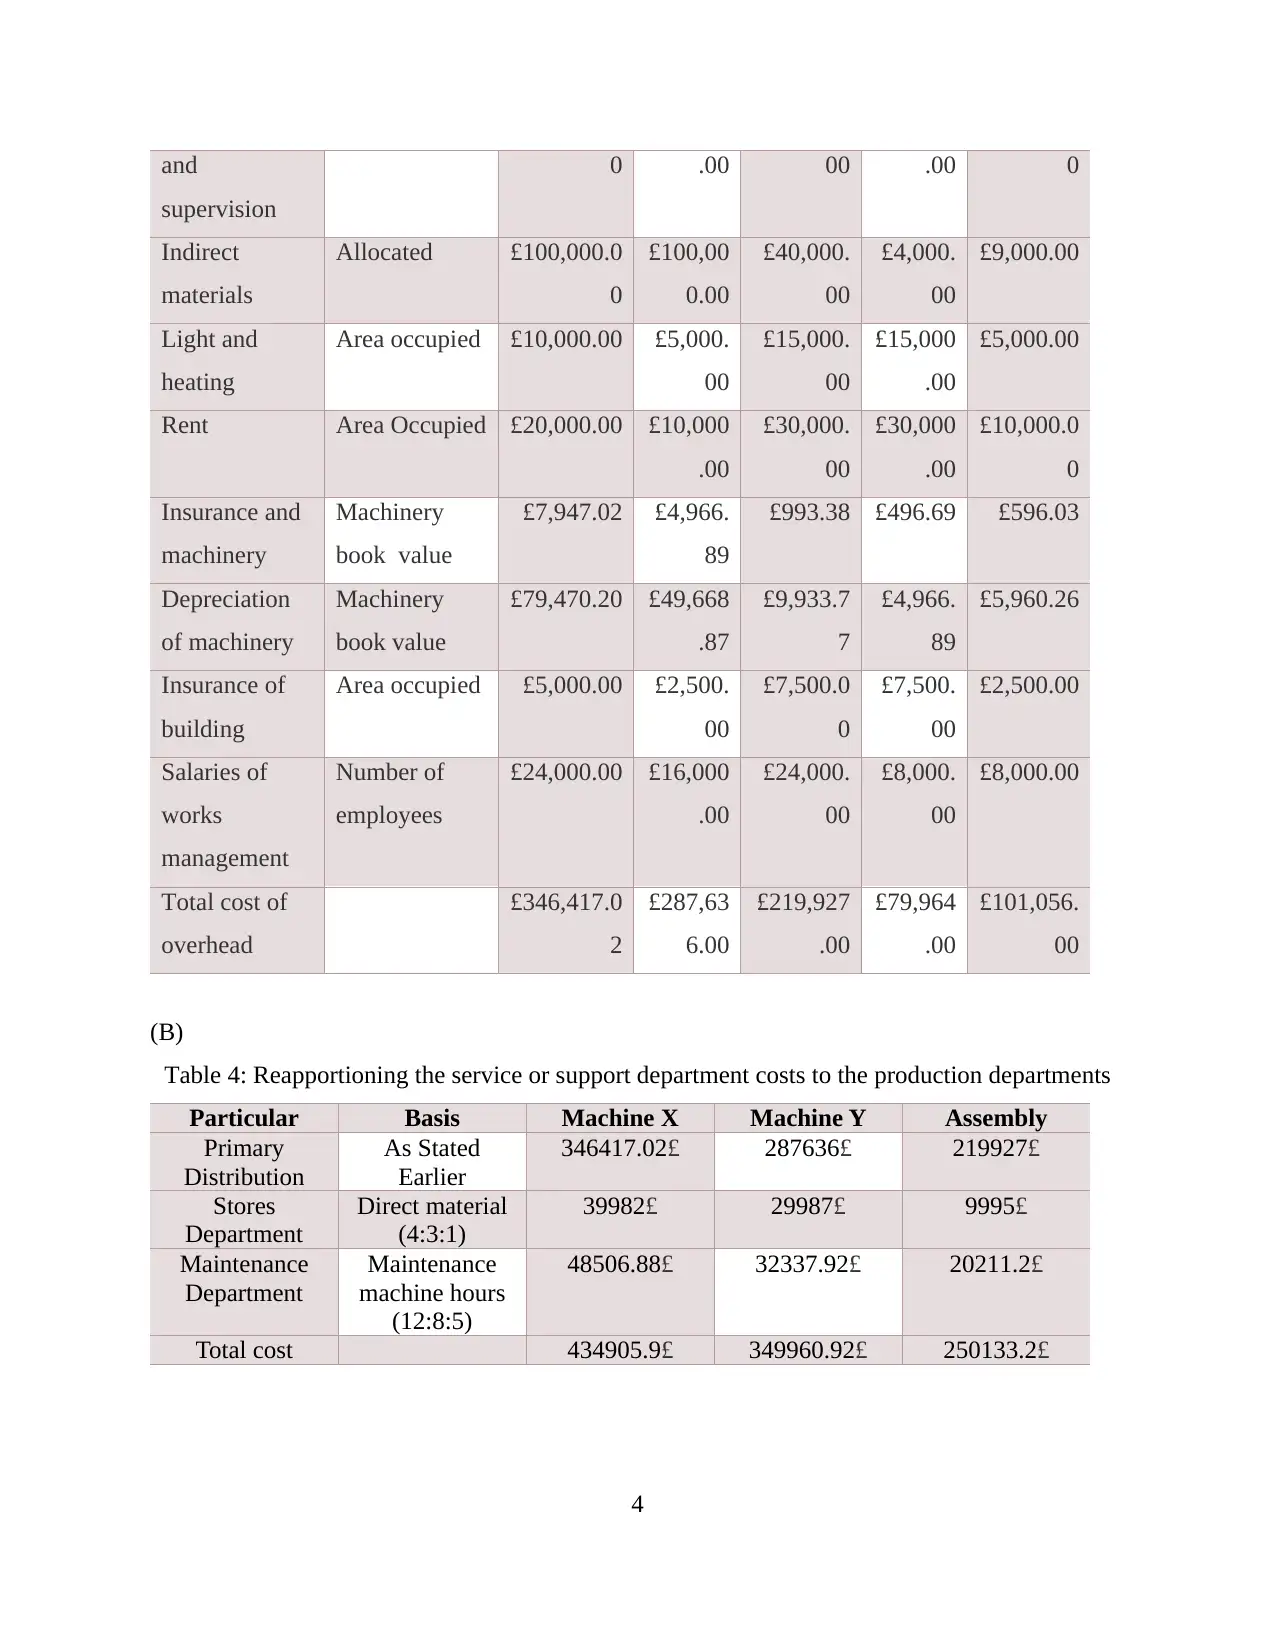
and
supervision
0 .00 00 .00 0
Indirect
materials
Allocated £100,000.0
0
£100,00
0.00
£40,000.
00
£4,000.
00
£9,000.00
Light and
heating
Area occupied £10,000.00 £5,000.
00
£15,000.
00
£15,000
.00
£5,000.00
Rent Area Occupied £20,000.00 £10,000
.00
£30,000.
00
£30,000
.00
£10,000.0
0
Insurance and
machinery
Machinery
book value
£7,947.02 £4,966.
89
£993.38 £496.69 £596.03
Depreciation
of machinery
Machinery
book value
£79,470.20 £49,668
.87
£9,933.7
7
£4,966.
89
£5,960.26
Insurance of
building
Area occupied £5,000.00 £2,500.
00
£7,500.0
0
£7,500.
00
£2,500.00
Salaries of
works
management
Number of
employees
£24,000.00 £16,000
.00
£24,000.
00
£8,000.
00
£8,000.00
Total cost of
overhead
£346,417.0
2
£287,63
6.00
£219,927
.00
£79,964
.00
£101,056.
00
(B)
Table 4: Reapportioning the service or support department costs to the production departments
Particular Basis Machine X Machine Y Assembly
Primary
Distribution
As Stated
Earlier
346417.02£ 287636£ 219927£
Stores
Department
Direct material
(4:3:1)
39982£ 29987£ 9995£
Maintenance
Department
Maintenance
machine hours
(12:8:5)
48506.88£ 32337.92£ 20211.2£
Total cost 434905.9£ 349960.92£ 250133.2£
4
Paraphrase This Document
Need a fresh take? Get an instant paraphrase of this document with our AI Paraphraser
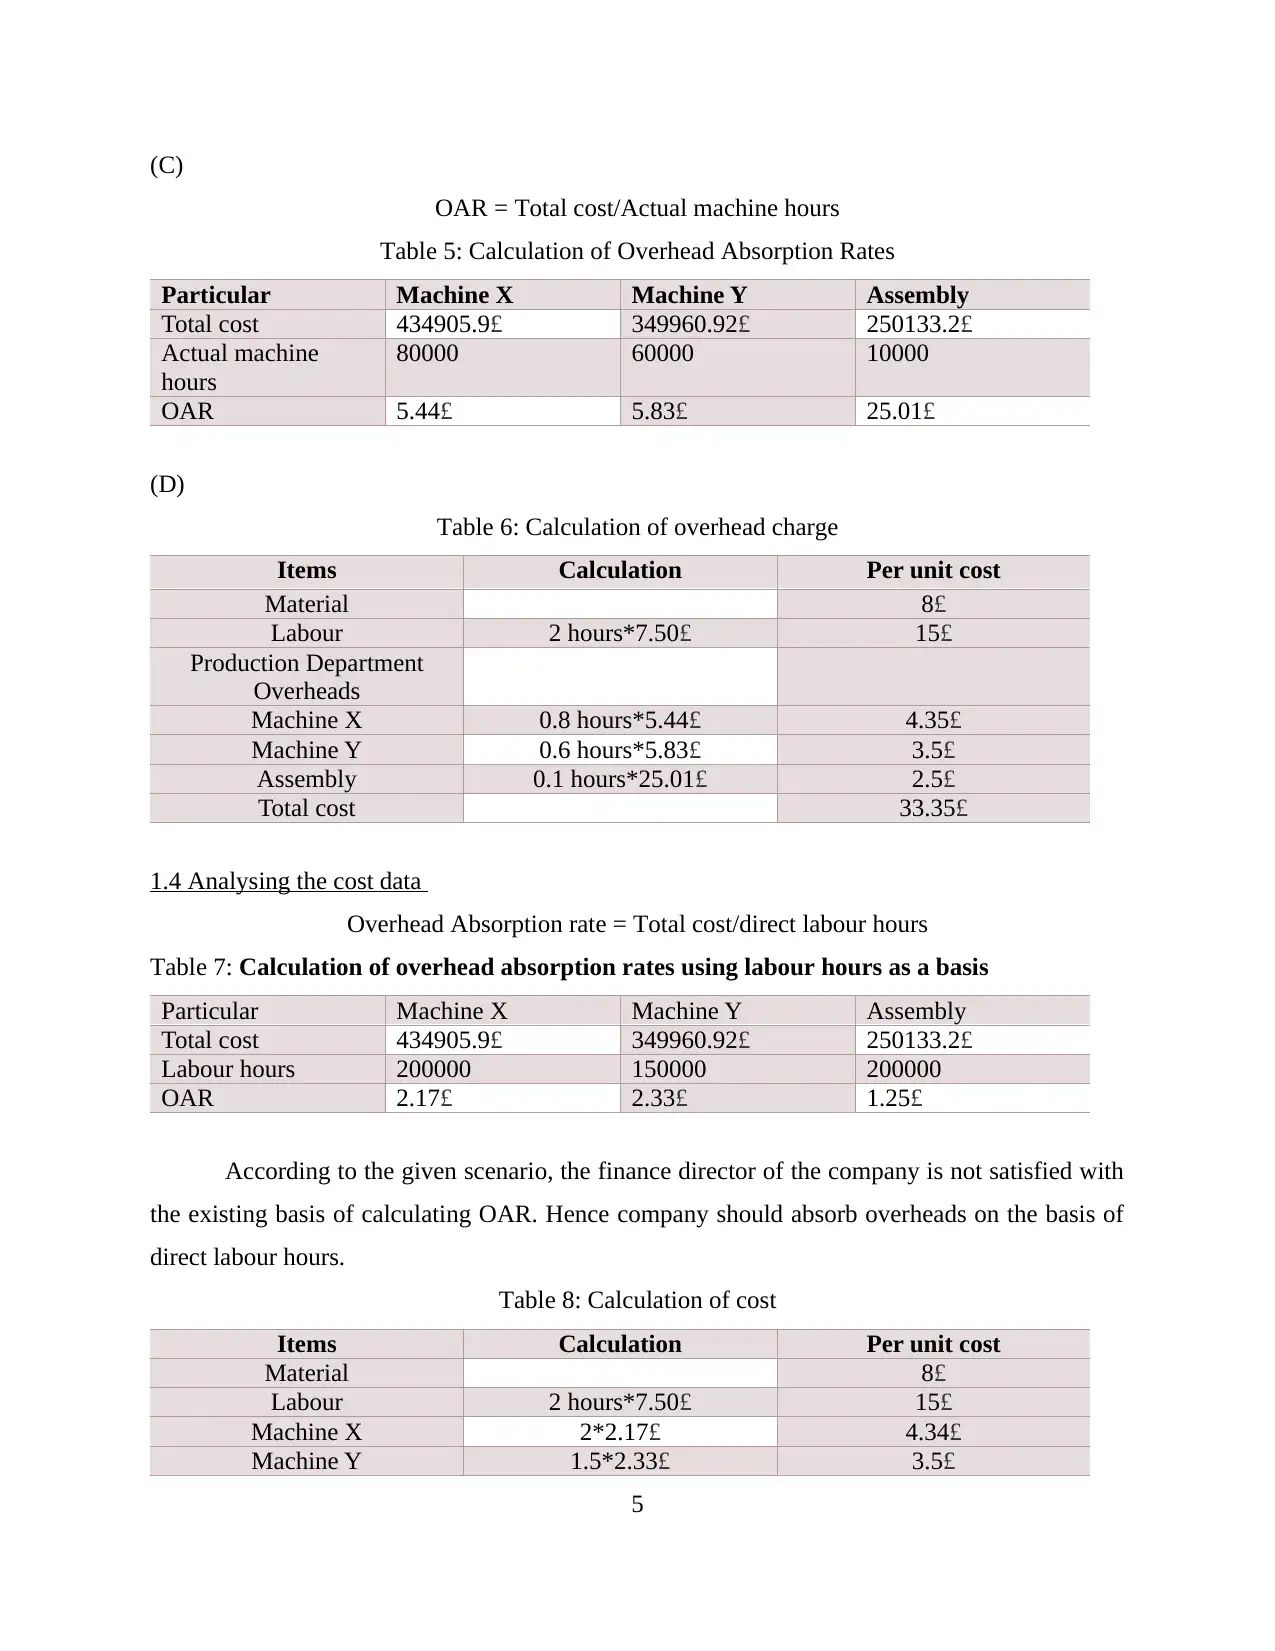
(C)
OAR = Total cost/Actual machine hours
Table 5: Calculation of Overhead Absorption Rates
Particular Machine X Machine Y Assembly
Total cost 434905.9£ 349960.92£ 250133.2£
Actual machine
hours
80000 60000 10000
OAR 5.44£ 5.83£ 25.01£
(D)
Table 6: Calculation of overhead charge
Items Calculation Per unit cost
Material 8£
Labour 2 hours*7.50£ 15£
Production Department
Overheads
Machine X 0.8 hours*5.44£ 4.35£
Machine Y 0.6 hours*5.83£ 3.5£
Assembly 0.1 hours*25.01£ 2.5£
Total cost 33.35£
1.4 Analysing the cost data
Overhead Absorption rate = Total cost/direct labour hours
Table 7: Calculation of overhead absorption rates using labour hours as a basis
Particular Machine X Machine Y Assembly
Total cost 434905.9£ 349960.92£ 250133.2£
Labour hours 200000 150000 200000
OAR 2.17£ 2.33£ 1.25£
According to the given scenario, the finance director of the company is not satisfied with
the existing basis of calculating OAR. Hence company should absorb overheads on the basis of
direct labour hours.
Table 8: Calculation of cost
Items Calculation Per unit cost
Material 8£
Labour 2 hours*7.50£ 15£
Machine X 2*2.17£ 4.34£
Machine Y 1.5*2.33£ 3.5£
5
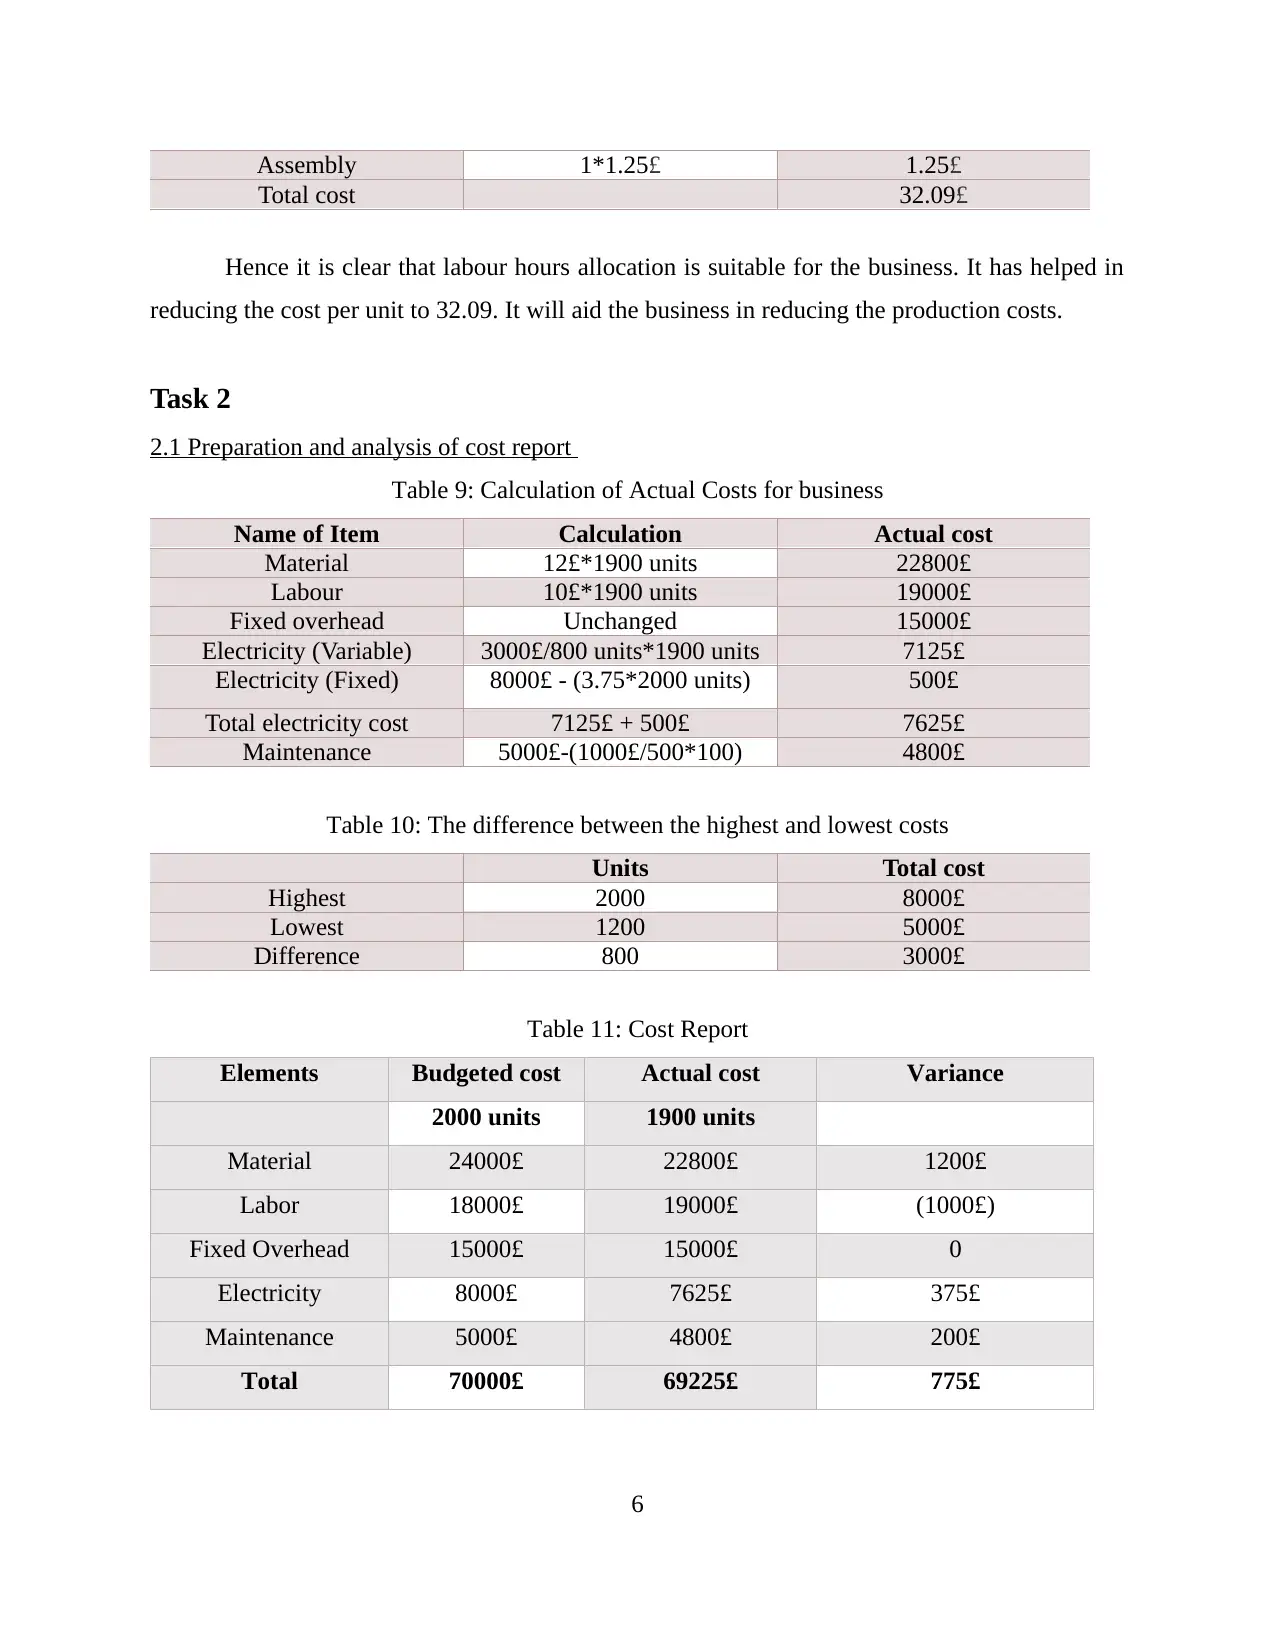
Assembly 1*1.25£ 1.25£
Total cost 32.09£
Hence it is clear that labour hours allocation is suitable for the business. It has helped in
reducing the cost per unit to 32.09. It will aid the business in reducing the production costs.
Task 2
2.1 Preparation and analysis of cost report
Table 9: Calculation of Actual Costs for business
Name of Item Calculation Actual cost
Material 12£*1900 units 22800£
Labour 10£*1900 units 19000£
Fixed overhead Unchanged 15000£
Electricity (Variable) 3000£/800 units*1900 units 7125£
Electricity (Fixed) 8000£ - (3.75*2000 units) 500£
Total electricity cost 7125£ + 500£ 7625£
Maintenance 5000£-(1000£/500*100) 4800£
Table 10: The difference between the highest and lowest costs
Units Total cost
Highest 2000 8000£
Lowest 1200 5000£
Difference 800 3000£
Table 11: Cost Report
Elements Budgeted cost Actual cost Variance
2000 units 1900 units
Material 24000£ 22800£ 1200£
Labor 18000£ 19000£ (1000£)
Fixed Overhead 15000£ 15000£ 0
Electricity 8000£ 7625£ 375£
Maintenance 5000£ 4800£ 200£
Total 70000£ 69225£ 775£
6
⊘ This is a preview!⊘
Do you want full access?
Subscribe today to unlock all pages.
Trusted by 1+ million students worldwide
Within Jeffrey & Sons the managers forecasted the business expenditures for
manufacturing of 2000 units. These expenditure involves material, labour, fixed and variable
overheads. The above cost report is prepared on the basis of identification of actual cost for
manufacturing 1900 units and the variance (Budgeting and budgetary control, n.d.).
Reasons for variances
From the above calculated variances it is evident that maintenance, material and
electricity variances impacts the profits in positive manner (Anderson, 2011)
The variance in the labour cost denotes impact on the company’s profitability
Another reason for the variances is the reduction in the production volume which has
decreased from 2000 units to 1900 units.
The actual material costs has also declined due to reduction in the total business
production and on the other side the material prices remain unchanged from the budget
(Cohen and Kaimenaki, 2011).
The high labour rate has resulted in negative labour variance of 1000£.
Electricity costs of semi-variable nature which has remained constant up to 500£ and
after that it has changed according to the changes in volume. Variance of 375£ has
emerged due to reduction in the volume up to 1900 units (Drake and Fabozzi, 2012).
As per the scenario, maintenance is a steeped cost which has increased by 1000£ for
producing 500 additional units and vice versa. Hence because of that the actual cost
decreases up to 4800£ due to reduction of 1000 units.
2.2 Performance indicator for areas of improvements
There can be many performance indicators for the business of Jeffrey & Sons. These are as
follows:
Profits – It is the most important indicator for performance. The financial position is
reflected in very effective manner through profits. The ups and downs in the profits can
find out the areas of improvements within business (Iazzolino, Laise, and Marraro, 2012).
Measuring of profits also assists in making of different types of strategic decisions.
Sales – The amount of sales arises from the selling of goods and services. The number of
sales reflects how much amount of inventory has been converted into the sales. Jeffery
and Sons can derive sales by selling exquisite products to the customers. Efforts can be
7
Paraphrase This Document
Need a fresh take? Get an instant paraphrase of this document with our AI Paraphraser
made to increase the sales if the actual sales are lower as compared to estimated sales
(Robb and Woodyard, 2011).
Costs – It is another performance indicator. Every business expects that costing must not
go higher than the expenses. Increase in costs such as labour, material, overheads etc can
increase the budget for the business also. Hence the variances noticed in the budgets can
find out the areas of improvement within the operations.
Ratio analysis – It is another instrument for measuring the liquidity, solvency, efficiency
and gearing position of the organization (Smith and Jacobs, 2011). Different types of
ratios are calculated to compare the financial performance. However the technique is
based on past performance not the future performance
Financial statements – They are also good reflector of business performance. It includes
three main statements which are balance sheet, cash flow statement and income
statement. They also denotes the liquidity and profitability of the company (Halabi and
Carroll, 2015)
2.3 Methods to reduce the cost, improve quality
There can be methods to reduce the cost and improve the quality within the business of
Jeffery and Sons. First of all there should of optimum utilization of resources. It means no
resources are to be wasted. A complete check is to be made on the use of their quantity. The raw
materials and inputs can be purchased at the time when the prices are favourable in the market. It
can aid in reducing the cost of production (Loo, Verstegen and Swagerman, D., 2011). Costs can
also be controlled by adopting budgeting process and by making costing schedule. The approach
is very effective in keeping a traceability check on different types of costs. Use of technology
can also improve the cost and quality for Jeffery and Sons. It has been seen that capital intensive
technology has produced very effective results for the business (Adler, 2013). Techniques such
as TQM (Total Quality Management), Just in Time, Quality circle, etc are very effective in
producing quality.
Total Quality Management is a very comprehensive and structured approach which helps
in improving the quality of products and services. It is done through ongoing refinements in
response to the continuous feedback (Holtzman, 2013). Just in Time is an inventory strategy
which can be employed by the company in order to increase the efficiency and decrease the
8
waste. Under this process, the goods are received only when they are needed in the production
process. Hence it reduces the inventory costs. It is a good approach to maintain quality and to
make optimum utilization of the resources. Quality circle is another very effectual approach to
maintain quality throughout the processes (Boyns and Edwards, 2013). Under this method, a
quality circle is made which means employees are engaged to find out the solution for a specific
problem.
Task 3
3.1 Budgeting process
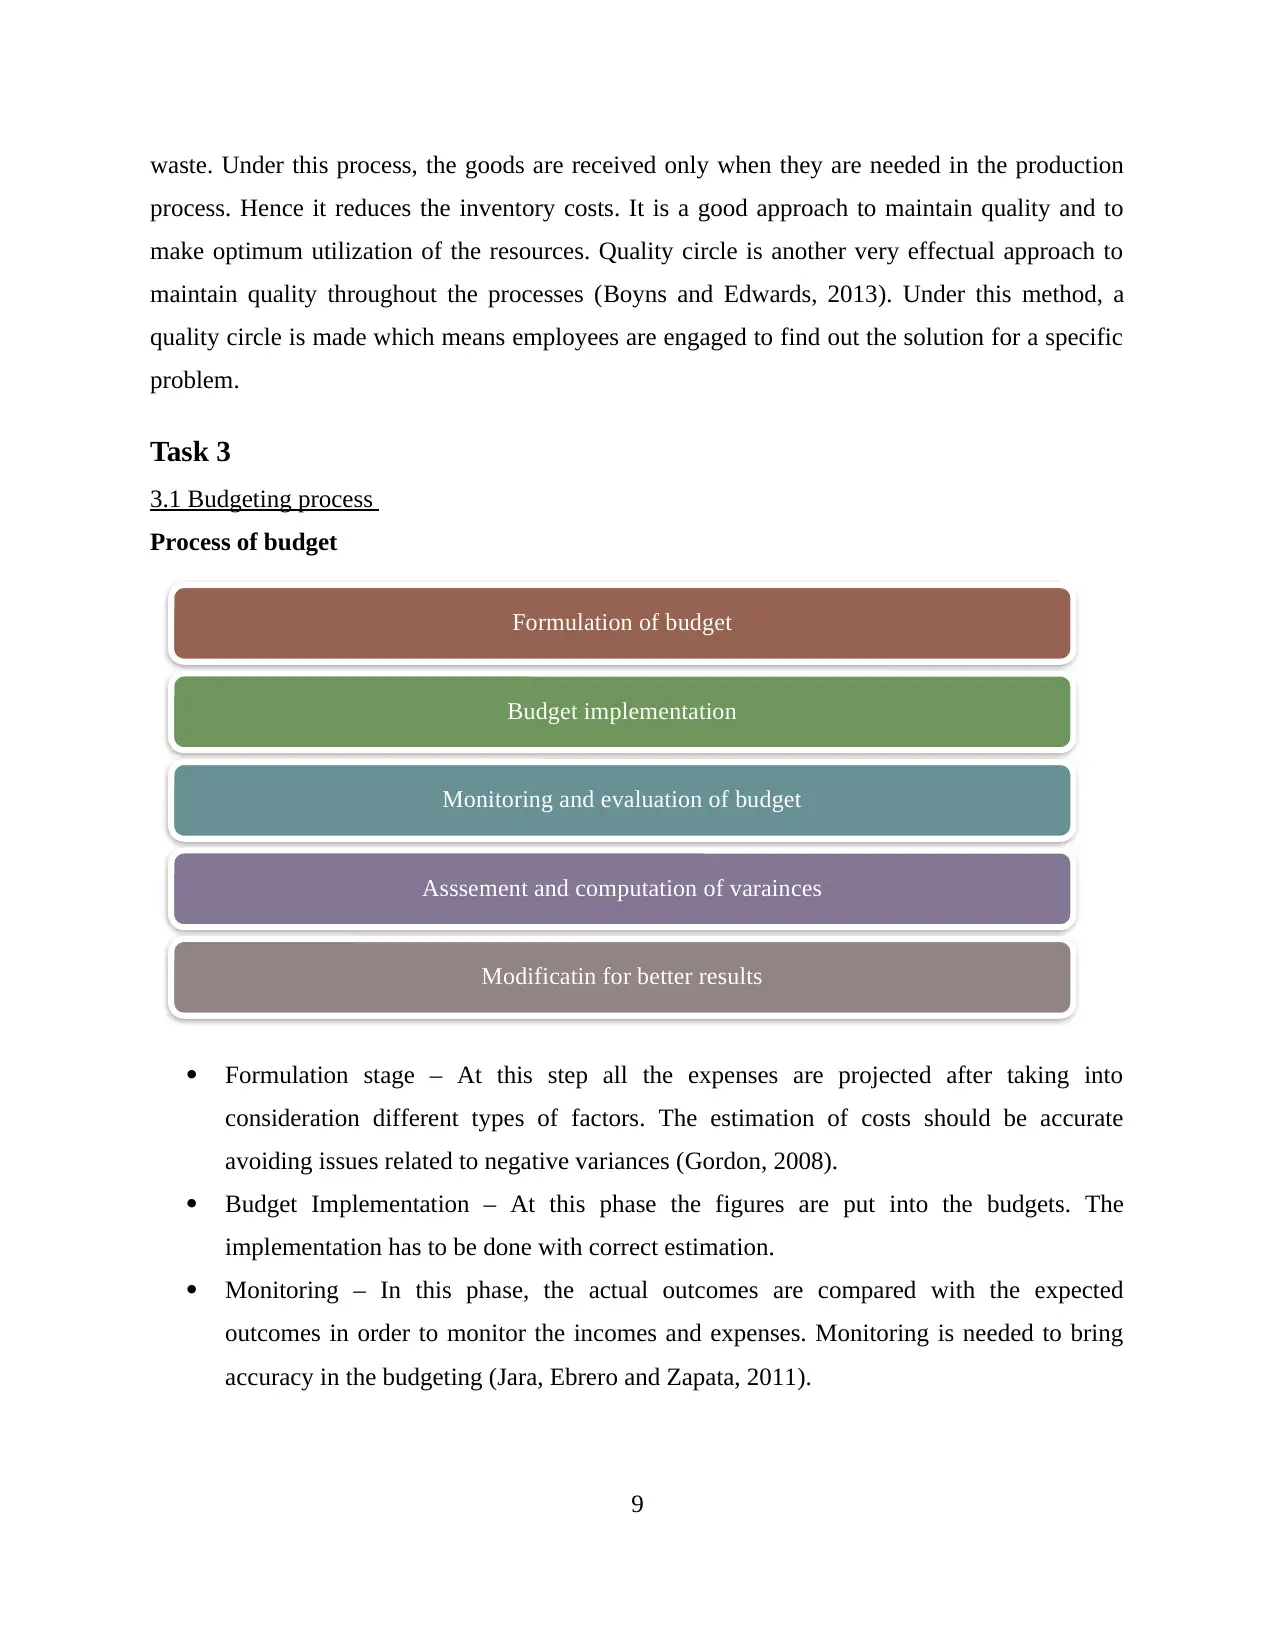
Process of budget
Formulation stage – At this step all the expenses are projected after taking into
consideration different types of factors. The estimation of costs should be accurate
avoiding issues related to negative variances (Gordon, 2008).
Budget Implementation – At this phase the figures are put into the budgets. The
implementation has to be done with correct estimation.
Monitoring – In this phase, the actual outcomes are compared with the expected
outcomes in order to monitor the incomes and expenses. Monitoring is needed to bring
accuracy in the budgeting (Jara, Ebrero and Zapata, 2011).
9
Formulation of budget
Budget implementation
Monitoring and evaluation of budget
Asssement and computation of varainces
Modificatin for better results
process. Hence it reduces the inventory costs. It is a good approach to maintain quality and to
make optimum utilization of the resources. Quality circle is another very effectual approach to
maintain quality throughout the processes (Boyns and Edwards, 2013). Under this method, a
quality circle is made which means employees are engaged to find out the solution for a specific
problem.
Task 3
3.1 Budgeting process
Process of budget
Formulation stage – At this step all the expenses are projected after taking into
consideration different types of factors. The estimation of costs should be accurate
avoiding issues related to negative variances (Gordon, 2008).
Budget Implementation – At this phase the figures are put into the budgets. The
implementation has to be done with correct estimation.
Monitoring – In this phase, the actual outcomes are compared with the expected
outcomes in order to monitor the incomes and expenses. Monitoring is needed to bring
accuracy in the budgeting (Jara, Ebrero and Zapata, 2011).
9
Formulation of budget
Budget implementation
Monitoring and evaluation of budget
Asssement and computation of varainces
Modificatin for better results
⊘ This is a preview!⊘
Do you want full access?
Subscribe today to unlock all pages.
Trusted by 1+ million students worldwide
1 out of 20
Related Documents


Your All-in-One AI-Powered Toolkit for Academic Success.
+13062052269
info@desklib.com
Available 24*7 on WhatsApp / Email
![[object Object]](/_next/static/media/star-bottom.7253800d.svg)
Unlock your academic potential
Copyright © 2020–2026 A2Z Services. All Rights Reserved. Developed and managed by ZUCOL.