Management Accounting Report: Cost Analysis, Budgeting and Variance
VerifiedAdded on 2020/01/28
|18
|5408
|408
Report
AI Summary
This management accounting report examines cost classification based on elements, functions, nature, and behavior, followed by unit cost calculations and the application of absorption costing. The report then delves into performance indicators, cost reduction strategies, and the budgeting process, including the preparation of production and material purchase budgets, as well as a cash budget. Variance analysis is conducted, with recommendations for corrective actions, and a reconciliation statement is presented. The report concludes with an explanation of responsibility centers and their roles in managing budget variances. The report provides a detailed analysis of the financial aspects of an organization, focusing on cost management, budgeting, and performance evaluation. The report uses tables to showcase the calculations and analysis, making it easier to understand the financial aspects of the organization. The report highlights the importance of variance analysis and offers suggestions to improve business decisions for better financial performance.
MANAGEMENT
ACCOUNTING
ACCOUNTING
Paraphrase This Document
Need a fresh take? Get an instant paraphrase of this document with our AI Paraphraser
TABLE OF CONTENTS
INTRODUCTION...........................................................................................................................3
TASK 1............................................................................................................................................3
1.1 Classification of cost on the basis of nature..........................................................................3
1.2 Calculation of unit cost.........................................................................................................4
1.3 Calculation of the cost by using absorption costing technique.............................................5
1.4 Calculation of overhead absorption rate using direct labor hours.........................................6
TASK 2............................................................................................................................................7
2.1 Preparation of cost sheet and variance analysis...................................................................7
2.2 Various performance indicators used to identify the areas of potential improvements........8
2.3 Ways to reduce cost, enhance value and quality...................................................................9
TASK 3 ...........................................................................................................................................9
3.1 Nature and purpose of budgeting process.............................................................................9
3.2 Appropriate budgeting method for the organization and its need.......................................10
3.3 Material purchase budget and production requirement budget...........................................11
3.4 preparation of cash budget.................................................................................................12
TASK 4..........................................................................................................................................13
4.1, 4.2 Variance analysis and recommendation corrective actions.........................................13
4.2 Reconciliation statement ....................................................................................................15
4.3 Identifications of responsibility centers.............................................................................15
CONCLUSION..............................................................................................................................16
REFERENCES..............................................................................................................................17
INDEX OF TABLES
Table 1: Calculation of total cost and per unit cost for a job...........................................................5
Table 2: Calculation of overhead absorption rate using direct labor hours.....................................7
Table 3: Preparation of budgeted and actual cost (In £)..................................................................8
Table 4: Variance analysis...............................................................................................................8
Table 5: Production budget for July, August and September (In Units).......................................12
Table 6: Material purchase budget.................................................................................................13
Table 7: Reconciliation statement .................................................................................................16
Table 8: Responsibility centers......................................................................................................16
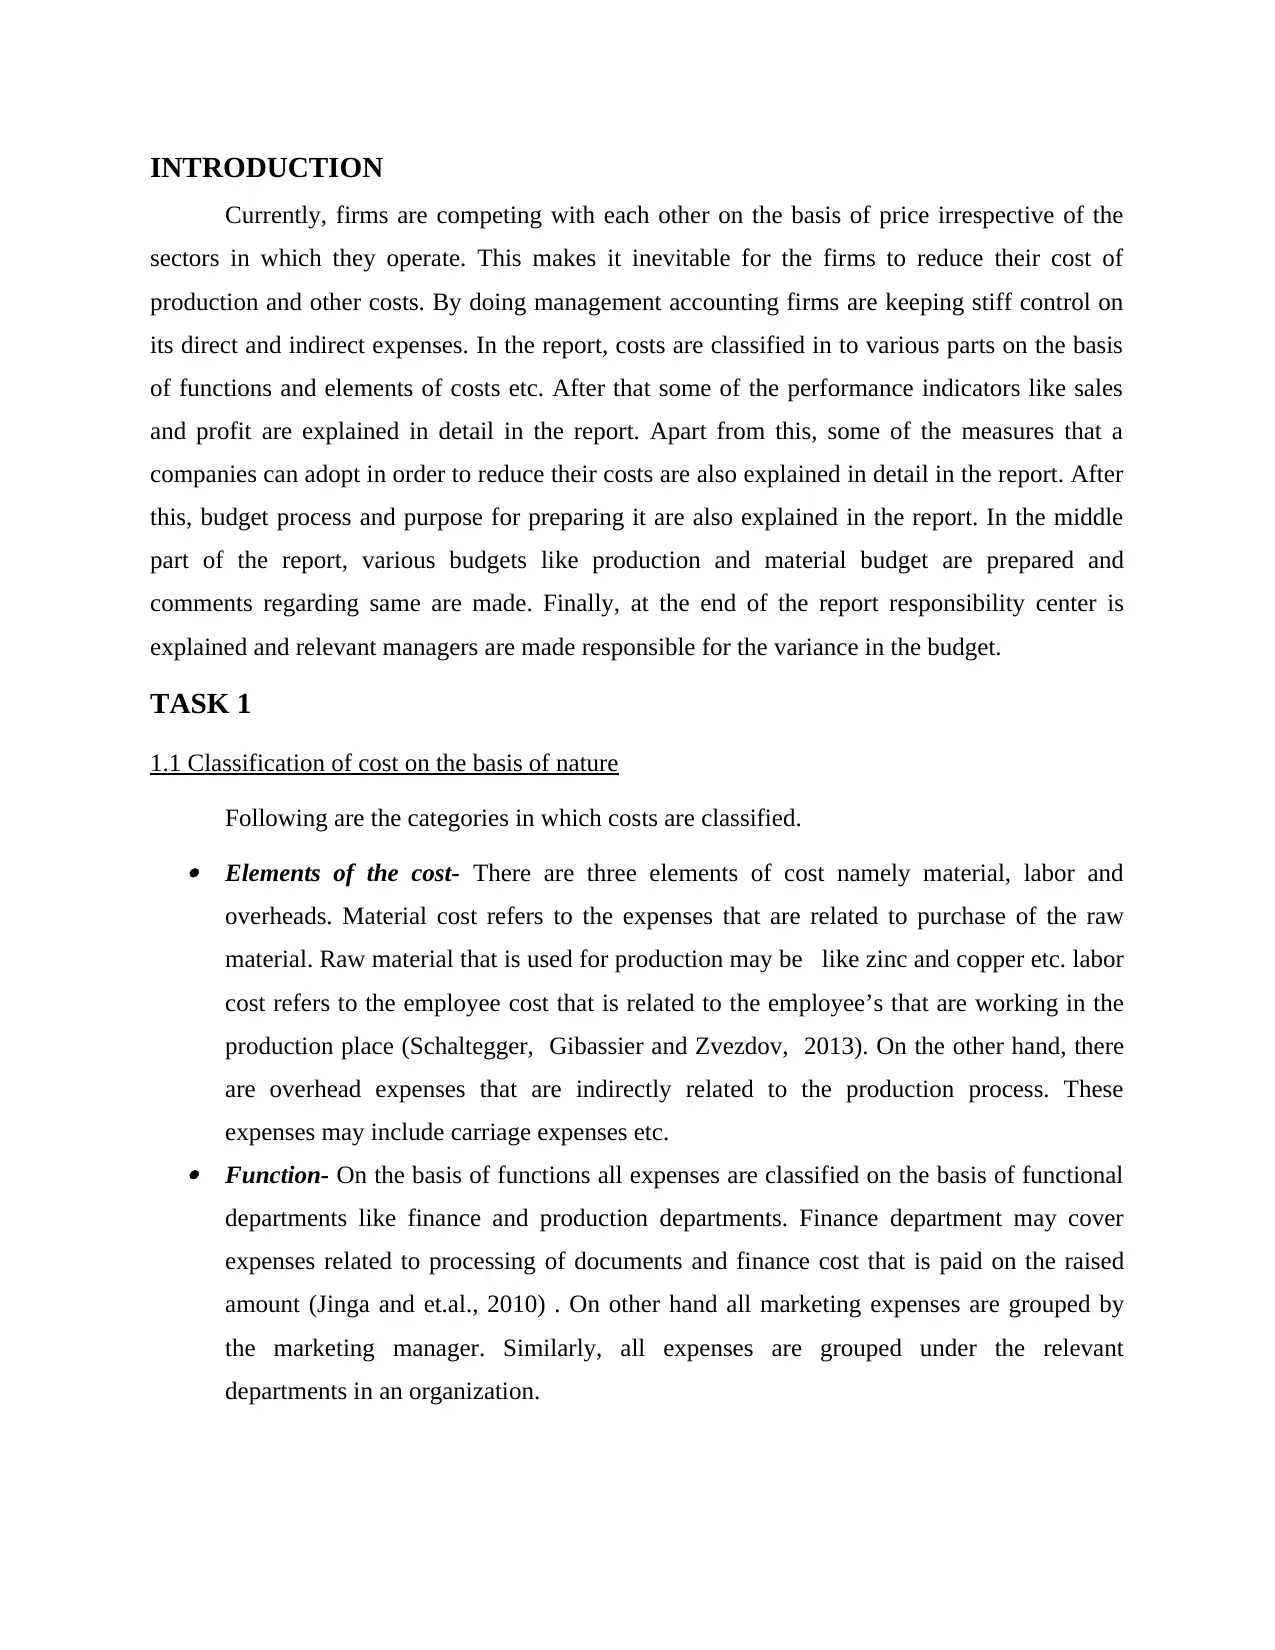
INTRODUCTION
Currently, firms are competing with each other on the basis of price irrespective of the
sectors in which they operate. This makes it inevitable for the firms to reduce their cost of
production and other costs. By doing management accounting firms are keeping stiff control on
its direct and indirect expenses. In the report, costs are classified in to various parts on the basis
of functions and elements of costs etc. After that some of the performance indicators like sales
and profit are explained in detail in the report. Apart from this, some of the measures that a
companies can adopt in order to reduce their costs are also explained in detail in the report. After
this, budget process and purpose for preparing it are also explained in the report. In the middle
part of the report, various budgets like production and material budget are prepared and
comments regarding same are made. Finally, at the end of the report responsibility center is
explained and relevant managers are made responsible for the variance in the budget.
TASK 1
1.1 Classification of cost on the basis of nature
Following are the categories in which costs are classified. Elements of the cost- There are three elements of cost namely material, labor and
overheads. Material cost refers to the expenses that are related to purchase of the raw
material. Raw material that is used for production may be like zinc and copper etc. labor
cost refers to the employee cost that is related to the employee’s that are working in the
production place (Schaltegger, Gibassier and Zvezdov, 2013). On the other hand, there
are overhead expenses that are indirectly related to the production process. These
expenses may include carriage expenses etc. Function- On the basis of functions all expenses are classified on the basis of functional
departments like finance and production departments. Finance department may cover
expenses related to processing of documents and finance cost that is paid on the raised
amount (Jinga and et.al., 2010) . On other hand all marketing expenses are grouped by
the marketing manager. Similarly, all expenses are grouped under the relevant
departments in an organization.
⊘ This is a preview!⊘
Do you want full access?
Subscribe today to unlock all pages.
Trusted by 1+ million students worldwide
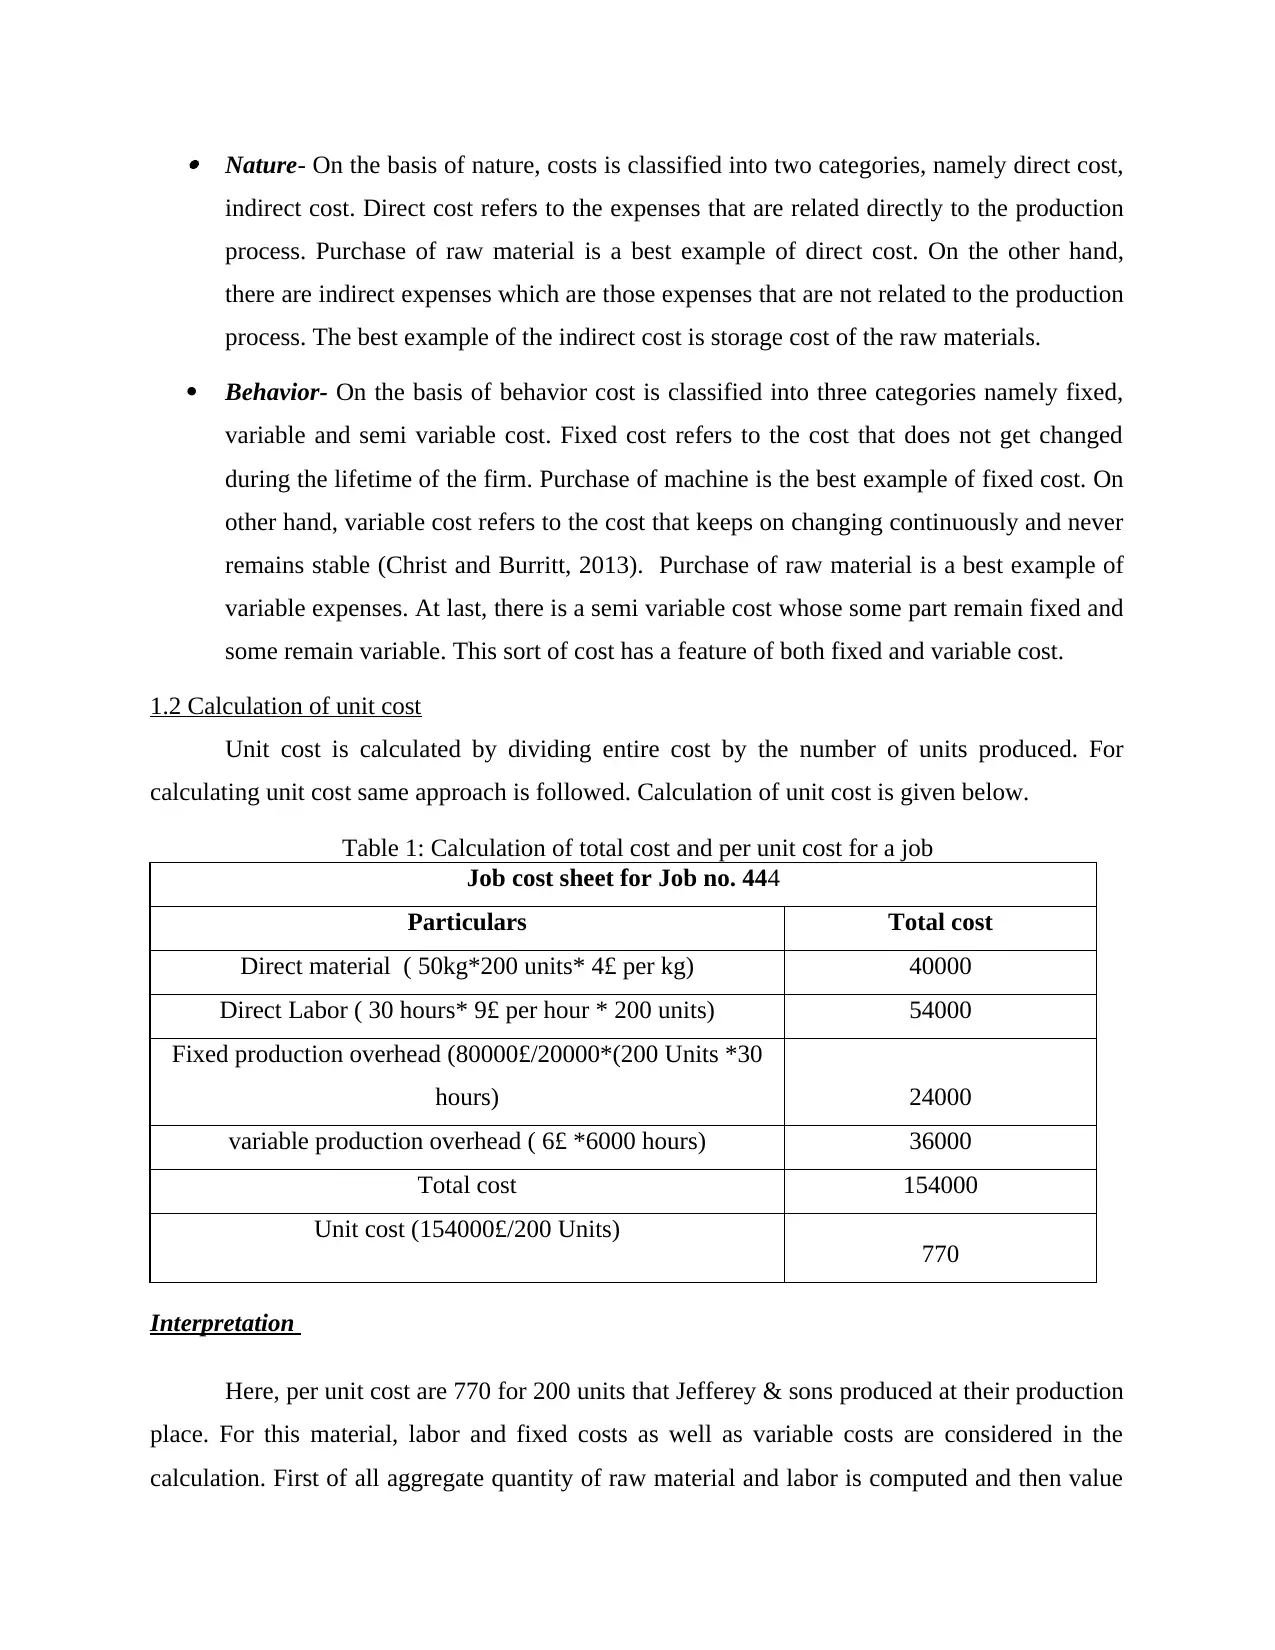
Nature- On the basis of nature, costs is classified into two categories, namely direct cost,
indirect cost. Direct cost refers to the expenses that are related directly to the production
process. Purchase of raw material is a best example of direct cost. On the other hand,
there are indirect expenses which are those expenses that are not related to the production
process. The best example of the indirect cost is storage cost of the raw materials.
Behavior- On the basis of behavior cost is classified into three categories namely fixed,
variable and semi variable cost. Fixed cost refers to the cost that does not get changed
during the lifetime of the firm. Purchase of machine is the best example of fixed cost. On
other hand, variable cost refers to the cost that keeps on changing continuously and never
remains stable (Christ and Burritt, 2013). Purchase of raw material is a best example of
variable expenses. At last, there is a semi variable cost whose some part remain fixed and
some remain variable. This sort of cost has a feature of both fixed and variable cost.
1.2 Calculation of unit cost
Unit cost is calculated by dividing entire cost by the number of units produced. For
calculating unit cost same approach is followed. Calculation of unit cost is given below.
Table 1: Calculation of total cost and per unit cost for a job
Job cost sheet for Job no. 444
Particulars Total cost
Direct material ( 50kg*200 units* 4£ per kg) 40000
Direct Labor ( 30 hours* 9£ per hour * 200 units) 54000
Fixed production overhead (80000£/20000*(200 Units *30
hours) 24000
variable production overhead ( 6£ *6000 hours) 36000
Total cost 154000
Unit cost (154000£/200 Units) 770
Interpretation
Here, per unit cost are 770 for 200 units that Jefferey & sons produced at their production
place. For this material, labor and fixed costs as well as variable costs are considered in the
calculation. First of all aggregate quantity of raw material and labor is computed and then value
Paraphrase This Document
Need a fresh take? Get an instant paraphrase of this document with our AI Paraphraser
is multiplied by the per unit cost of the material and labor. In this way cost of material and labor
is computed for final calculation. By doing calculation for fixed and variable expenses unit cost
is calculated for Jefferey & sons products.
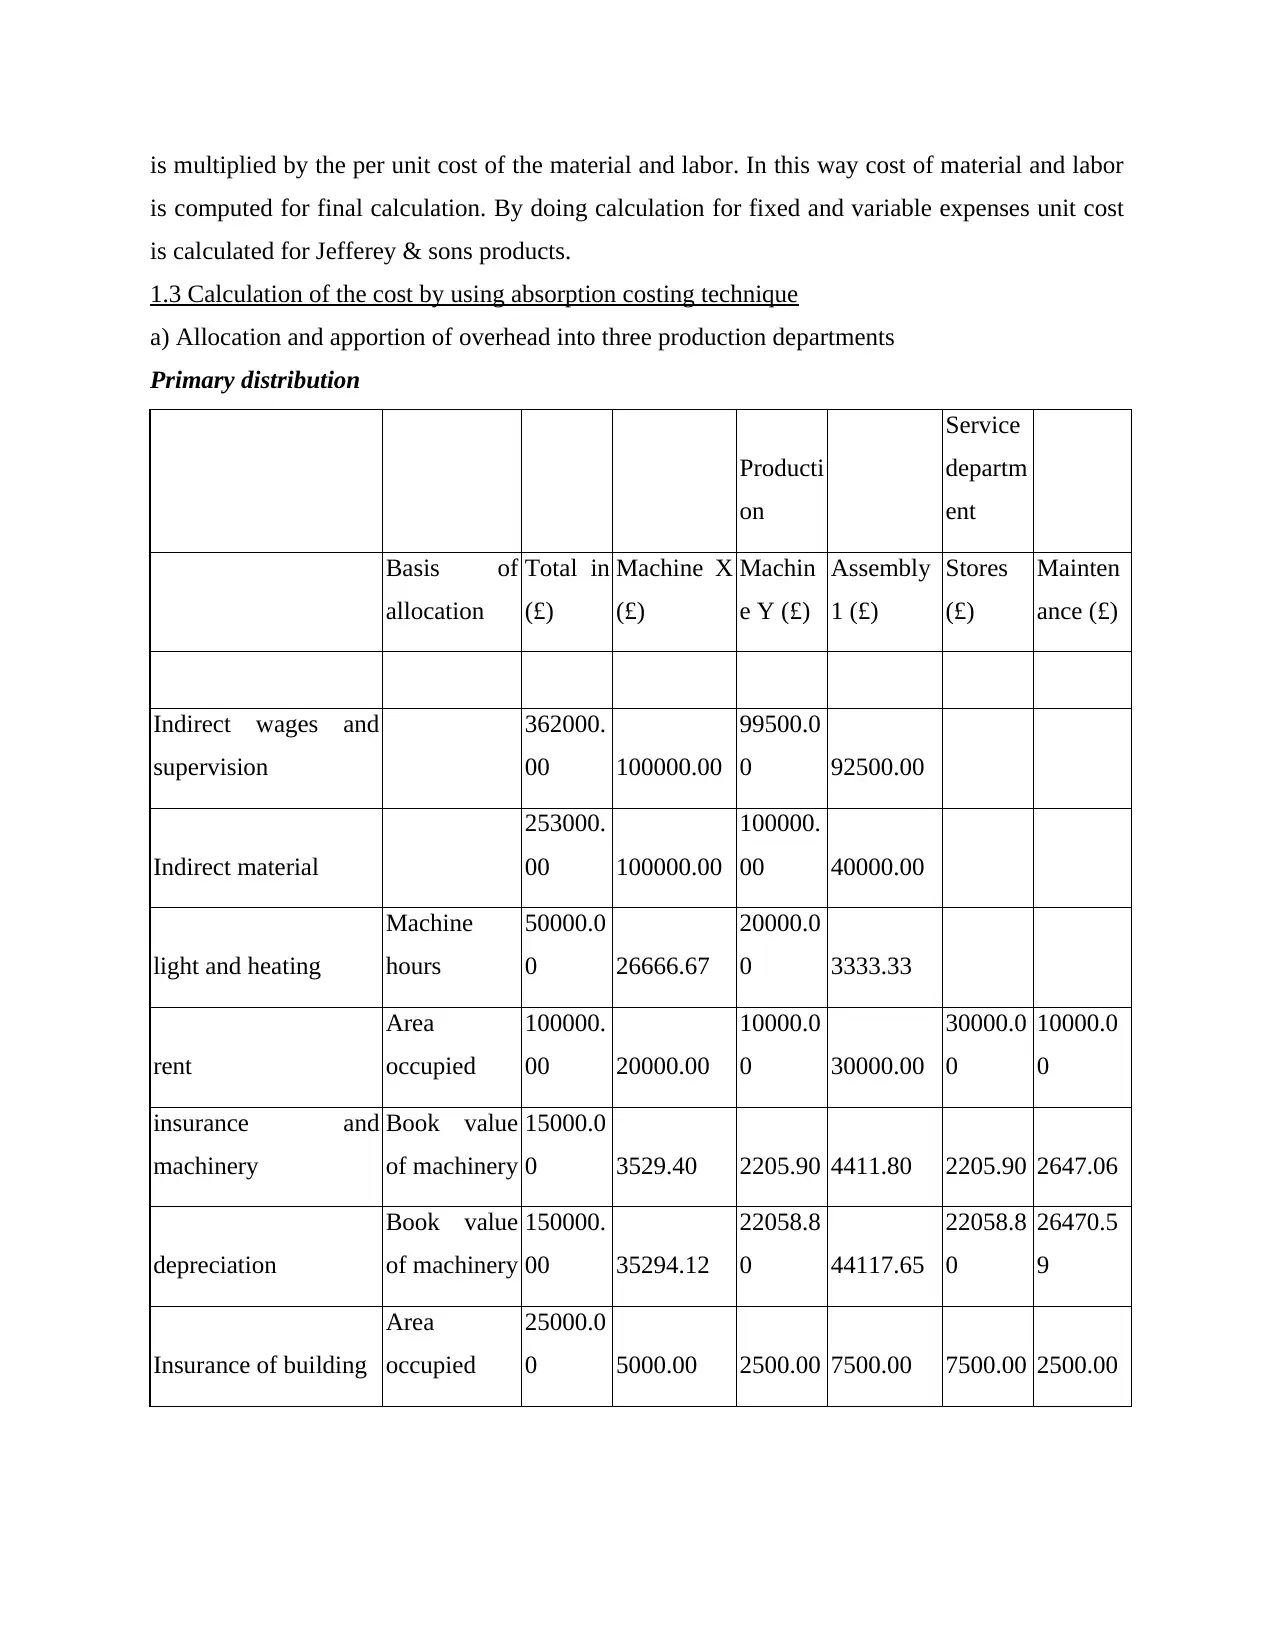
1.3 Calculation of the cost by using absorption costing technique
a) Allocation and apportion of overhead into three production departments
Primary distribution
Producti
on
Service
departm
ent
Basis of
allocation
Total in
(£)
Machine X
(£)
Machin
e Y (£)
Assembly
1 (£)
Stores
(£)
Mainten
ance (£)
Indirect wages and
supervision
362000.
00 100000.00
99500.0
0 92500.00
Indirect material
253000.
00 100000.00
100000.
00 40000.00
light and heating
Machine
hours
50000.0
0 26666.67
20000.0
0 3333.33
rent
Area
occupied
100000.
00 20000.00
10000.0
0 30000.00
30000.0
0
10000.0
0
insurance and
machinery
Book value
of machinery
15000.0
0 3529.40 2205.90 4411.80 2205.90 2647.06
depreciation
Book value
of machinery
150000.
00 35294.12
22058.8
0 44117.65
22058.8
0
26470.5
9
Insurance of building
Area
occupied
25000.0
0 5000.00 2500.00 7500.00 7500.00 2500.00
is computed for final calculation. By doing calculation for fixed and variable expenses unit cost
is calculated for Jefferey & sons products.
1.3 Calculation of the cost by using absorption costing technique
a) Allocation and apportion of overhead into three production departments
Primary distribution
Producti
on
Service
departm
ent
Basis of
allocation
Total in
(£)
Machine X
(£)
Machin
e Y (£)
Assembly
1 (£)
Stores
(£)
Mainten
ance (£)
Indirect wages and
supervision
362000.
00 100000.00
99500.0
0 92500.00
Indirect material
253000.
00 100000.00
100000.
00 40000.00
light and heating
Machine
hours
50000.0
0 26666.67
20000.0
0 3333.33
rent
Area
occupied
100000.
00 20000.00
10000.0
0 30000.00
30000.0
0
10000.0
0
insurance and
machinery
Book value
of machinery
15000.0
0 3529.40 2205.90 4411.80 2205.90 2647.06
depreciation
Book value
of machinery
150000.
00 35294.12
22058.8
0 44117.65
22058.8
0
26470.5
9
Insurance of building
Area
occupied
25000.0
0 5000.00 2500.00 7500.00 7500.00 2500.00
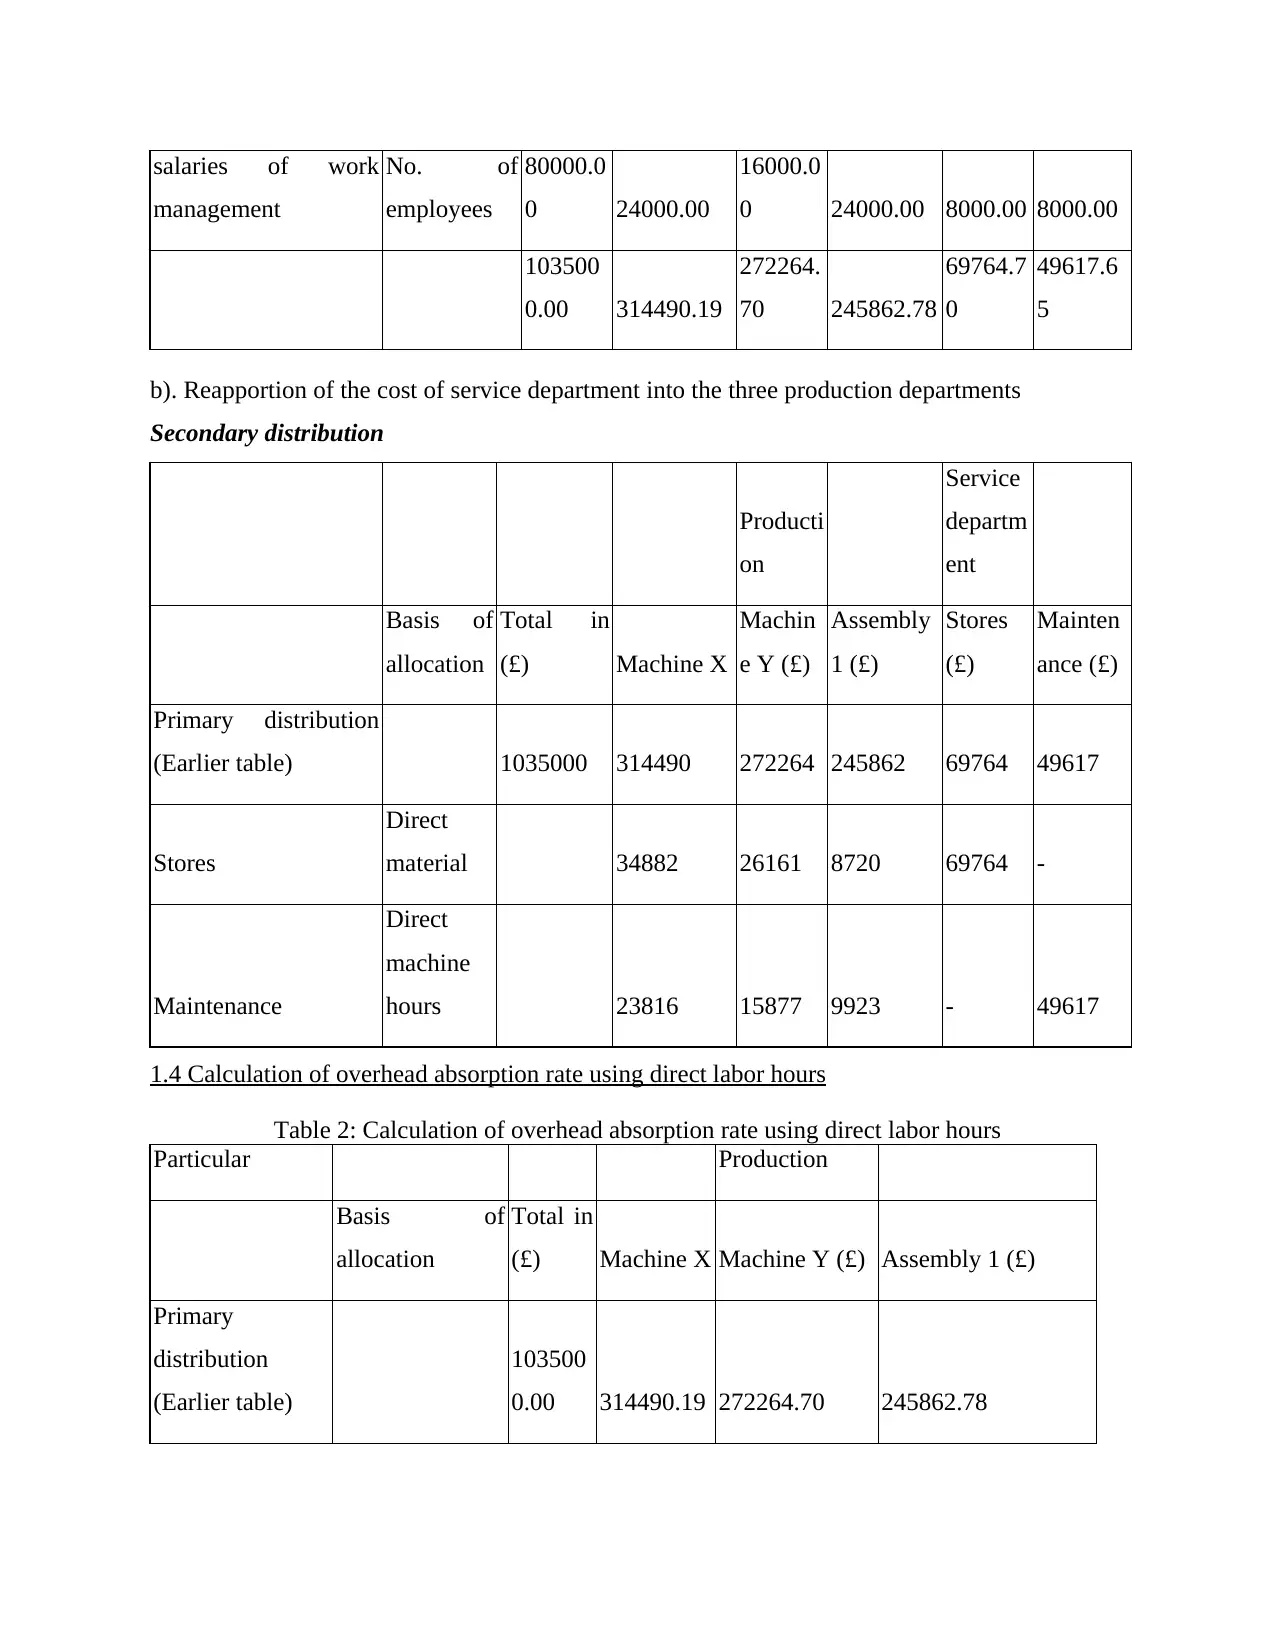
salaries of work
management
No. of
employees
80000.0
0 24000.00
16000.0
0 24000.00 8000.00 8000.00
103500
0.00 314490.19
272264.
70 245862.78
69764.7
0
49617.6
5
b). Reapportion of the cost of service department into the three production departments
Secondary distribution
Producti
on
Service
departm
ent
Basis of
allocation
Total in
(£) Machine X
Machin
e Y (£)
Assembly
1 (£)
Stores
(£)
Mainten
ance (£)
Primary distribution
(Earlier table) 1035000 314490 272264 245862 69764 49617
Stores
Direct
material 34882 26161 8720 69764 -
Maintenance
Direct
machine
hours 23816 15877 9923 - 49617
1.4 Calculation of overhead absorption rate using direct labor hours
Table 2: Calculation of overhead absorption rate using direct labor hours
Particular Production
Basis of
allocation
Total in
(£) Machine X Machine Y (£) Assembly 1 (£)
Primary
distribution
(Earlier table)
103500
0.00 314490.19 272264.70 245862.78
⊘ This is a preview!⊘
Do you want full access?
Subscribe today to unlock all pages.
Trusted by 1+ million students worldwide
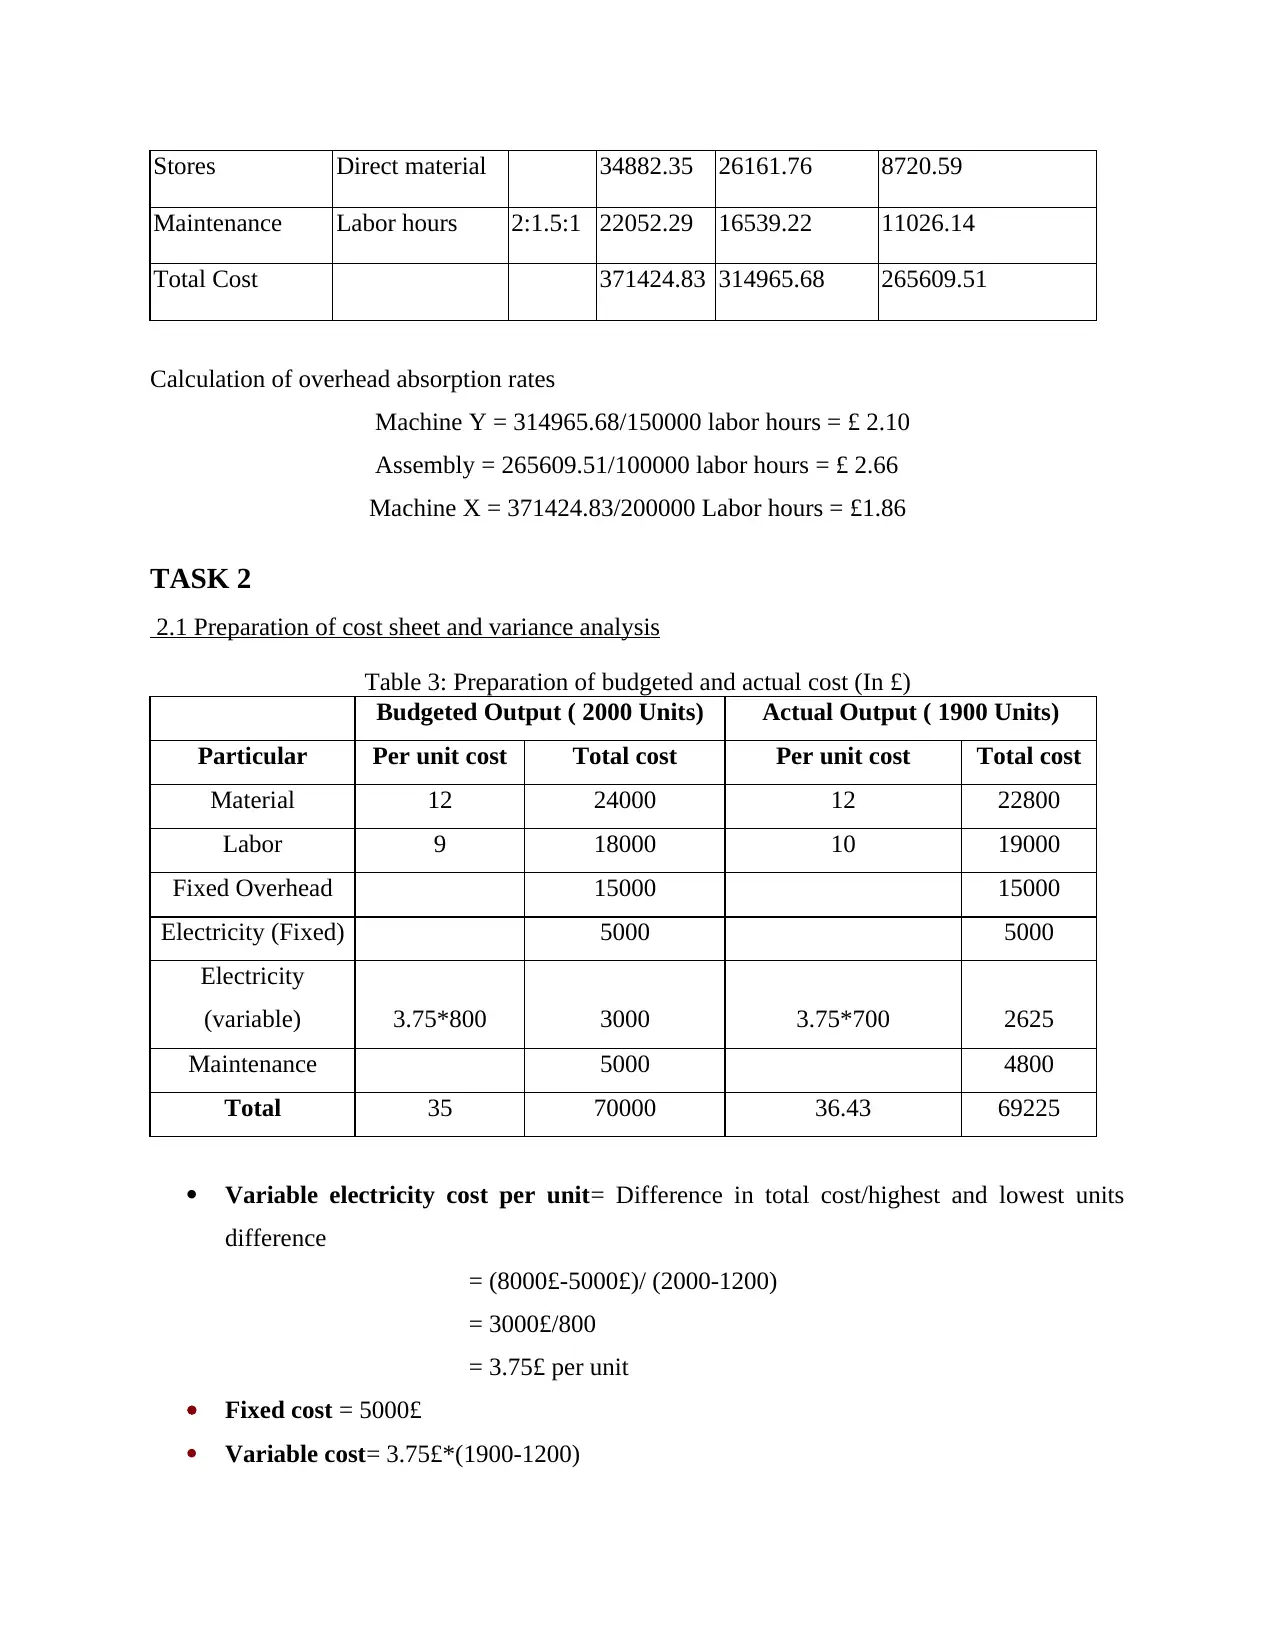
Stores Direct material 34882.35 26161.76 8720.59
Maintenance Labor hours 2:1.5:1 22052.29 16539.22 11026.14
Total Cost 371424.83 314965.68 265609.51
Calculation of overhead absorption rates
Machine Y = 314965.68/150000 labor hours = £ 2.10
Assembly = 265609.51/100000 labor hours = £ 2.66
Machine X = 371424.83/200000 Labor hours = £1.86
TASK 2
2.1 Preparation of cost sheet and variance analysis
Table 3: Preparation of budgeted and actual cost (In £)
Budgeted Output ( 2000 Units) Actual Output ( 1900 Units)
Particular Per unit cost Total cost Per unit cost Total cost
Material 12 24000 12 22800
Labor 9 18000 10 19000
Fixed Overhead 15000 15000
Electricity (Fixed) 5000 5000
Electricity
(variable) 3.75*800 3000 3.75*700 2625
Maintenance 5000 4800
Total 35 70000 36.43 69225
Variable electricity cost per unit= Difference in total cost/highest and lowest units
difference
= (8000£-5000£)/ (2000-1200)
= 3000£/800
= 3.75£ per unit
Fixed cost = 5000£
Variable cost= 3.75£*(1900-1200)
Paraphrase This Document
Need a fresh take? Get an instant paraphrase of this document with our AI Paraphraser
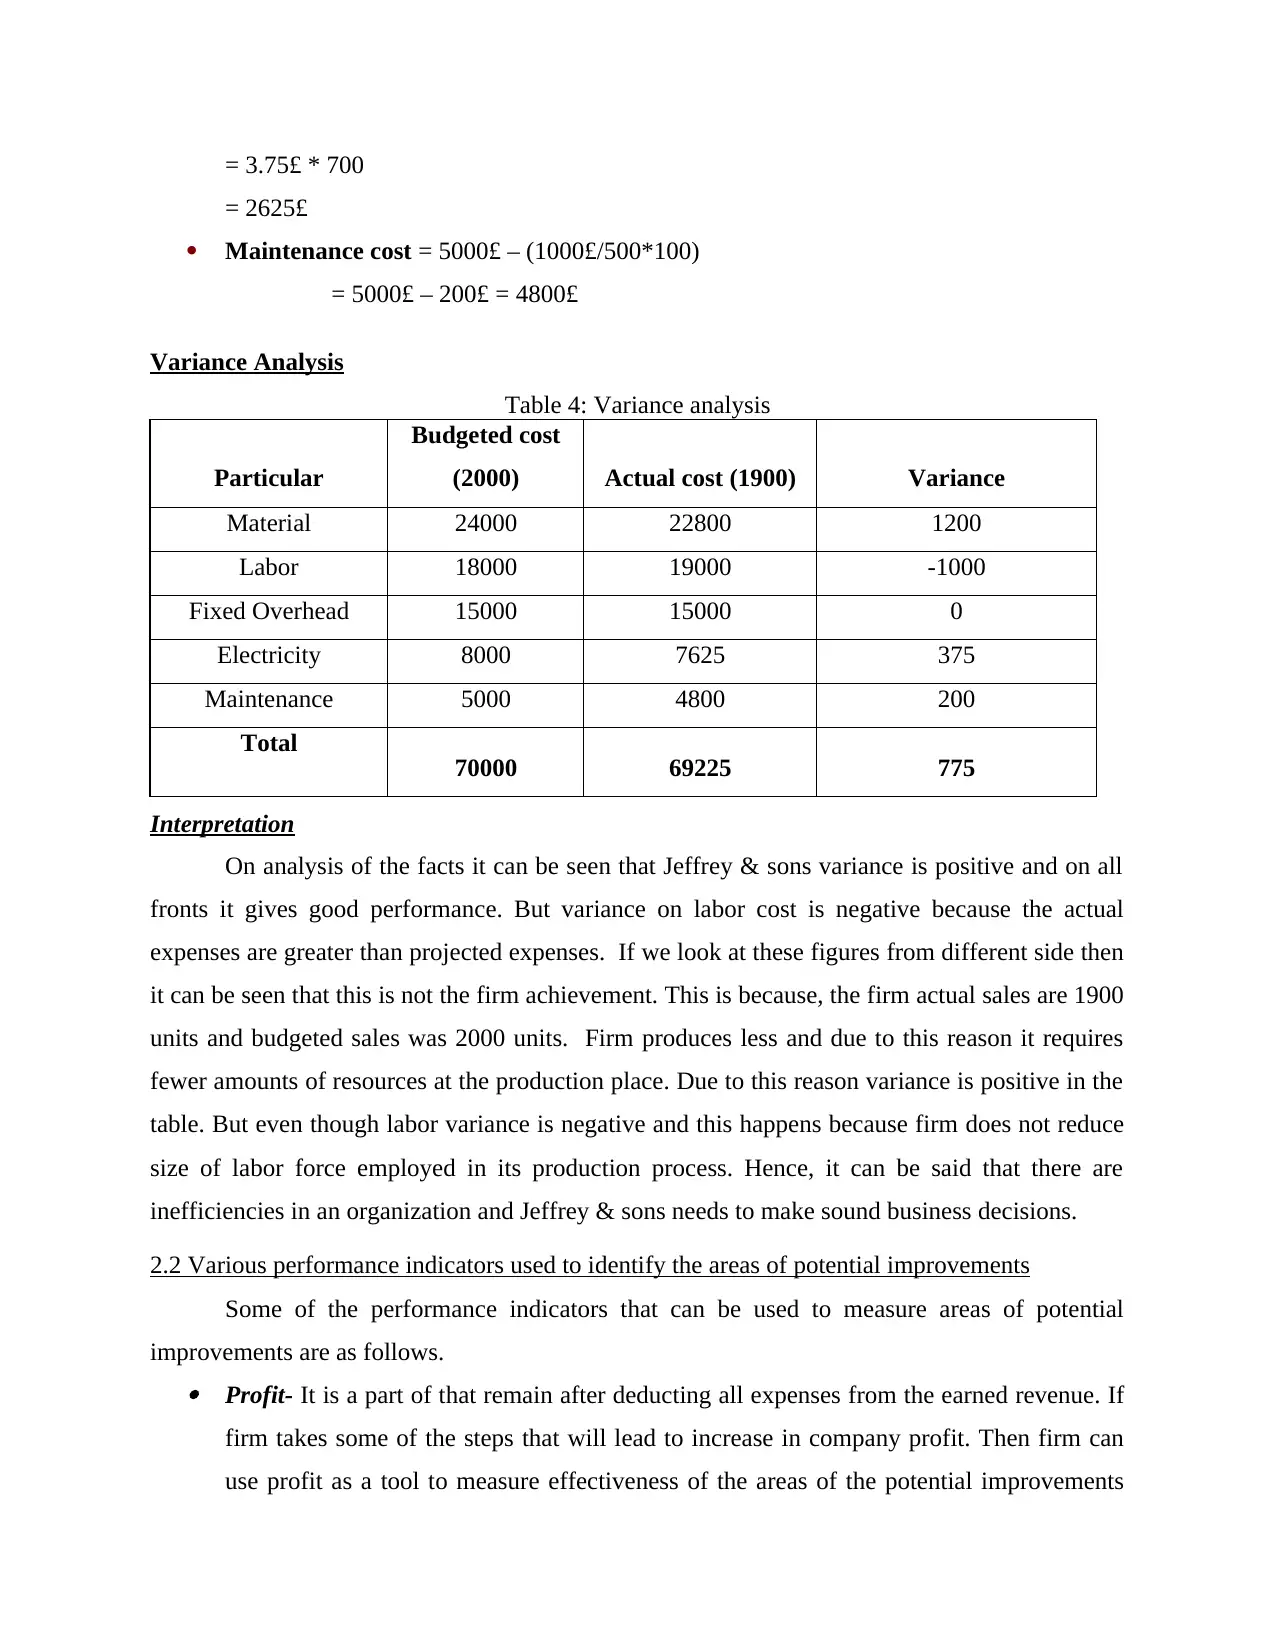
= 3.75£ * 700
= 2625£
Maintenance cost = 5000£ – (1000£/500*100)
= 5000£ – 200£ = 4800£
Variance Analysis
Table 4: Variance analysis
Particular
Budgeted cost
(2000) Actual cost (1900) Variance
Material 24000 22800 1200
Labor 18000 19000 -1000
Fixed Overhead 15000 15000 0
Electricity 8000 7625 375
Maintenance 5000 4800 200
Total 70000 69225 775
Interpretation
On analysis of the facts it can be seen that Jeffrey & sons variance is positive and on all
fronts it gives good performance. But variance on labor cost is negative because the actual
expenses are greater than projected expenses. If we look at these figures from different side then
it can be seen that this is not the firm achievement. This is because, the firm actual sales are 1900
units and budgeted sales was 2000 units. Firm produces less and due to this reason it requires
fewer amounts of resources at the production place. Due to this reason variance is positive in the
table. But even though labor variance is negative and this happens because firm does not reduce
size of labor force employed in its production process. Hence, it can be said that there are
inefficiencies in an organization and Jeffrey & sons needs to make sound business decisions.
2.2 Various performance indicators used to identify the areas of potential improvements
Some of the performance indicators that can be used to measure areas of potential
improvements are as follows. Profit- It is a part of that remain after deducting all expenses from the earned revenue. If
firm takes some of the steps that will lead to increase in company profit. Then firm can
use profit as a tool to measure effectiveness of the areas of the potential improvements
that were made to increase company profit. This is a parameter that is commonly used by
the firm to identify and measure effectiveness of the area of potential improvements
(Shah, Malik and Malik, 2011). Many times firm sales fall continuously and in such a
situation by identifying various factors that contributes to profit earning firm identify
areas of potential improvements. In such a situation companies by formulating a strategy
improve their performance in the areas where potential improvements were required. Turnover- It refers to the sales that a firm made at the end of the specific period. It is also
used to identify areas of potential improvements. Many times firm makes an efforts but
even though its sales does not grow at a fast pace. In such a situation all things that
contribute to sale are identified and firm prepare a tactics in order to give good
performance on the factors where it is weak (Morales and Lambert, 2013). In this way
areas of potential improvements are identified and firm performance is improved.
Customer satisfaction- This is another area of potential improvement which do not need
to be identified (Contrafatto and Burns, 2013). This is because it is an area where every
company needs to do lots of work in order to develop loyal customer base in order to
compete with competitors.
2.3 Ways to reduce cost, enhance value and quality
There are many ways to reduce cost and enhancement of value. In order to reduce cost
firm needs to generate economies of scale. It is a concept which is focusing on reduction of cost.
Under this some of the steps are taken that lead to cost reduction. This ultimately led to decline
in the cost of production (Papaspyropoulos and et.al, 2012). Hence, in this regard firm can
reduce its transportation cost. By using transportation problems technique Jefferey and sons can
identify shortest for transportation of the product. This will lead to reduction in the firm cost of
production. In order to enhance value and quality Jefferey and sons can undertake research and
development activity (Cadez and Guilding, 2012). By doing so, firm can bring many new
changes in the product and make it innovative in nature. This will also act as USP for the
company product.
TASK 3
3.1 Nature and purpose of budgeting process
Process for preparing a budget is as follows.
⊘ This is a preview!⊘
Do you want full access?
Subscribe today to unlock all pages.
Trusted by 1+ million students worldwide
Gather information- This is the first stage of the budget process and under this process
information that is required for preparing a budget is collected. This information may be
related to the several departments like production finance and HR etc (Coyne and et. al.,
2010). Relevant data is collected by the managers from his subordinates. After that he
proceeds for the next steps. Recording all sources of income- In this of the budget preparation process all sources of
income is recorded. These sources may be sales, lease and investment that are made in
the financial products. In this stage managers evaluate current economic environment and
predict future scenario related to the same component of the business environment
(Viere, Schaltegger and von Enden, 2012). On the basis of this evaluation projections of
the income are made by the managers. Creating a list of monthly income- Projection made in above step is on annual basis and
in order to estimate the monthly income entire projected earning is divided by the 12
months (van der Meer-Kooistra and Vosselman, 2012). By doing so managers came to
know about the per month income hat business can generate in the future. Estimating expenses-In the fourth stage of the budget preparation a list of expenses is
prepared. In order to prepare this list project expenses are demanded from the all
departments of an organization. After receiving all these departments’ projections same
are included in the list. In this list of expenses is prepared by the managers. Preparing a final budget- This is final stage of budget preparation and under this all
estimated figures of income and expenses is arranged in a systematic manner. First of all
income is recorded and then expenses are placed in the table (Faÿ, Introna and Puyou,
2010). After that expenses are deducted from income and balance is transferred to the
next time period. In this way, final budget is prepared by the manager.
Purpose of preparing a budget
The main purpose of preparing a budget is to control cost and motivate employees to
achieve an objective. In the budget figure is determined for all expenses and main target of
Jeffrey and sons is to keep expenses below determined value. By doing this cost of production is
reduced for the product (Askarany, Yazdifar and Askary, 2010). On other hand, budget is also
used to motivate employees to work hard. These figures acts as a target for the employees and
Paraphrase This Document
Need a fresh take? Get an instant paraphrase of this document with our AI Paraphraser
due to this reason budget motivate employees to work hard. Hence, it can be said that budget has
a multi dimensional benefits for the firm.
3.2 Appropriate budgeting method for the organization and its need
The budgeting methods that Jeffrey and sons can used are as follows. Incremental budgeting- Under this type of budgeting an increment is made to the past
budget. In this past budget is considered by the managers. Firm determined a growth rate
and that rate are added to the past data in order to compute new budget. This type of
budgeting is widely used by the mangers because with passage of time business grows
and expenses also grow (Victoravich, 2010). Due to this reason incremental budget is
very popular among the business firms. In order determine growth rate many economic
data are considered. These economic data are GDP data and inflation rate data. A
business cannot run at a rate greater then nation GDP. Hence, by using GDP growth rate
projections can be made. On the other hand, by using inflation rate future expenses can
be estimated by the managers. Hence, by making use of these data budgets can be
prepared in the proper manner. Zero based budgeting- In this budgeting technique inputs are taken from the
departments. Until departments will not send projected expense statement to the top
management no amount will be allocated to the specific department. These departments
also need to justify their assumptions in order to get budget from the top management.
Hence, it can be said that in this budget cautious approach is followed and accurate
budget is prepared (Libby and Lindsay, 2010). Due to this reason this approach of budget
preparation is widely used by the business managers.
Top down budgeting- In this type of budgeting two level of management work on the
budget and these levels are top and middle level of the management. In case of this kind
of budget top management prepare a budget and communicate same to the middle level
of the management (Quinn, 2014). Then middle level managers allocate budget amount
among all departments and these allocations are communicated to the middle level of the
top level of management for approval. After approval from the management the budget
amount is allocated among the all departments.
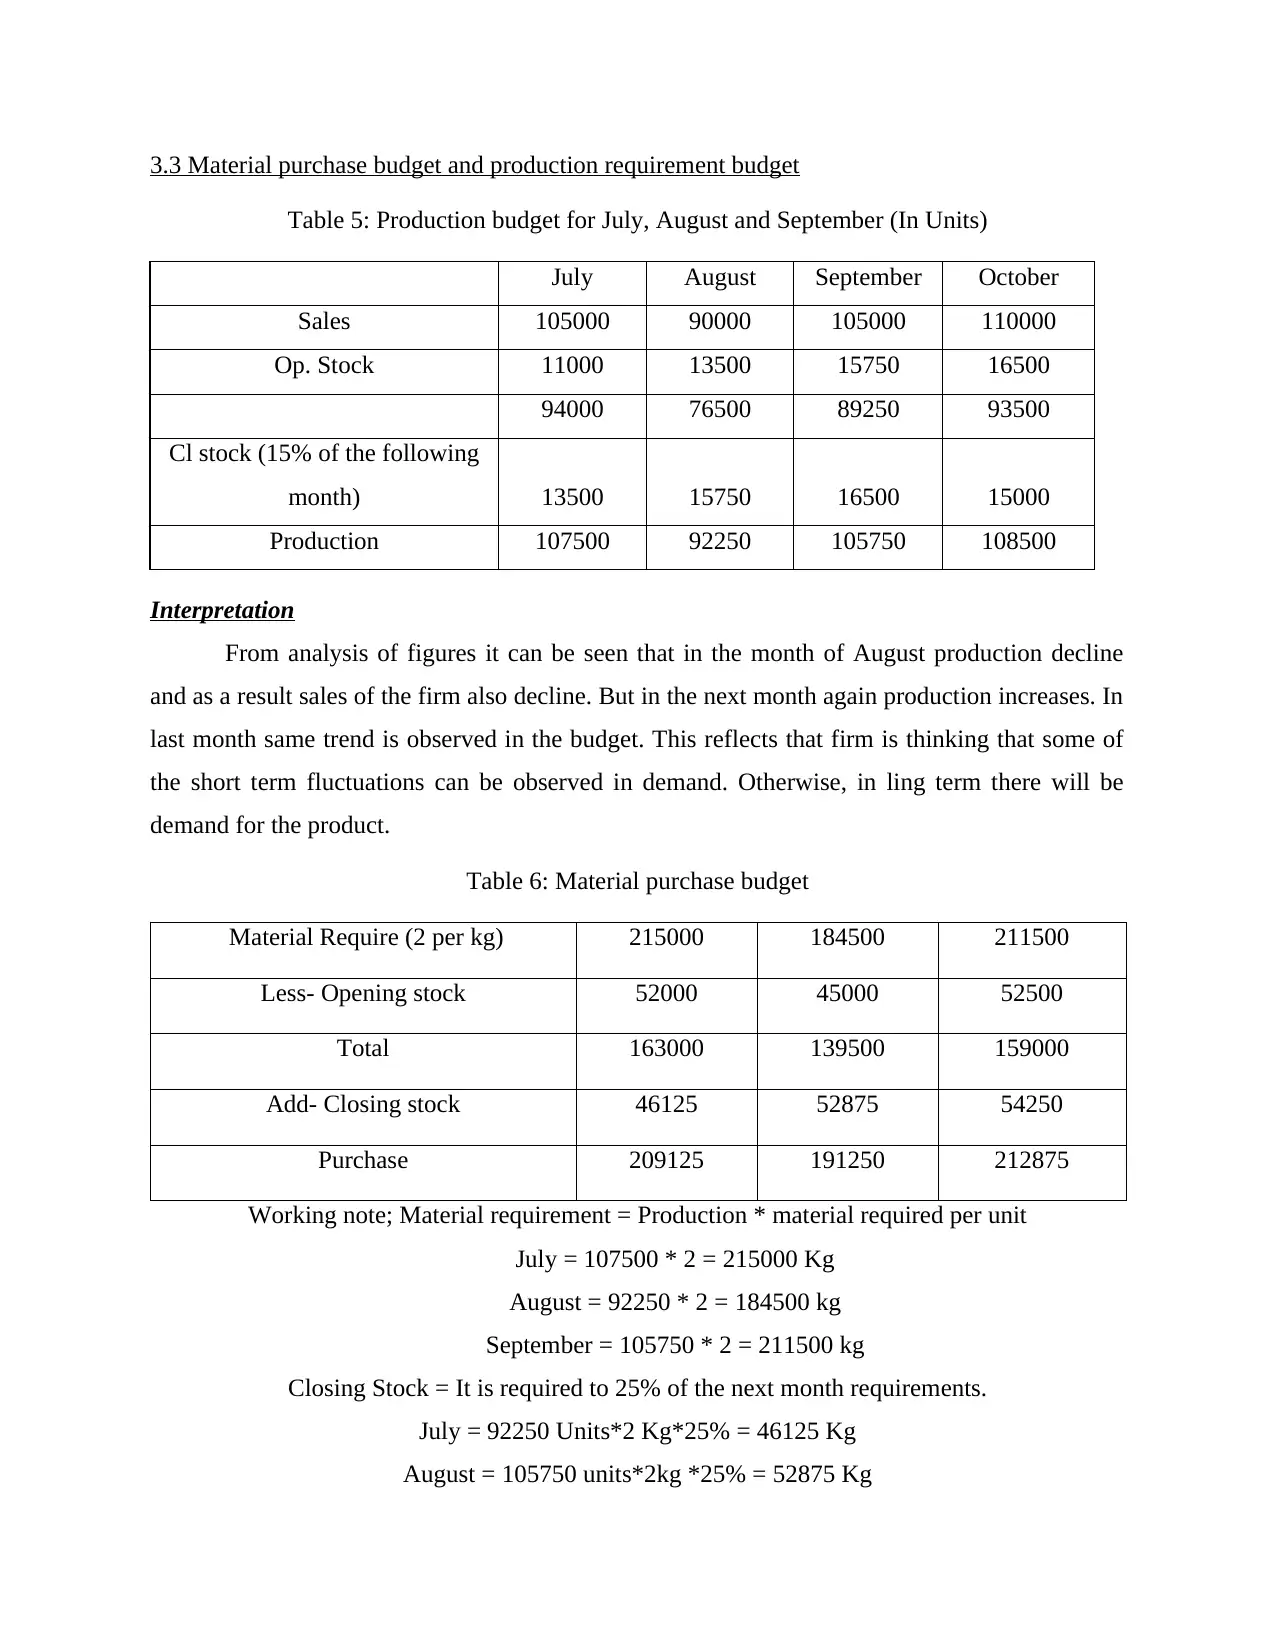
3.3 Material purchase budget and production requirement budget
Table 5: Production budget for July, August and September (In Units)
July August September October
Sales 105000 90000 105000 110000
Op. Stock 11000 13500 15750 16500
94000 76500 89250 93500
Cl stock (15% of the following
month) 13500 15750 16500 15000
Production 107500 92250 105750 108500
Interpretation
From analysis of figures it can be seen that in the month of August production decline
and as a result sales of the firm also decline. But in the next month again production increases. In
last month same trend is observed in the budget. This reflects that firm is thinking that some of
the short term fluctuations can be observed in demand. Otherwise, in ling term there will be
demand for the product.
Table 6: Material purchase budget
Material Require (2 per kg) 215000 184500 211500
Less- Opening stock 52000 45000 52500
Total 163000 139500 159000
Add- Closing stock 46125 52875 54250
Purchase 209125 191250 212875
Working note; Material requirement = Production * material required per unit
July = 107500 * 2 = 215000 Kg
August = 92250 * 2 = 184500 kg
September = 105750 * 2 = 211500 kg
Closing Stock = It is required to 25% of the next month requirements.
July = 92250 Units*2 Kg*25% = 46125 Kg
August = 105750 units*2kg *25% = 52875 Kg
⊘ This is a preview!⊘
Do you want full access?
Subscribe today to unlock all pages.
Trusted by 1+ million students worldwide
1 out of 18
Related Documents


Your All-in-One AI-Powered Toolkit for Academic Success.
+13062052269
info@desklib.com
Available 24*7 on WhatsApp / Email
![[object Object]](/_next/static/media/star-bottom.7253800d.svg)
Unlock your academic potential
Copyright © 2020–2026 A2Z Services. All Rights Reserved. Developed and managed by ZUCOL.