Management Accounting Report: Assessment 1 Analysis and Evaluation
VerifiedAdded on 2019/10/31
|18
|4083
|495
Report
AI Summary
This report provides a comprehensive analysis of management accounting principles. It begins with an examination of key concepts such as the role of reliable accounting information systems, data coding, and manufacturing overhead. The report then delves into business performance analysis, exploring tools like variance analysis and key performance indicators, and also covers the analysis of leverage ratios and budget implementation. The report further investigates the importance of variance analysis in identifying and addressing discrepancies between planned and actual figures. The report also includes an assessment of manufacturing costs, differentiating between prime, direct, and indirect costs. The analysis extends to cost sheets, providing an understanding of cost variances related to furniture manufacturing. Overall, the report aims to provide a deep understanding of management accounting practices and their application in business operations.
Management Accounting
Paraphrase This Document
Need a fresh take? Get an instant paraphrase of this document with our AI Paraphraser
Table of Contents
Assessment 1 (A).......................................................................................................................4
Question 1..............................................................................................................................4
Question 2..............................................................................................................................4
Question 3..............................................................................................................................5
Question 4..............................................................................................................................5
Question 5..............................................................................................................................6
Question 7..............................................................................................................................7
Question 8..............................................................................................................................7
Assessment 1 (B)........................................................................................................................8
Task 1 – Cost of Manufacture Analysis.................................................................................8
Task 2- Production cost worksheet..........................................................................................10
Part A...................................................................................................................................10
Part B....................................................................................................................................11
Part C....................................................................................................................................11
Part D...................................................................................................................................12
Part E....................................................................................................................................13
Part F....................................................................................................................................13
Part G...................................................................................................................................14
Part H...................................................................................................................................14
Part I.....................................................................................................................................15
References................................................................................................................................16

TABLE OF FIGURES
Figure 1: Total Product Curve..................................................................................................12
Figure 2: Total Cost Curve.......................................................................................................14
Figure 3: Graph representing marginal curve..........................................................................15
⊘ This is a preview!⊘
Do you want full access?
Subscribe today to unlock all pages.
Trusted by 1+ million students worldwide
ASSESSMENT 1 (A)
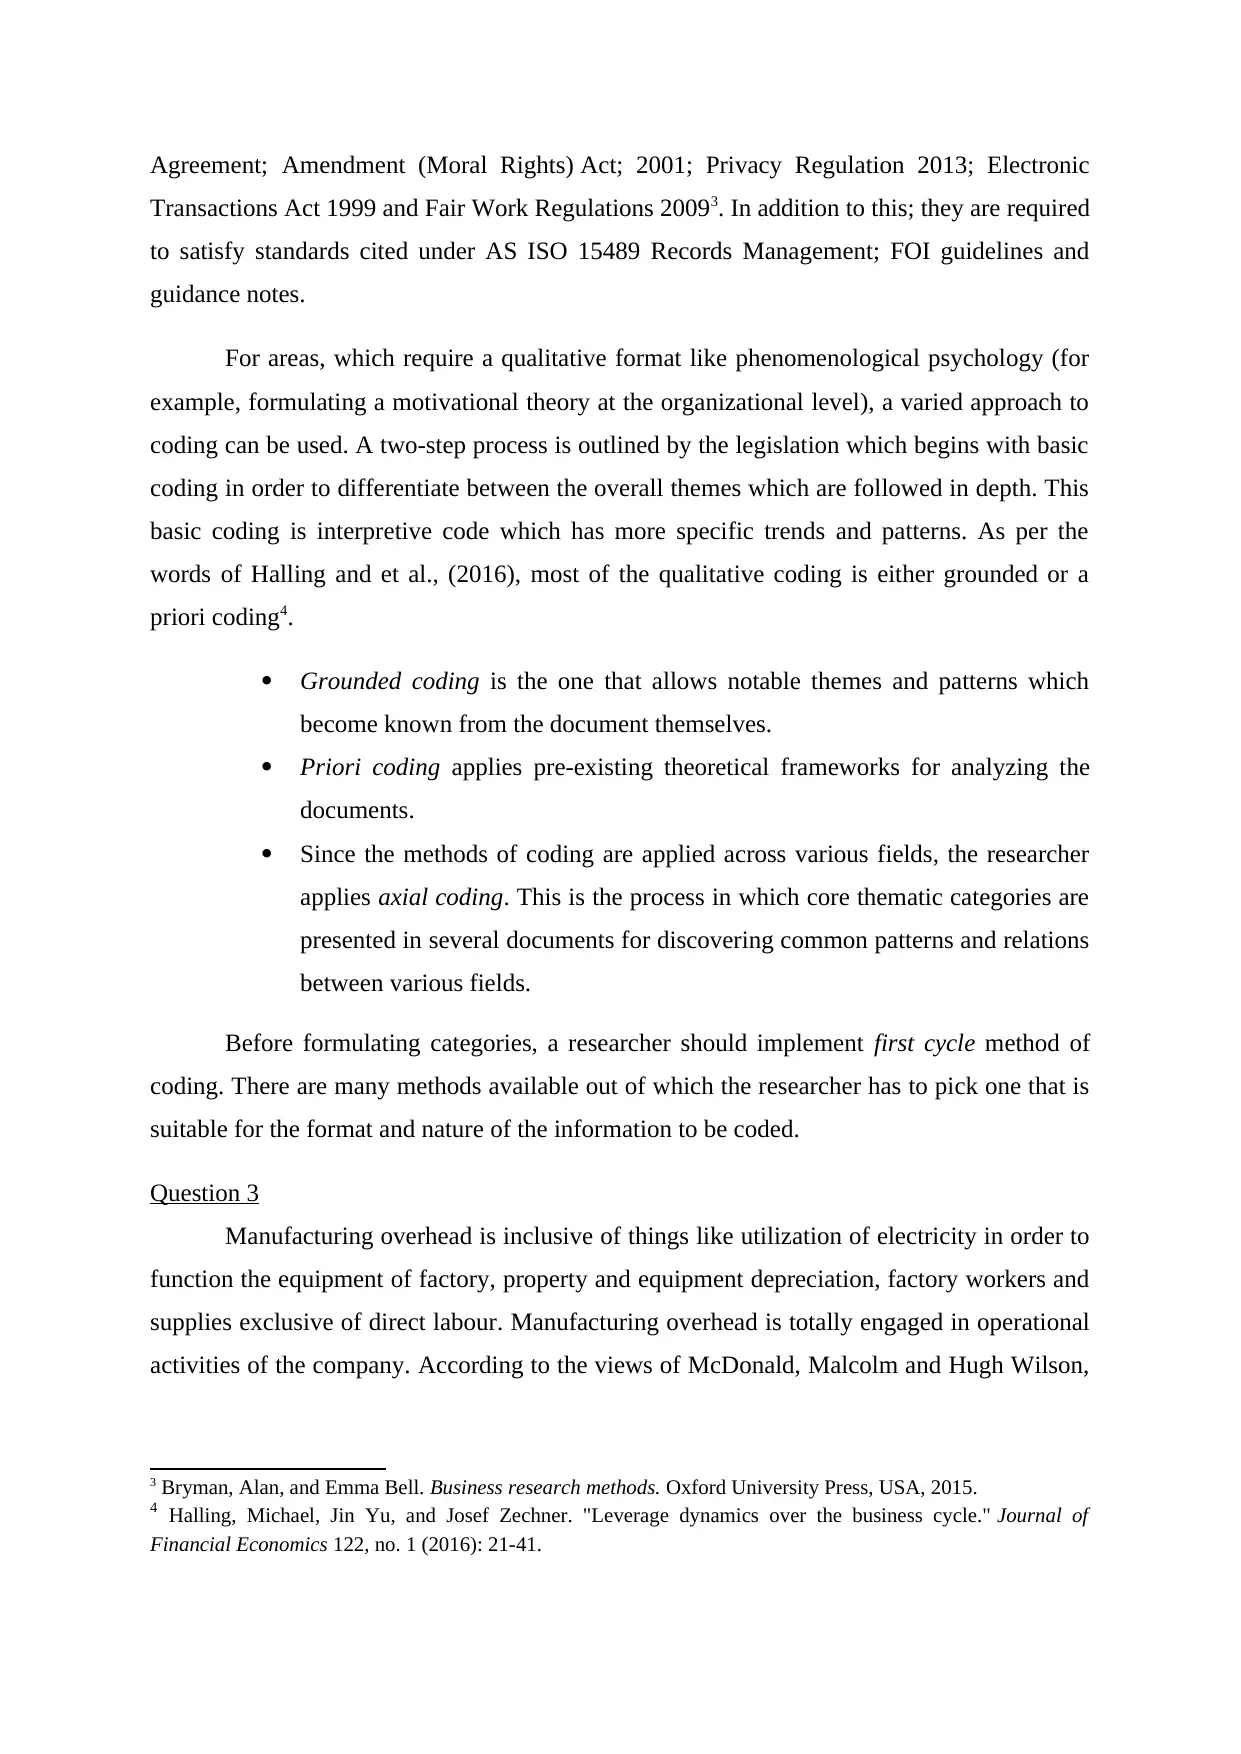
Question 1
According to Haynes and et al. (2014), reliable accounting information systems
generate and record costing information reliably by considering viability and accuracy of
data1. The computerized system will be able to generate accounting documents such as bills,
memo and invoices. It will also record transactions of daily costing and business transactions
via computer software. The further computerized system will assist costing information by
preparing financial statements and trial balance in order to check authenticity and accuracy.
Computerized system comprises a primary stage that is the Transaction processing system,
which records and store transactions held in different operational areas of business. TPS
engages these following steps in addressing a transaction; data validation and entry, recording
and storage, processing and re-validation, data and reporting. If the system is able to generate
and record cited data, then it will be cost-effective and assist in smooth management, while
ensuring speed, security and easy access to data.
Question 2
The legislative and organizational requirement prescribe that a single code should
apply to an only individual category of data coding and all the categories should be wide-
ranging. As per Drury and Colin (2013), there are clear rules for coders which are to be
followed so that the process of coding is consistent in all fields related to particular data2. For
the purpose of quantitative analysis, data coding is usually done into a variable that is capable
of being measured as nominal or ordinal. Quantitative analysis-data is-
Pre-coded that is specific codes are assigned to expected answers,
field-coded (codes are available during fieldwork),
Post-coded (coding are available when the coding is complete )
Office-coded (done after fieldwork).
According to words of Bryman, Alan and Emma Bell, (2015), in this aspect business are
required to comply with the legislation such as AMX Software and Program Code License
1 Haynes, Ian Frederick, Bradley Jason Schultz, Stephen Conway Larkin, and Sean David Rogers.
"Computerized information collection and training method and apparatus." U.S. Patent 8,633,985, issued
January 21, 2014.
2 DRURY, COLIN M. Management and cost accounting. Springer, 2013.
Paraphrase This Document
Need a fresh take? Get an instant paraphrase of this document with our AI Paraphraser
Agreement; Amendment (Moral Rights) Act; 2001; Privacy Regulation 2013; Electronic
Transactions Act 1999 and Fair Work Regulations 20093. In addition to this; they are required
to satisfy standards cited under AS ISO 15489 Records Management; FOI guidelines and
guidance notes.
For areas, which require a qualitative format like phenomenological psychology (for
example, formulating a motivational theory at the organizational level), a varied approach to
coding can be used. A two-step process is outlined by the legislation which begins with basic
coding in order to differentiate between the overall themes which are followed in depth. This
basic coding is interpretive code which has more specific trends and patterns. As per the
words of Halling and et al., (2016), most of the qualitative coding is either grounded or a
priori coding4.
Grounded coding is the one that allows notable themes and patterns which
become known from the document themselves.
Priori coding applies pre-existing theoretical frameworks for analyzing the
documents.
Since the methods of coding are applied across various fields, the researcher
applies axial coding. This is the process in which core thematic categories are
presented in several documents for discovering common patterns and relations
between various fields.
Before formulating categories, a researcher should implement first cycle method of
coding. There are many methods available out of which the researcher has to pick one that is
suitable for the format and nature of the information to be coded.
Question 3
Manufacturing overhead is inclusive of things like utilization of electricity in order to
function the equipment of factory, property and equipment depreciation, factory workers and
supplies exclusive of direct labour. Manufacturing overhead is totally engaged in operational
activities of the company. According to the views of McDonald, Malcolm and Hugh Wilson,
3 Bryman, Alan, and Emma Bell. Business research methods. Oxford University Press, USA, 2015.
4 Halling, Michael, Jin Yu, and Josef Zechner. "Leverage dynamics over the business cycle." Journal of
Financial Economics 122, no. 1 (2016): 21-41.
(2016), it involves the cost held in the factory other than the direct labour and material costs5.
For this reason, manufacturing overhead is considered as an indirect cost. Some examples for
manufacturing overhead are rent and depreciation on factory premises and equipment, factory
supervisors, a quality segment of factory, electricity, employees, gas and maintenance of the
factory etc.
Question 4
The aim of business performance analysis is to determine the opportunities for
development, interpreting their causes and further taking action. Opportunities can be spotted
in many ways, like in performance issues and business areas that conduct well and could be
controlled additionally. Businesses make use of various tools such as variance analysis; this
analysis makes a prediction of how an organization will conduct from a financial position. As
per the views of Tereanu and et al., (2014), the comparison of financial results is made in
order to forecast. Once the reasons are determined, business identifies if or if not the changes
in their own aspects within operations are needed to drive the company towards its forecasted
goals6. A key performance indicator is also a tool for analysing business performance; it
assists the organization to identify whether the parts are effectively working or not. It is
helpful in monitoring better market strategies in order to attain available opportunities.
Business performance analysis also involves customer satisfaction measurement, as this
aspect is considered considerable for any business; it is because happy customers are always
likely to engage with business in near future. One other tool is employee satisfaction;
business is required to determine whether the human resources are satisfied with their
salaries, compensation, working environment or opportunities in order to motivate and
encourage them.
Question 5
Organizations are based on the combination of owner’s equity and finance in their
operational activities. The leverage ratio is considered as one of the various measurements of
financial operations that keeps an eye upon how capital incurred in term of loan, debts or
considers the company’s capability to meet the financial requirements. A leverage ratio, in
essence, means to determine the debts levels of a company. Most general leverage ratios used
are a debt to equity and debt ratios. According to the opinion of Braun and et al., (2014), the
5 McDonald, Malcolm, and Hugh Wilson. Marketing Plans: How to prepare them, how to profit from them. John
Wiley & Sons, 2016.
6 Tereanu, Eugen, Anita Tuladhar, and Alejandro S. Simone. "Structural balance targeting and output gap
uncertainty." (2014).
⊘ This is a preview!⊘
Do you want full access?
Subscribe today to unlock all pages.
Trusted by 1+ million students worldwide
leverage ratio is a type of financial ratio that shows the debt level held by a business
enterprise in opposition to various other accounts cited in profit and loss statement, balance
sheet or cash flow statement7. It offers and keeps a record of incoming assets from loans to
finance business operations.
Question 6
Before implementing a budget, an organization must consider these questions. First is
the strategic plan, this will ensure that resources are used in such a manner that they promote
strategic development of the organization. Next step is to realise the goals of the
organization; goals are required to be developed and achieved. Organizations must implement
revenue projections, and it must be based on past financial performance plus the estimated
growth income of the business. The further organization has to consider fixed and variable
cost projections for controlling the budgeting and making it cost effective. As per the opinion
of Brei, Michael and Leonardo Gambacorta, (2014), evaluation of payroll expenses must be
done on a timely basis prior to making a budget. Target profit margin must be conducted in
any organization, as they allow for returns on investment8. Next is the budget approved by
the CEO, president or the owner of the organization in order to examine the budget
performance and for controlling the all the expenses. The organization must nest step on to
review the budget for monitoring the performance in opposition to the goals. This step must
be performed by the committee on a timely basis so that corrections can be done if there are
any. The last step is to address with the budget variances, and it must be reviewed by a
responsible manager, and queries must be raised as to know why the variance took place.
Hence, a good process of budgeting can improve and progress organizational activities while
ensuring long-term growth and financial health.
Question 7
Variance analysis is a method of analyzing and determining the variation between two
figures. It can also be defined as an accounting or numerical tool that assists in identifying the
root cause of variance in the operational and functional activities of business. In accountancy,
use of variation analysis is done to consider the productivity of the project. It also assists in
analyzing the difference between total and proposed costs of the project. Variance analysis
7 Braun, Karen Wilken, Wendy M. Tietz, Walter T. Harrison, Linda Smith Bamber, and Charles T.
Horngren. Managerial accounting. Pearson, 2014.
8 Brei, Michael, and Leonardo Gambacorta. "The leverage ratio over the cycle." (2014).
Paraphrase This Document
Need a fresh take? Get an instant paraphrase of this document with our AI Paraphraser
assists the managers to manage and control those differences. In accordance to Roberts,
Maxwell and Riccardo Russo, (2014), project managers are required to perform variance
analysis at each target of the business project in order to evaluate the financial data. Along
with this, it also spots actual differences between actual against proposed costs9. By following
this path, managers will be able to measure the quantitative data as regards with the expenses,
income and stock level regarding the project that will consequently assist managing and
achieve the business goals.
Question 8
Variance analysis is an investigation based on a quantitative analysis which indicates
the difference of actual with planned behaviour. Variance analysis is used to manage and
maintain control of the business management. For instance, is a company makes a budget for
sales of $10,000 and the total sales were $8,000 further the variance analysis yields $2,000
which was the difference amount. Particularly, Variance analysis will be effective if an entity
reviews the variance amount over the trend line, that the unexpected changes in this level
from monthly basis can be apparently clear. In accordance with the words of Montgomery
and Douglas, (2017), variance analysis is also inclusive of examination of these considered
differences, so the outcome is as a report becomes the difference from potential, and an
understanding of the occurrence of variance10. Variance analysis is used to determine and
clarify the reasons due to which there was a difference between budgeted and actual figures.
ASSESSMENT 1 (B)
Task 1 – Cost of Manufacture Analysis
In present case manufacturing cost of business relating to furniture making is assessed in
which uniform furniture is manufactured in bulk. Further, two kinds of furniture are being
prepared Furniture A, and Furniture B. Cost sheet relating to this furniture have been
provided with both estimated and budgeted figures to assess the existing variance relating to
cost.
Prime cost- In accordance with the views of Weygandt and et al. (2015), refers to the
cost of the manufactured product which reveals the best profit margin of a company11. The
9 Roberts, Maxwell, and Riccardo Russo. A student's guide to analysis of variance. Routledge, 2014.
10 Montgomery, Douglas C. Design and analysis of experiments. John Wiley & Sons, 2017.
11 Weygandt and et.al. Kieso. Financial & Managerial Accounting. John Wiley & Sons, 2015.
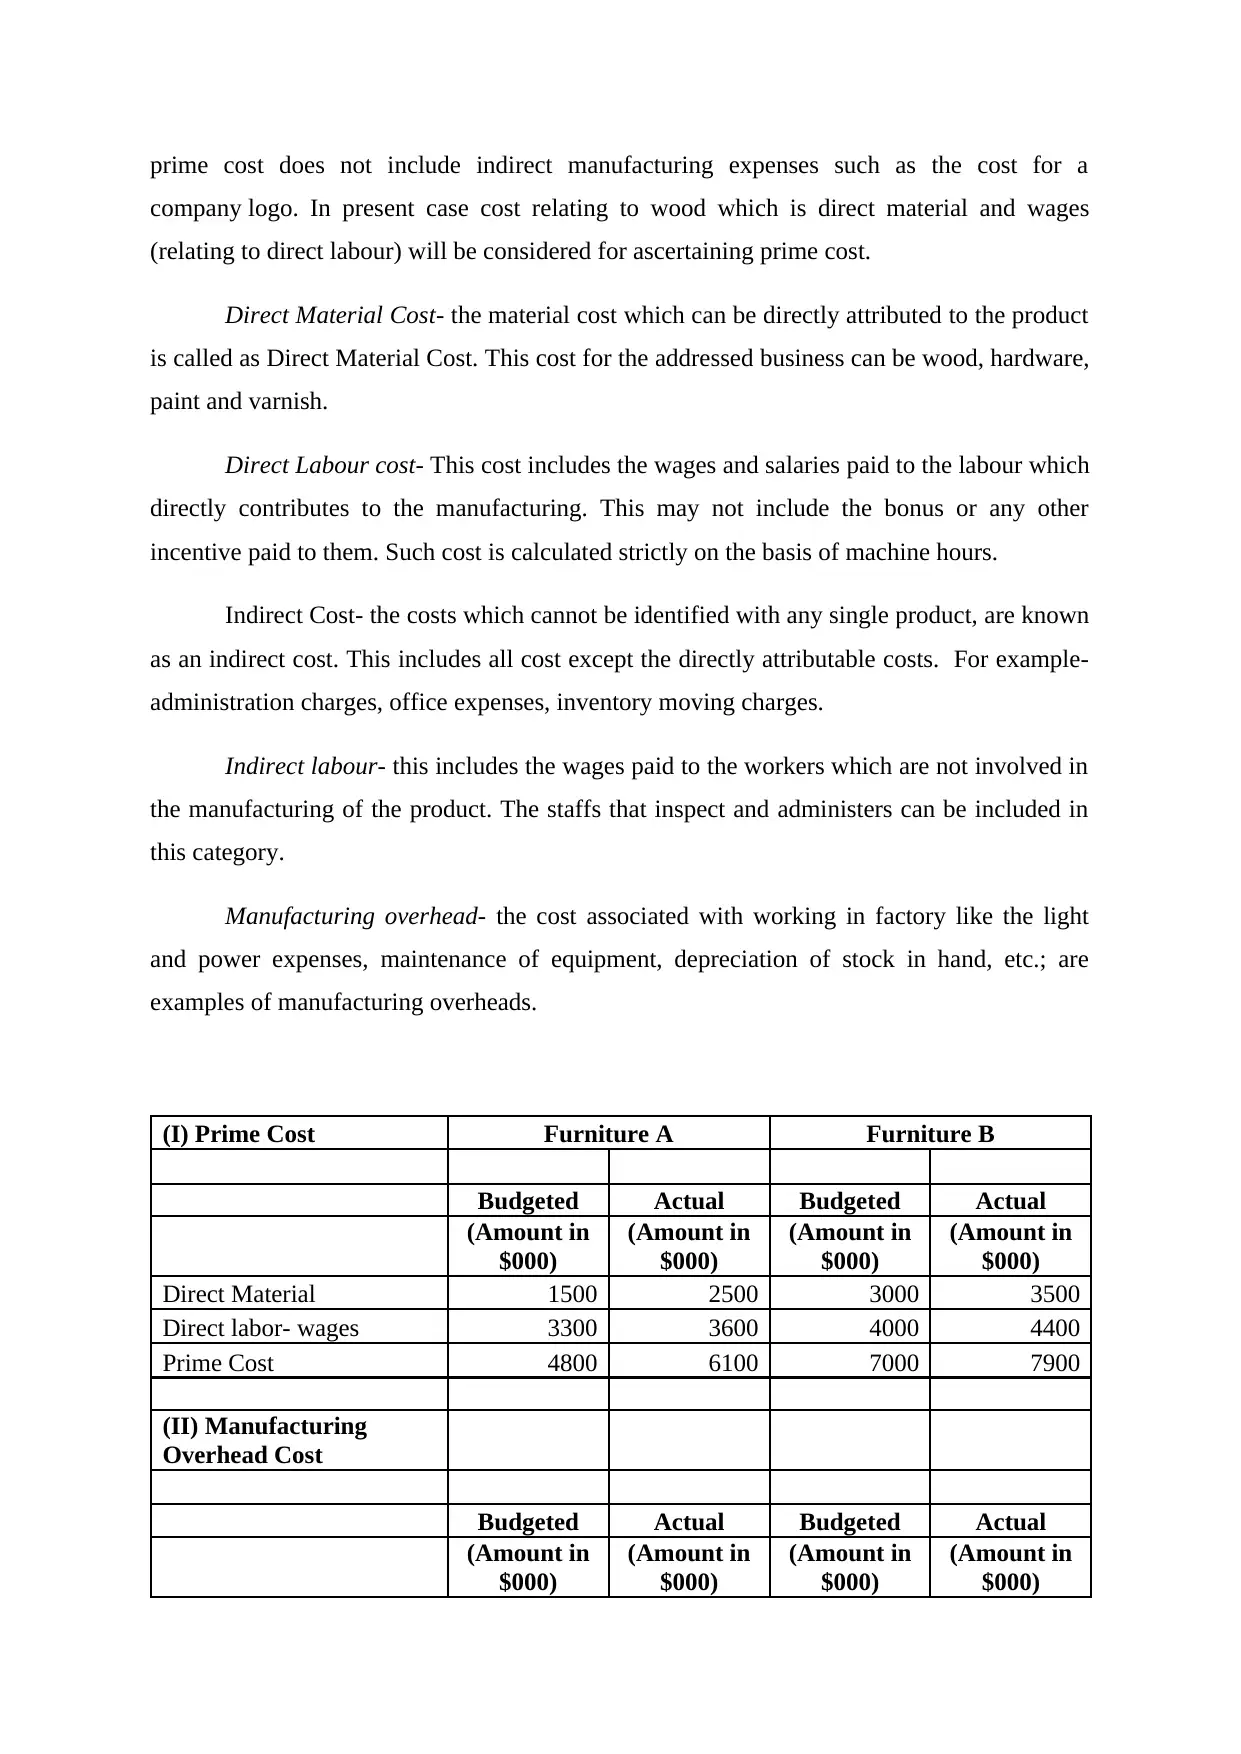
prime cost does not include indirect manufacturing expenses such as the cost for a
company logo. In present case cost relating to wood which is direct material and wages
(relating to direct labour) will be considered for ascertaining prime cost.
Direct Material Cost- the material cost which can be directly attributed to the product
is called as Direct Material Cost. This cost for the addressed business can be wood, hardware,
paint and varnish.
Direct Labour cost- This cost includes the wages and salaries paid to the labour which
directly contributes to the manufacturing. This may not include the bonus or any other
incentive paid to them. Such cost is calculated strictly on the basis of machine hours.
Indirect Cost- the costs which cannot be identified with any single product, are known
as an indirect cost. This includes all cost except the directly attributable costs. For example-
administration charges, office expenses, inventory moving charges.
Indirect labour- this includes the wages paid to the workers which are not involved in
the manufacturing of the product. The staffs that inspect and administers can be included in
this category.
Manufacturing overhead- the cost associated with working in factory like the light
and power expenses, maintenance of equipment, depreciation of stock in hand, etc.; are
examples of manufacturing overheads.
(I) Prime Cost Furniture A Furniture B
Budgeted Actual Budgeted Actual
(Amount in
$000)
(Amount in
$000)
(Amount in
$000)
(Amount in
$000)
Direct Material 1500 2500 3000 3500
Direct labor- wages 3300 3600 4000 4400
Prime Cost 4800 6100 7000 7900
(II) Manufacturing
Overhead Cost
Budgeted Actual Budgeted Actual
(Amount in
$000)
(Amount in
$000)
(Amount in
$000)
(Amount in
$000)
⊘ This is a preview!⊘
Do you want full access?
Subscribe today to unlock all pages.
Trusted by 1+ million students worldwide
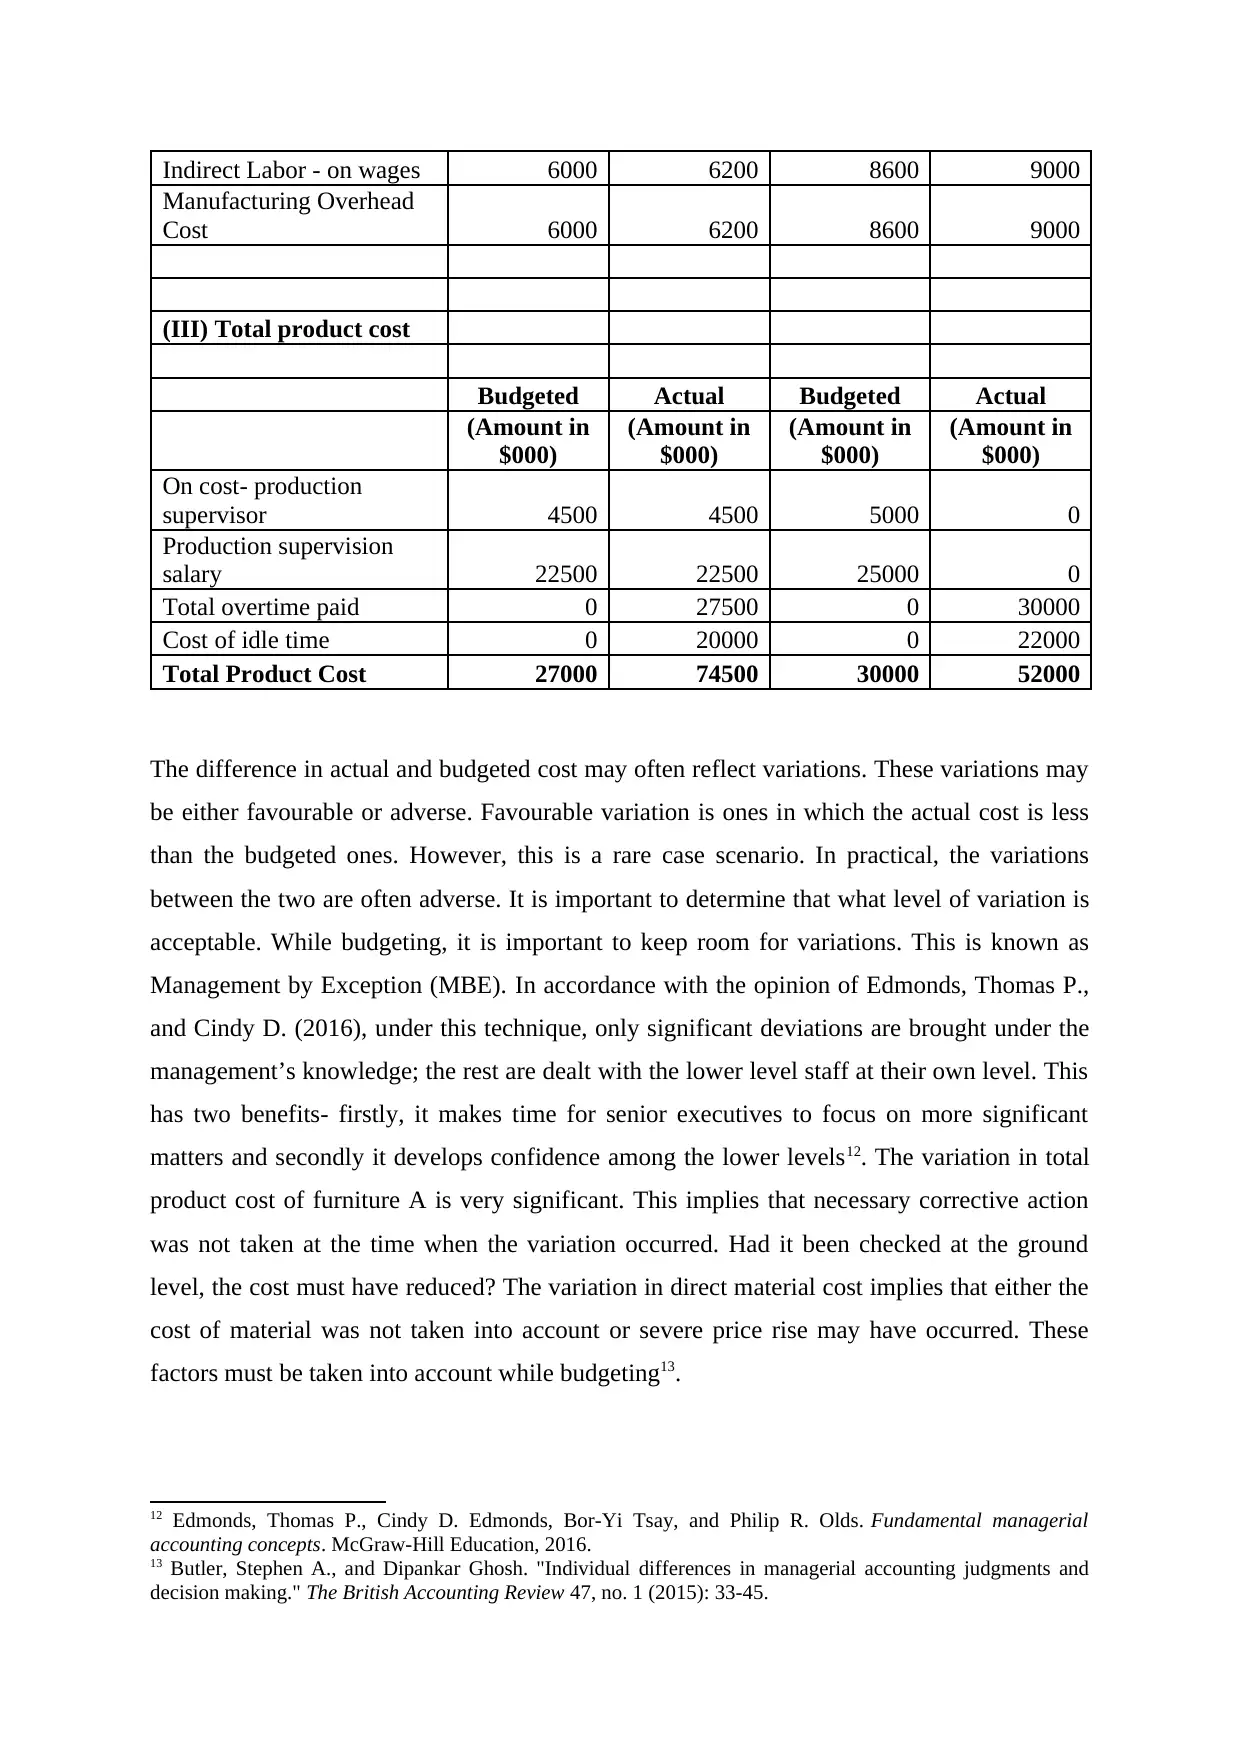
Indirect Labor - on wages 6000 6200 8600 9000
Manufacturing Overhead
Cost 6000 6200 8600 9000
(III) Total product cost
Budgeted Actual Budgeted Actual
(Amount in
$000)
(Amount in
$000)
(Amount in
$000)
(Amount in
$000)
On cost- production
supervisor 4500 4500 5000 0
Production supervision
salary 22500 22500 25000 0
Total overtime paid 0 27500 0 30000
Cost of idle time 0 20000 0 22000
Total Product Cost 27000 74500 30000 52000
The difference in actual and budgeted cost may often reflect variations. These variations may
be either favourable or adverse. Favourable variation is ones in which the actual cost is less
than the budgeted ones. However, this is a rare case scenario. In practical, the variations
between the two are often adverse. It is important to determine that what level of variation is
acceptable. While budgeting, it is important to keep room for variations. This is known as
Management by Exception (MBE). In accordance with the opinion of Edmonds, Thomas P.,
and Cindy D. (2016), under this technique, only significant deviations are brought under the
management’s knowledge; the rest are dealt with the lower level staff at their own level. This
has two benefits- firstly, it makes time for senior executives to focus on more significant
matters and secondly it develops confidence among the lower levels12. The variation in total
product cost of furniture A is very significant. This implies that necessary corrective action
was not taken at the time when the variation occurred. Had it been checked at the ground
level, the cost must have reduced? The variation in direct material cost implies that either the
cost of material was not taken into account or severe price rise may have occurred. These
factors must be taken into account while budgeting13.
12 Edmonds, Thomas P., Cindy D. Edmonds, Bor-Yi Tsay, and Philip R. Olds. Fundamental managerial
accounting concepts. McGraw-Hill Education, 2016.
13 Butler, Stephen A., and Dipankar Ghosh. "Individual differences in managerial accounting judgments and
decision making." The British Accounting Review 47, no. 1 (2015): 33-45.
Paraphrase This Document
Need a fresh take? Get an instant paraphrase of this document with our AI Paraphraser
TASK 2- PRODUCTION COST WORKSHEET
Part A
The output, in this case, will be weaved rugs. Output is said as something which the
end product of a manufacturing process. The output is the final product of the input. In this
case, the rough rugs are woven to produced fine weaved rugs. Fixed input is the product
which remains constant at any number of units14. In this case, rough rags will be the fixed
unit. However, it must be noted at here each unit of input produces a single output. Thus, the
fixed input in this regard will be one labour that is Coretta. The Woking hours of Coretta is
fixed for any unit of output. The variable input will be the additional worker which increases
the level of output up to a certain level.
14 Gitman, Lawrence J., Roger Juchau, and Jack Flanagan. Principles of managerial finance. Pearson Higher
Education AU, 2015.
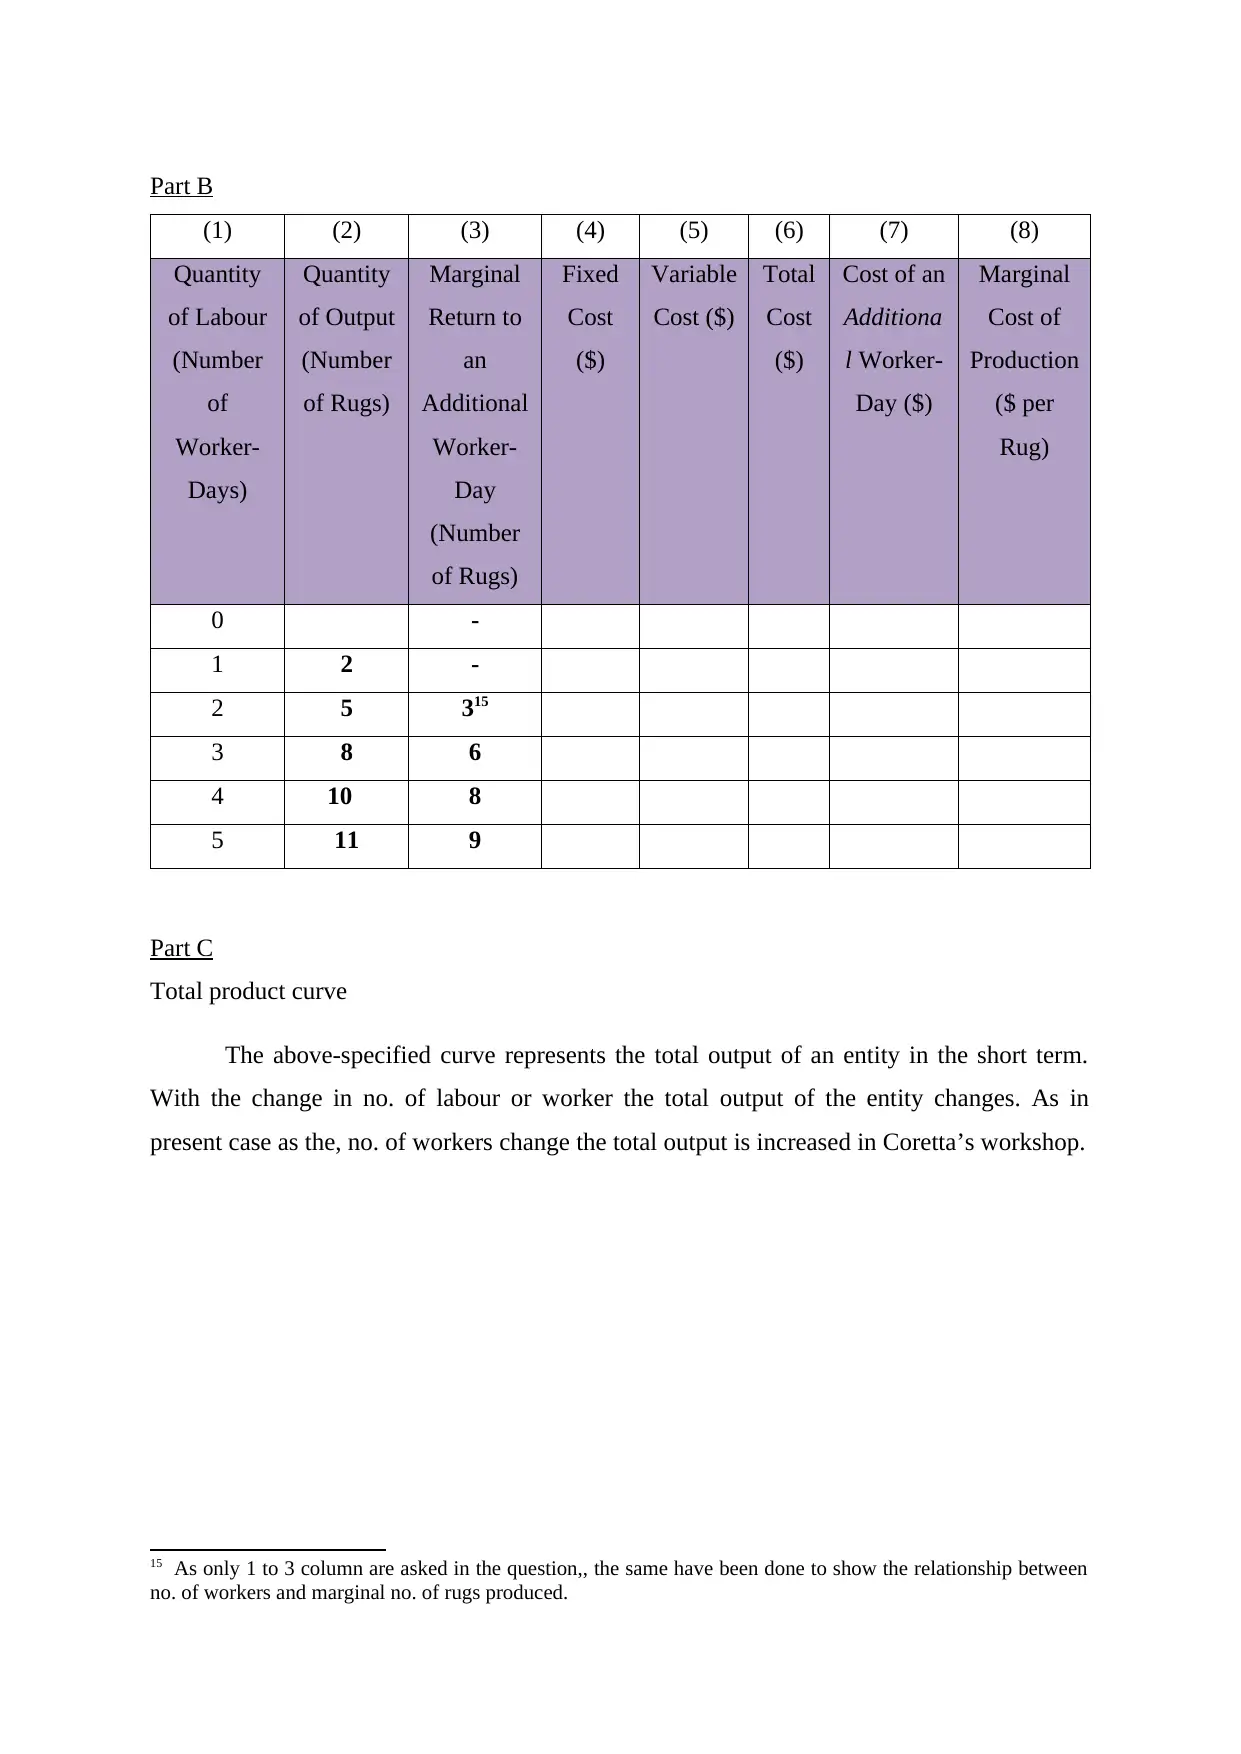
Part B
(1) (2) (3) (4) (5) (6) (7) (8)
Quantity
of Labour
(Number
of
Worker-
Days)
Quantity
of Output
(Number
of Rugs)
Marginal
Return to
an
Additional
Worker-
Day
(Number
of Rugs)
Fixed
Cost
($)
Variable
Cost ($)
Total
Cost
($)
Cost of an
Additiona
l Worker-
Day ($)
Marginal
Cost of
Production
($ per
Rug)
0 -
1 2 -
2 5 315
3 8 6
4 10 8
5 11 9
Part C
Total product curve
The above-specified curve represents the total output of an entity in the short term.
With the change in no. of labour or worker the total output of the entity changes. As in
present case as the, no. of workers change the total output is increased in Coretta’s workshop.
15 As only 1 to 3 column are asked in the question,, the same have been done to show the relationship between
no. of workers and marginal no. of rugs produced.
⊘ This is a preview!⊘
Do you want full access?
Subscribe today to unlock all pages.
Trusted by 1+ million students worldwide
1 out of 18
Related Documents


Your All-in-One AI-Powered Toolkit for Academic Success.
+13062052269
info@desklib.com
Available 24*7 on WhatsApp / Email
![[object Object]](/_next/static/media/star-bottom.7253800d.svg)
Unlock your academic potential
Copyright © 2020–2026 A2Z Services. All Rights Reserved. Developed and managed by ZUCOL.