Management Accounting Report on Costing, Budgeting, and Performance
VerifiedAdded on 2020/09/08
|22
|4577
|50
Report
AI Summary
This report delves into the core principles of management accounting, providing a detailed analysis of costing and budgeting techniques. It begins by classifying costs into fixed, variable, and semi-variable categories, followed by an examination of direct and indirect costs, and functional cost classifications. The report then computes total costs and cost per unit at various production levels, supported by graphical presentations. Inventory valuation methods, including FIFO, LIFO, and average cost, are thoroughly examined, with COGS reports prepared for each method. Critical success factors and key performance indicators (KPIs) are discussed, along with suggestions for cost reduction and value enhancement. The report also covers budgeting, including sales, production, raw materials, labor, and overhead budgets, culminating in a cash budget and profit variance analysis. Finally, recommendations are provided to improve financial performance and aid in informed decision-making within a business context.
Management accounting
costing and budgeting
costing and budgeting
Paraphrase This Document
Need a fresh take? Get an instant paraphrase of this document with our AI Paraphraser
Table of Contents
INTRODUCTION...........................................................................................................................1
TASK 1............................................................................................................................................1
Q1................................................................................................................................................1
a) Classify costs into fixed, variable and semi-variable costs.....................................................1
b) Other ways of classifying costs..............................................................................................2
Q2................................................................................................................................................3
a) Compute the total cost and cost per unit at different level of unit..........................................3
b) Analyse cost using graphical presentation..............................................................................3
Q3................................................................................................................................................5
1. FIFO........................................................................................................................................5
2. LIFO........................................................................................................................................5
3. Average cost............................................................................................................................5
Q4 Prepare COGS report for FIFO, LIFO and Average cost.....................................................6
Q5................................................................................................................................................7
a) Two critical success factors and KPI......................................................................................7
b) Suggestion...............................................................................................................................8
Cost reduction.............................................................................................................................8
Value and quality enhancement..................................................................................................9
Q6................................................................................................................................................9
a) Describe budget.......................................................................................................................9
b) Purpose of budget...................................................................................................................9
c) Methods of budget................................................................................................................10
Q7..............................................................................................................................................10
a) Sales budget..........................................................................................................................10
b) Production budget.................................................................................................................11
c) Raw material budget.............................................................................................................11
d) Labour budget.......................................................................................................................12
e) Total overhead budget...........................................................................................................12
Q8 Cash budget.........................................................................................................................12
Q9..............................................................................................................................................13
a) Budget profit.........................................................................................................................13
b) Actual profit .........................................................................................................................14
c) Material and labour sub variances........................................................................................15
d) Operating statement for reconciling budgeted and actual profit...........................................15
Q10 Recommendation...............................................................................................................15
CONCLUSION..............................................................................................................................16
REFERENCES..............................................................................................................................17
⊘ This is a preview!⊘
Do you want full access?
Subscribe today to unlock all pages.
Trusted by 1+ million students worldwide
Index of Tables
Table 1: Classification of costs........................................................................................................1
Table 2: Cost per unit and total cost................................................................................................3
Table 3: Closing stock of FIFO.......................................................................................................5
Table 4: Closing stock of LIFO.......................................................................................................5
Table 5: Closing inventory of Average cost....................................................................................5
Table 6: COGS report of FIFO method...........................................................................................6
Table 7: COGS report of LIFO method...........................................................................................6
Table 8: COGS report of Average cost method...............................................................................6
Table 9: Sales budget.....................................................................................................................10
Table 10: Production budget..........................................................................................................11
Table 11: Raw material budget......................................................................................................11
Table 12: Labour budget................................................................................................................12
Table 13: Overhead budget............................................................................................................12
Table 14: Cash budget...................................................................................................................12
Table 15: Budgeted Profit..............................................................................................................13
Table 16: Actual profit...................................................................................................................14
Table 17: Reconciliation statement................................................................................................15
Illustration Index
Illustration 1: Material and labour variances.................................................................................15
Paraphrase This Document
Need a fresh take? Get an instant paraphrase of this document with our AI Paraphraser
INTRODUCTION
Role of management accounting increases with the increasing external market difficulties
located in the external business environment. This project is about using several techniques if
budgeting in identifying all the problems incurred in business along with the proper management
of financial resources. This report also emphasises on different kinds of costs incurred in an
entity.
TASK 1
Q1
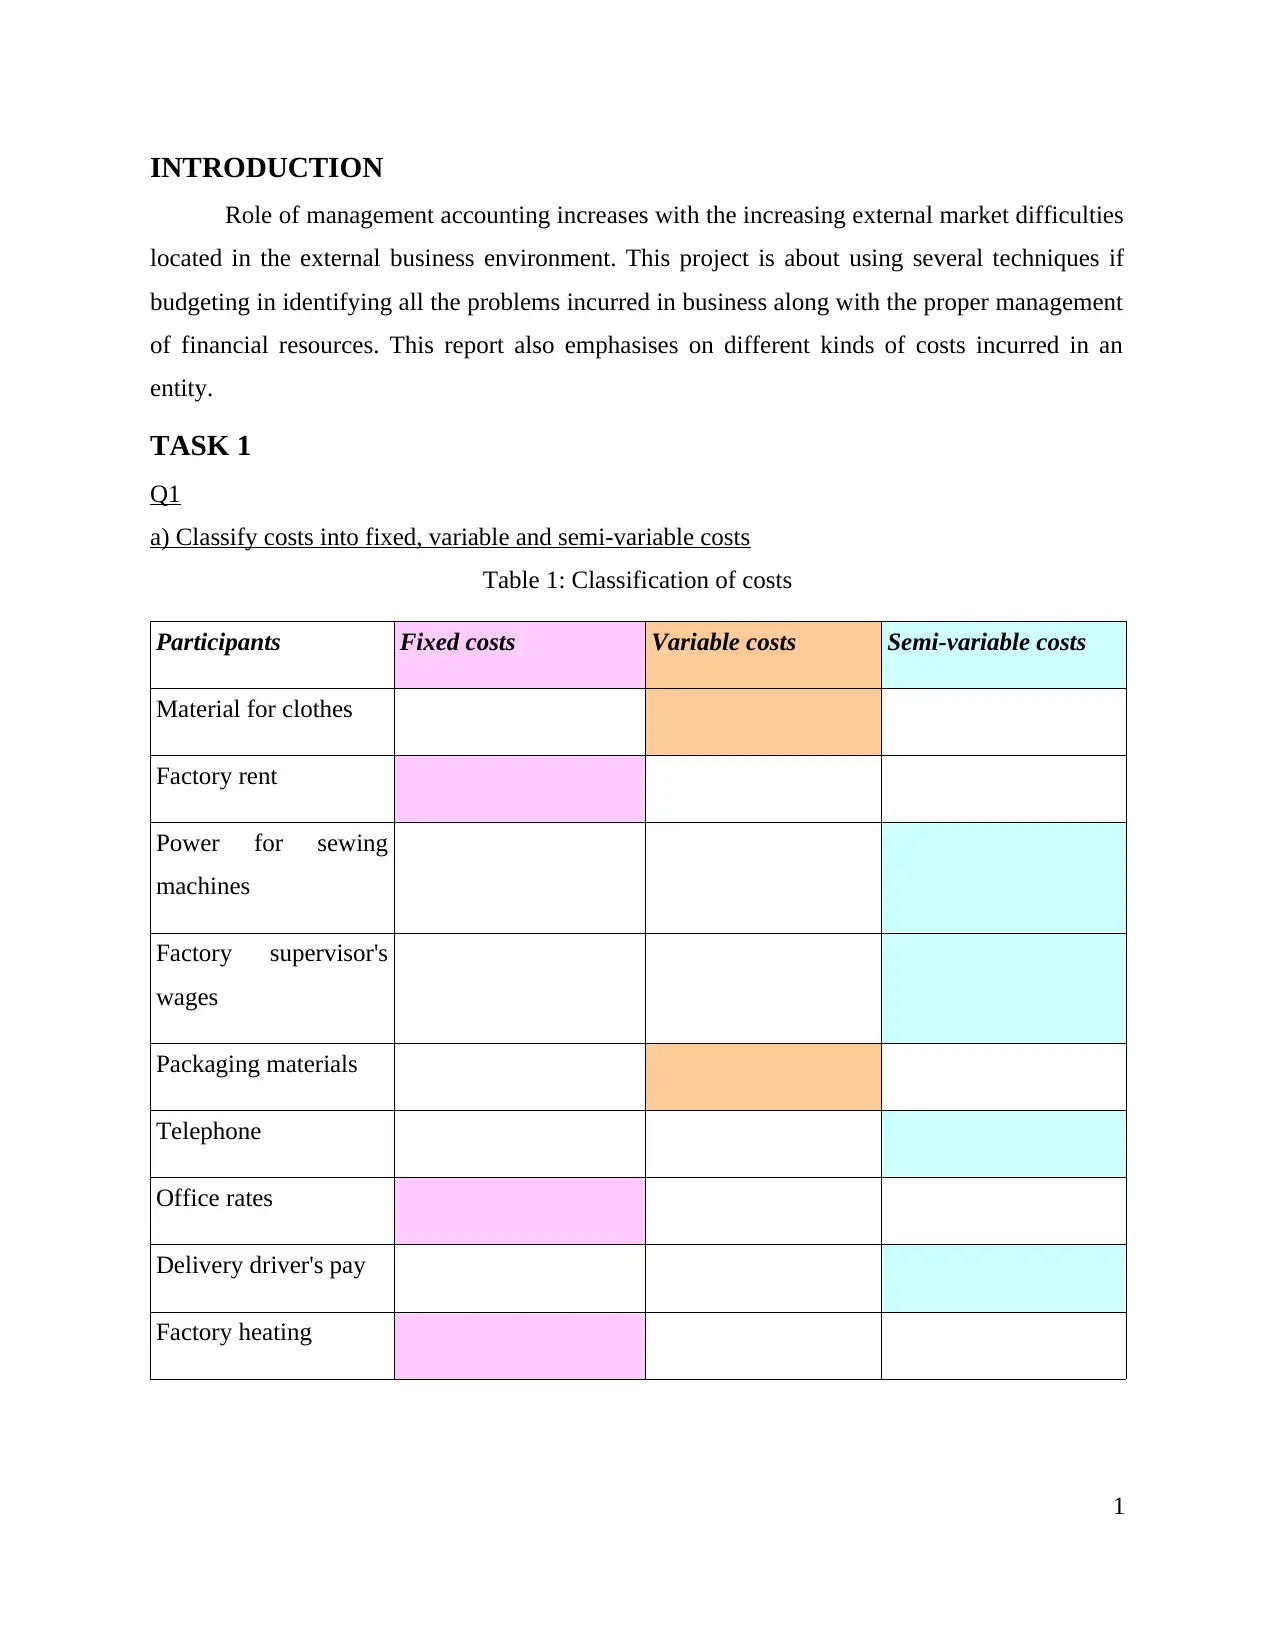
a) Classify costs into fixed, variable and semi-variable costs
Table 1: Classification of costs
Participants Fixed costs Variable costs Semi-variable costs
Material for clothes
Factory rent
Power for sewing
machines
Factory supervisor's
wages
Packaging materials
Telephone
Office rates
Delivery driver's pay
Factory heating
1
Role of management accounting increases with the increasing external market difficulties
located in the external business environment. This project is about using several techniques if
budgeting in identifying all the problems incurred in business along with the proper management
of financial resources. This report also emphasises on different kinds of costs incurred in an
entity.
TASK 1
Q1
a) Classify costs into fixed, variable and semi-variable costs
Table 1: Classification of costs
Participants Fixed costs Variable costs Semi-variable costs
Material for clothes
Factory rent
Power for sewing
machines
Factory supervisor's
wages
Packaging materials
Telephone
Office rates
Delivery driver's pay
Factory heating
1
In the above classification of costs of various expenses incurred in the business in several
criteria such as fixed cost, variable cost and semi variable costs. Three colours are taken in order
to reflect the three different costs (Management accounting, 2017). Above classification of cots
is shows like a matrix in which an entity will easily identify which expenses falls under which
particular category in order to help an entity in reducing the current cost incurred in the business.
Performance of the business is regarded as one of the important aspects to be considered by an
enterprise owner in uplifting their existing business conditions (Leite, Fernandes and Leite,
2016). It can be seen from the classification matrix that majority of costs incurred in the Smart
looks entity falls under the category of semi variable costs which ave constituent of both costs
such as variable as well as fixed costs incurred in the business. Semi variable costs is widely
incurred in the corporation but due to its wrong classification an employer is not able to identify
its nature and categorise them as fixed costs or variable costs which in turn induces the overall
costs incurred in the business.
b) Other ways of classifying costs
Direct costs- It is that type of costs incurred in the business which is directly attributable
to a product such as raw material used in the making of a particular product. Expenses
incurred by an enterprise owner which is related directly with the manufacturing of a
single product. Direct costs of a singular product can be easily traced out by the
management as this falls under the nature of costs.
Indirect costs- Another costs incurred in a firm is opposite version of the above mention
costs in which the costs is indirectly associated with the making of a product. Lubricating
oil used in improving the condition of machine helps in manufacturing of a product.
These costs are considered as indirect as there is no close relationship among this
particular costs with the manufactured product in the business enterprise.
Function costs- Costs are also segregated in an entity according to various business
function such as productions, finance, human resource and marketing, selling and
distribution and information technology. All these functions are performed by an
employee in achieving desired aims and targets in the business concern (Leite, Fernandes
and Leite, 2016). Sole responsibility of business manager is to emphasise on each and
every factors included in an entity as this helps in achieving desired aims and targets
2
⊘ This is a preview!⊘
Do you want full access?
Subscribe today to unlock all pages.
Trusted by 1+ million students worldwide
framed by an enterprise owner. It includes products costs which is regarded as that type
of costs which helps in producing or manufacturing single product in an entity.
Production costs incurred in the business such as cost of raw material. Raw material is
regarded as basic factor of costs included in the business. Marketing costs involved in an
entity includes cost of advertising incurred in the business for creating market awareness
about al the products or services offered by an employer to all the clients located in the
external business environment. Information technology costs is regarded as the important
costs as communicating important information from one end to another is essential for an
entity in achieving all aims and targets within a given span of time. Role of business gets
increases with the passage of time as all types of costs are identified by the management
in initial stage in order to target all important type of costs with higher value which an
enterprise tries to minimise it within a given span of time.
Q2
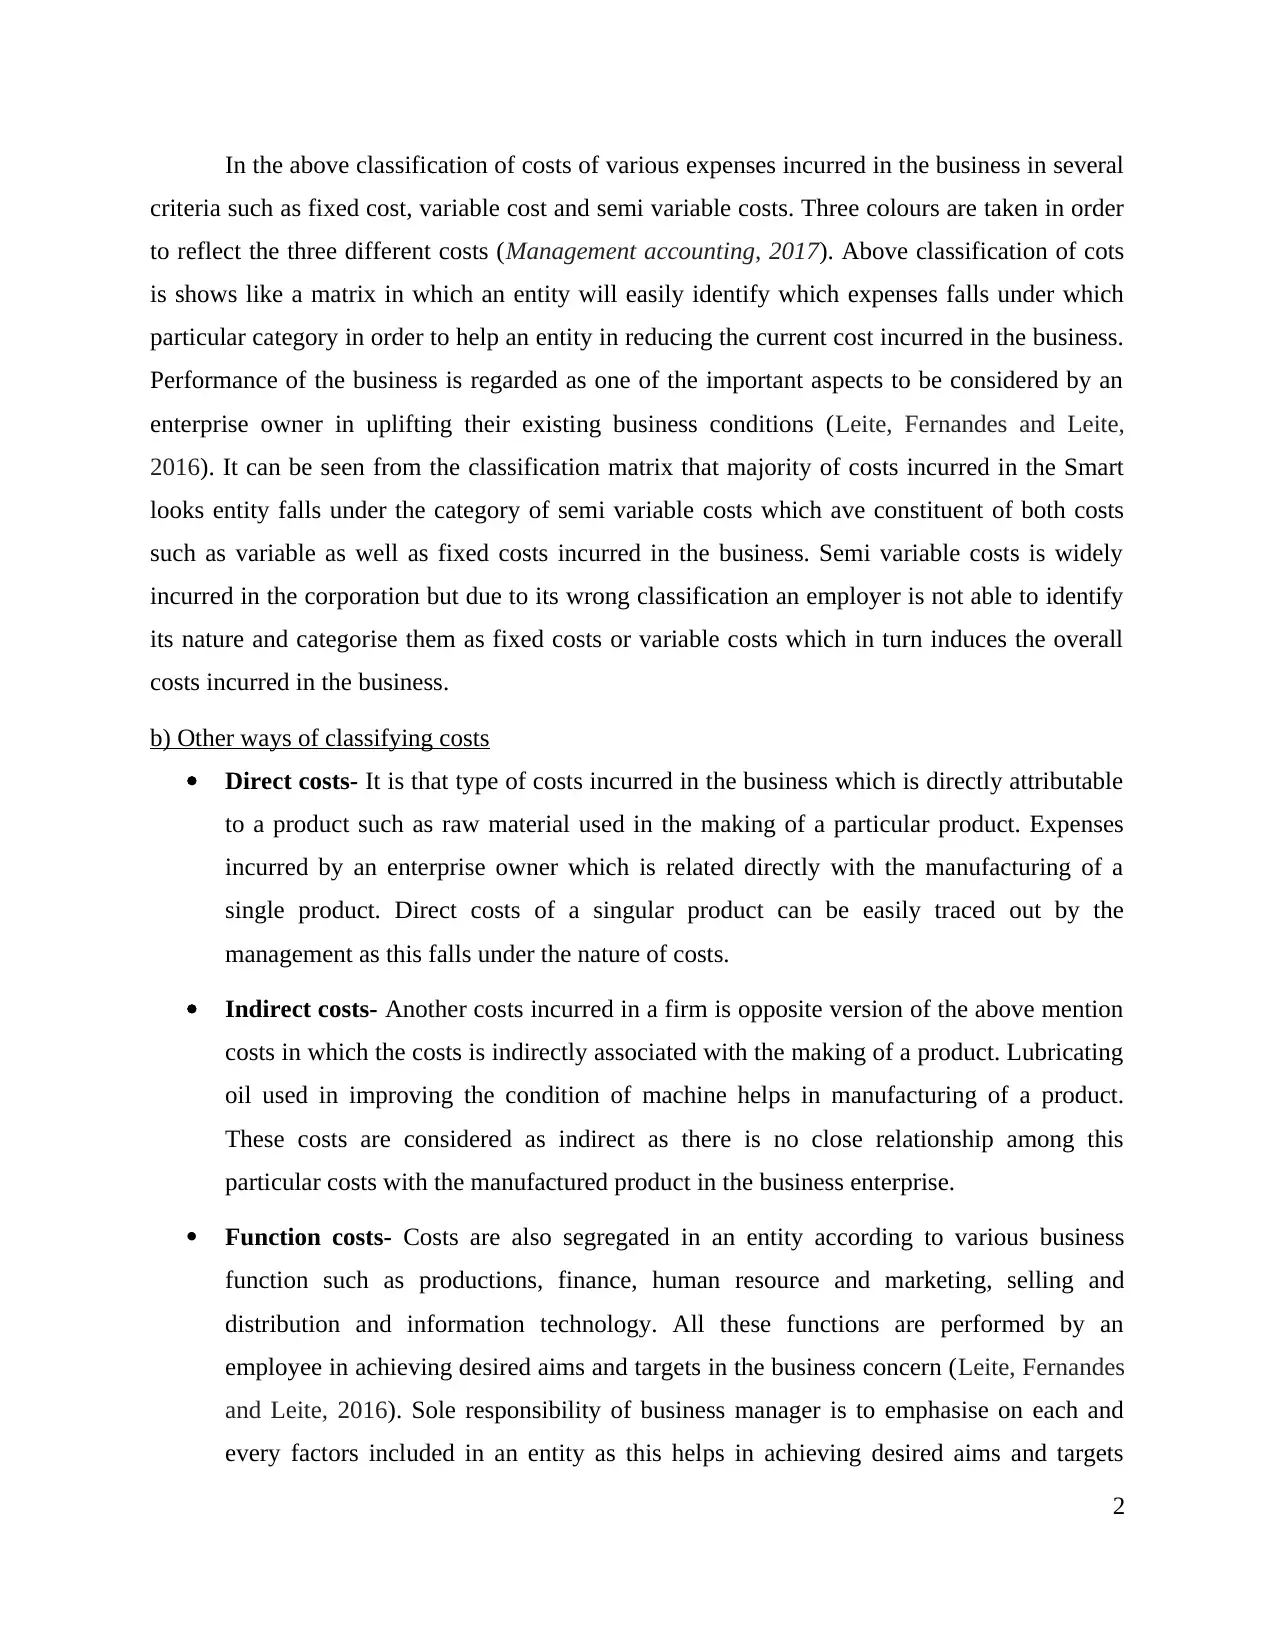
a) Compute the total cost and cost per unit at different level of unit
Table 2: Cost per unit and total cost
Particulars Cost per unit 15000 units 20000 units 25000 units
Material £5 £75000 £100000 £125000
Labour £6 £90000 £120000 £150000
Fixed costs £50000 £50000 £50000 £50000
Total costs £215000 £270000 £325000
Cost per unit £14.33 £13.5 £13
3
of costs which helps in producing or manufacturing single product in an entity.
Production costs incurred in the business such as cost of raw material. Raw material is
regarded as basic factor of costs included in the business. Marketing costs involved in an
entity includes cost of advertising incurred in the business for creating market awareness
about al the products or services offered by an employer to all the clients located in the
external business environment. Information technology costs is regarded as the important
costs as communicating important information from one end to another is essential for an
entity in achieving all aims and targets within a given span of time. Role of business gets
increases with the passage of time as all types of costs are identified by the management
in initial stage in order to target all important type of costs with higher value which an
enterprise tries to minimise it within a given span of time.
Q2
a) Compute the total cost and cost per unit at different level of unit
Table 2: Cost per unit and total cost
Particulars Cost per unit 15000 units 20000 units 25000 units
Material £5 £75000 £100000 £125000
Labour £6 £90000 £120000 £150000
Fixed costs £50000 £50000 £50000 £50000
Total costs £215000 £270000 £325000
Cost per unit £14.33 £13.5 £13
3
Paraphrase This Document
Need a fresh take? Get an instant paraphrase of this document with our AI Paraphraser
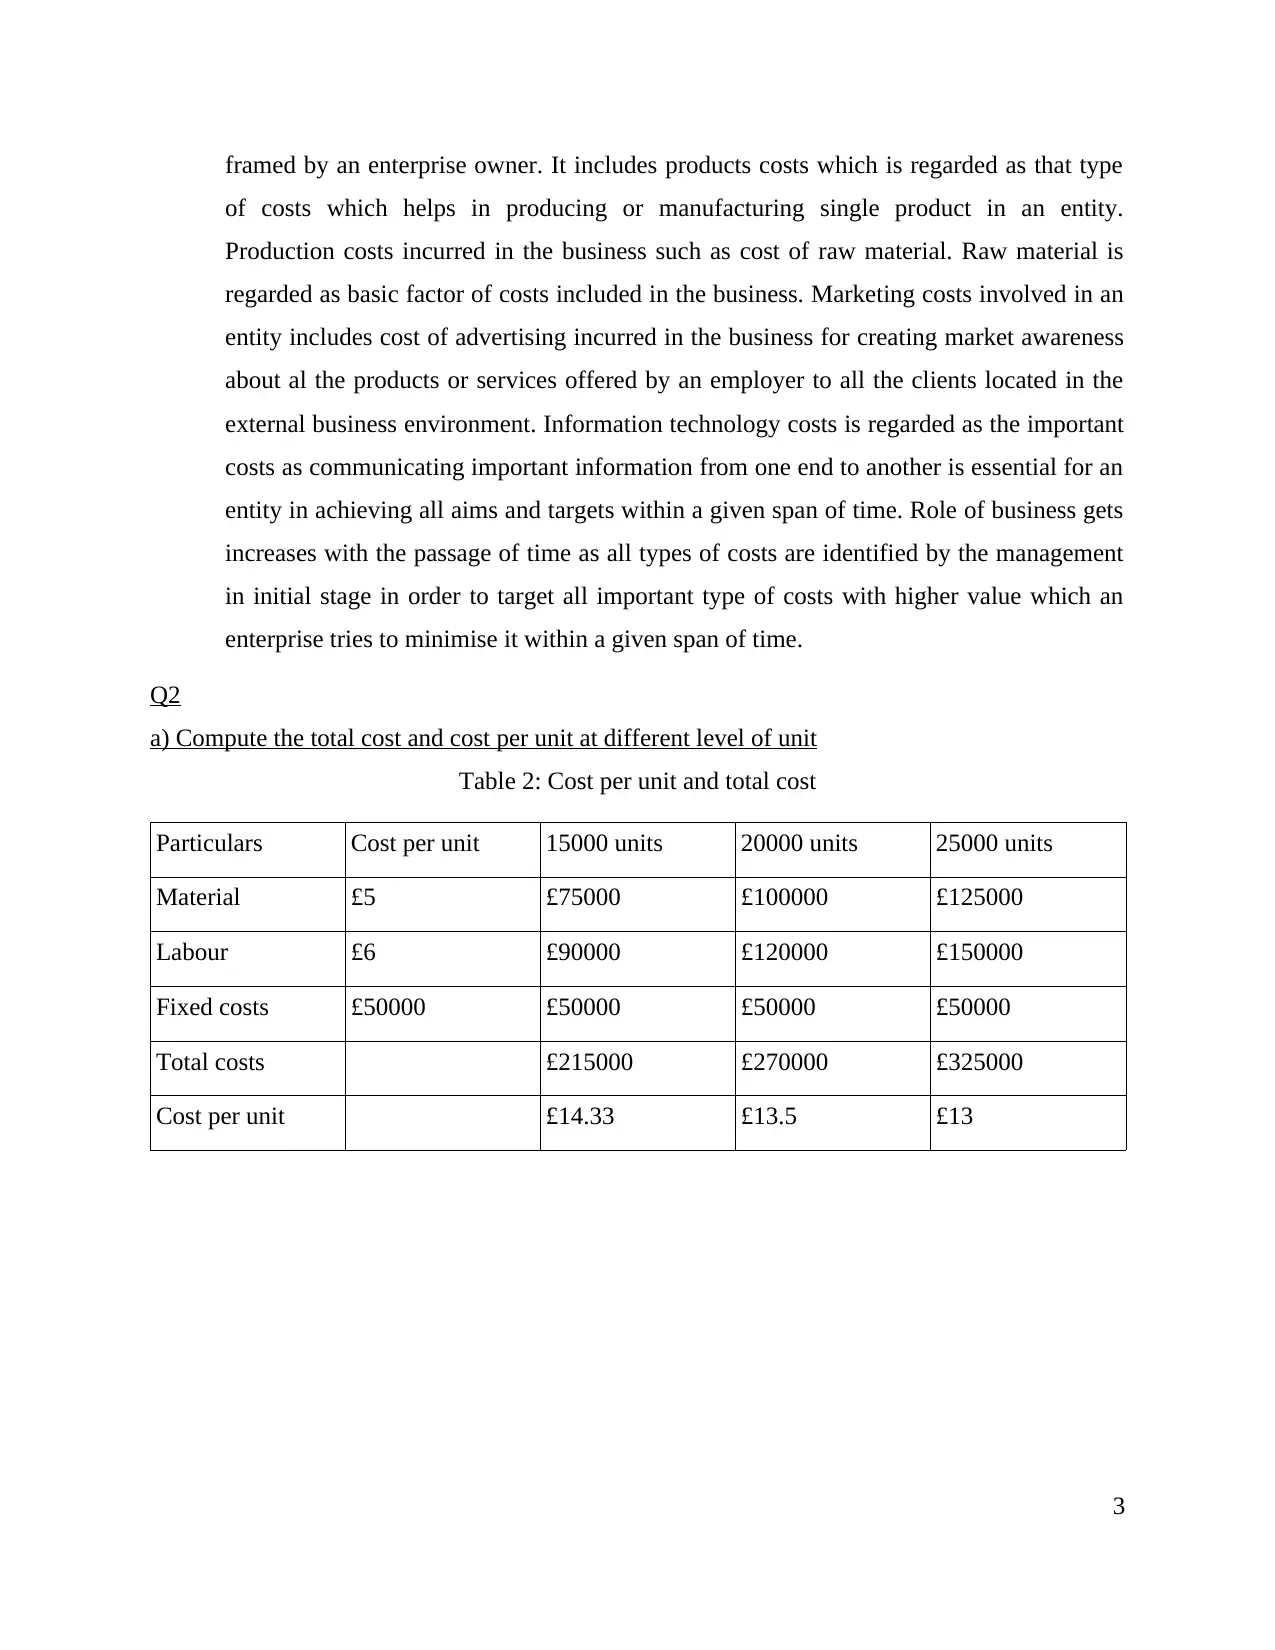
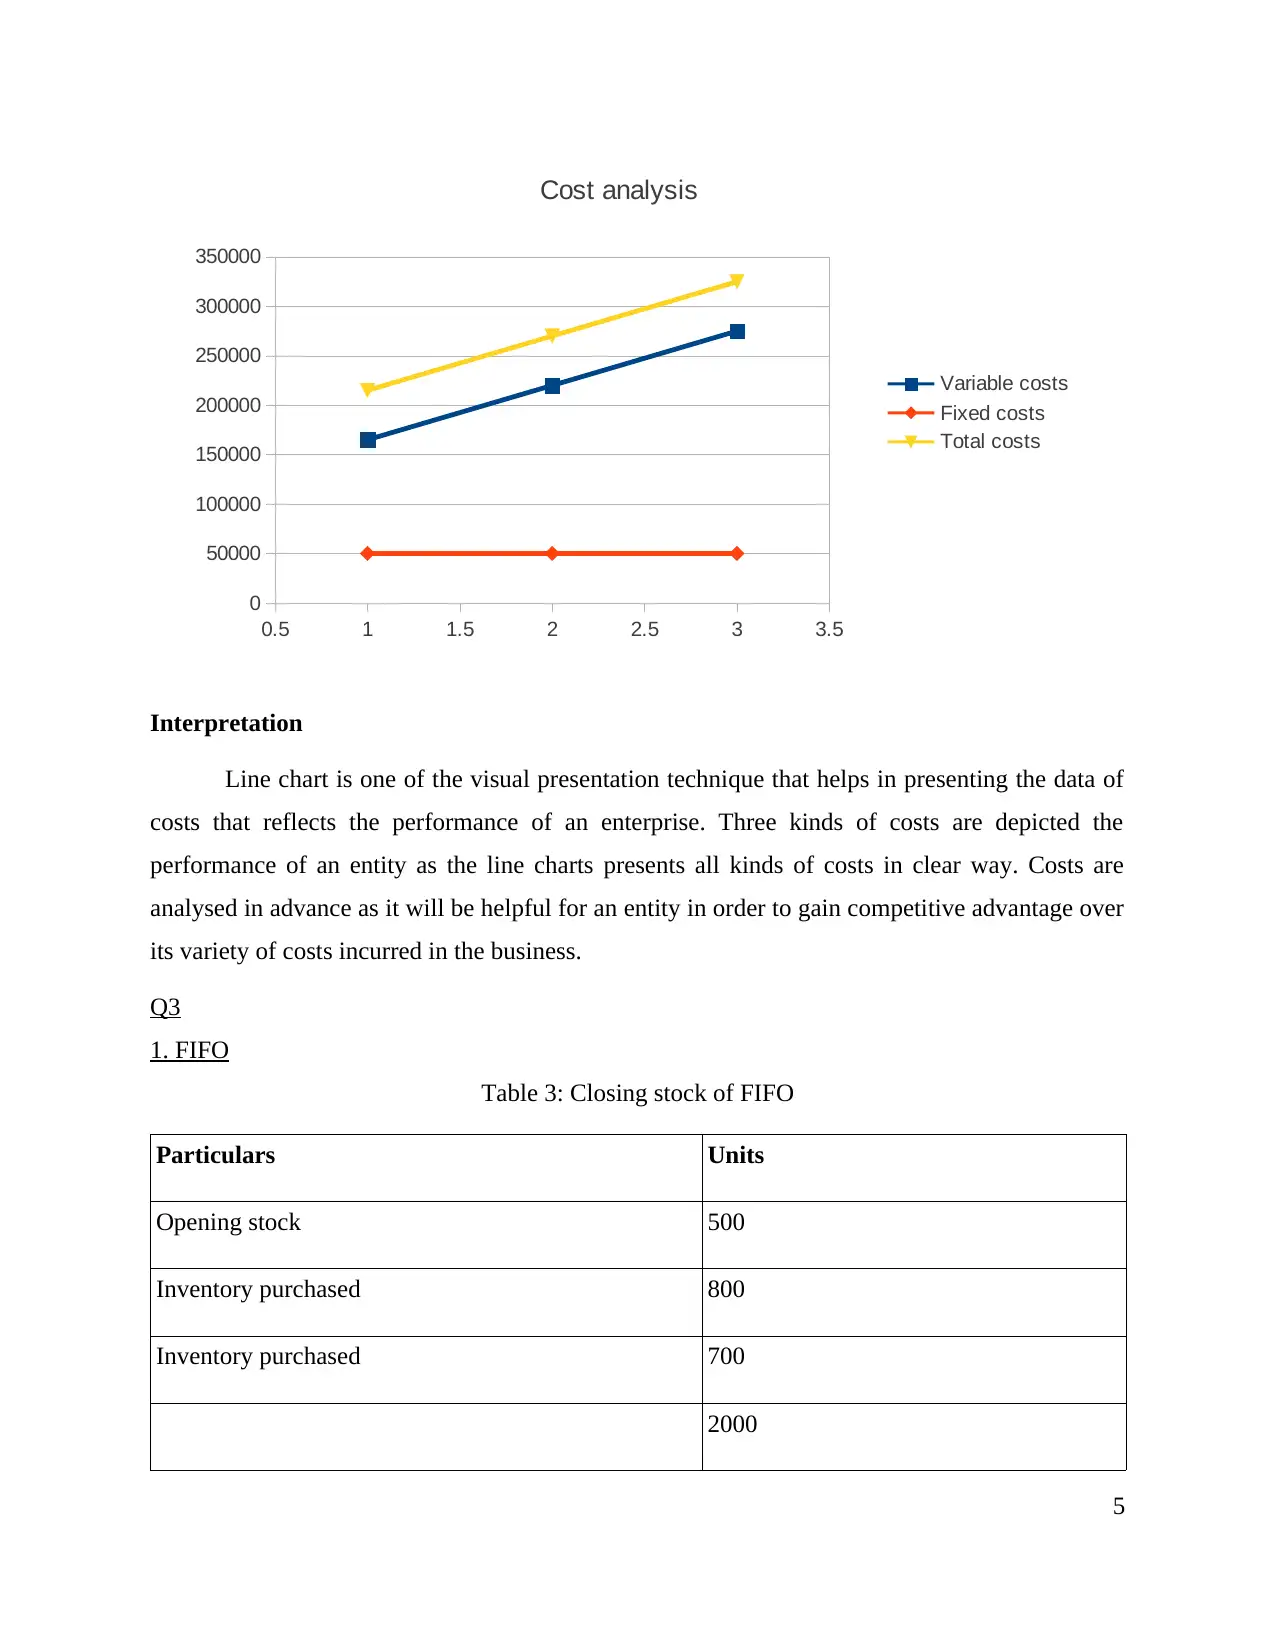
b) Analyse cost using graphical presentation
15000 units 20000 units 25000 units
0
50000
100000
150000
200000
250000
300000
350000
Cost analysis
Variable costs
Fixed costs
Total costs
Interpretation
Costs is regarded as one of the important aspects of the organisation which will be
identified at initial stage in order to improve the overall performance of an entity. Cost is the
negative element incurred in the corporation that will be minimised by the firm as it has
categorised into various categories such as fixed cost, variable costs and semi variable costs
takes places in an entity (Kaplan and Atkinson, 2015). There are different types of costs incurred
in the business as fixed costs which incurred in the business in zero or more production units
manufactured by an entity. In the current case scenario, Costs are evaluated on three different
unit level such as in an increasing order from 15000 units, 20000 units and 25000 units. It can be
seen from the above graph that apart from fixed costs increasing variable costs in an entity at
different activity level he overall costs incurred in the business has increases with the passage of
time. Total cost increases in an enterprise due to variable costs as it increases or decreases the
overall cost in an entity.
4
0.5 1 1.5 2 2.5 3 3.5
0
50000
100000
150000
200000
250000
300000
350000
Cost analysis
Variable costs
Fixed costs
Total costs
Interpretation
Line chart is one of the visual presentation technique that helps in presenting the data of
costs that reflects the performance of an enterprise. Three kinds of costs are depicted the
performance of an entity as the line charts presents all kinds of costs in clear way. Costs are
analysed in advance as it will be helpful for an entity in order to gain competitive advantage over
its variety of costs incurred in the business.
Q3
1. FIFO
Table 3: Closing stock of FIFO
Particulars Units
Opening stock 500
Inventory purchased 800
Inventory purchased 700
2000
5
⊘ This is a preview!⊘
Do you want full access?
Subscribe today to unlock all pages.
Trusted by 1+ million students worldwide
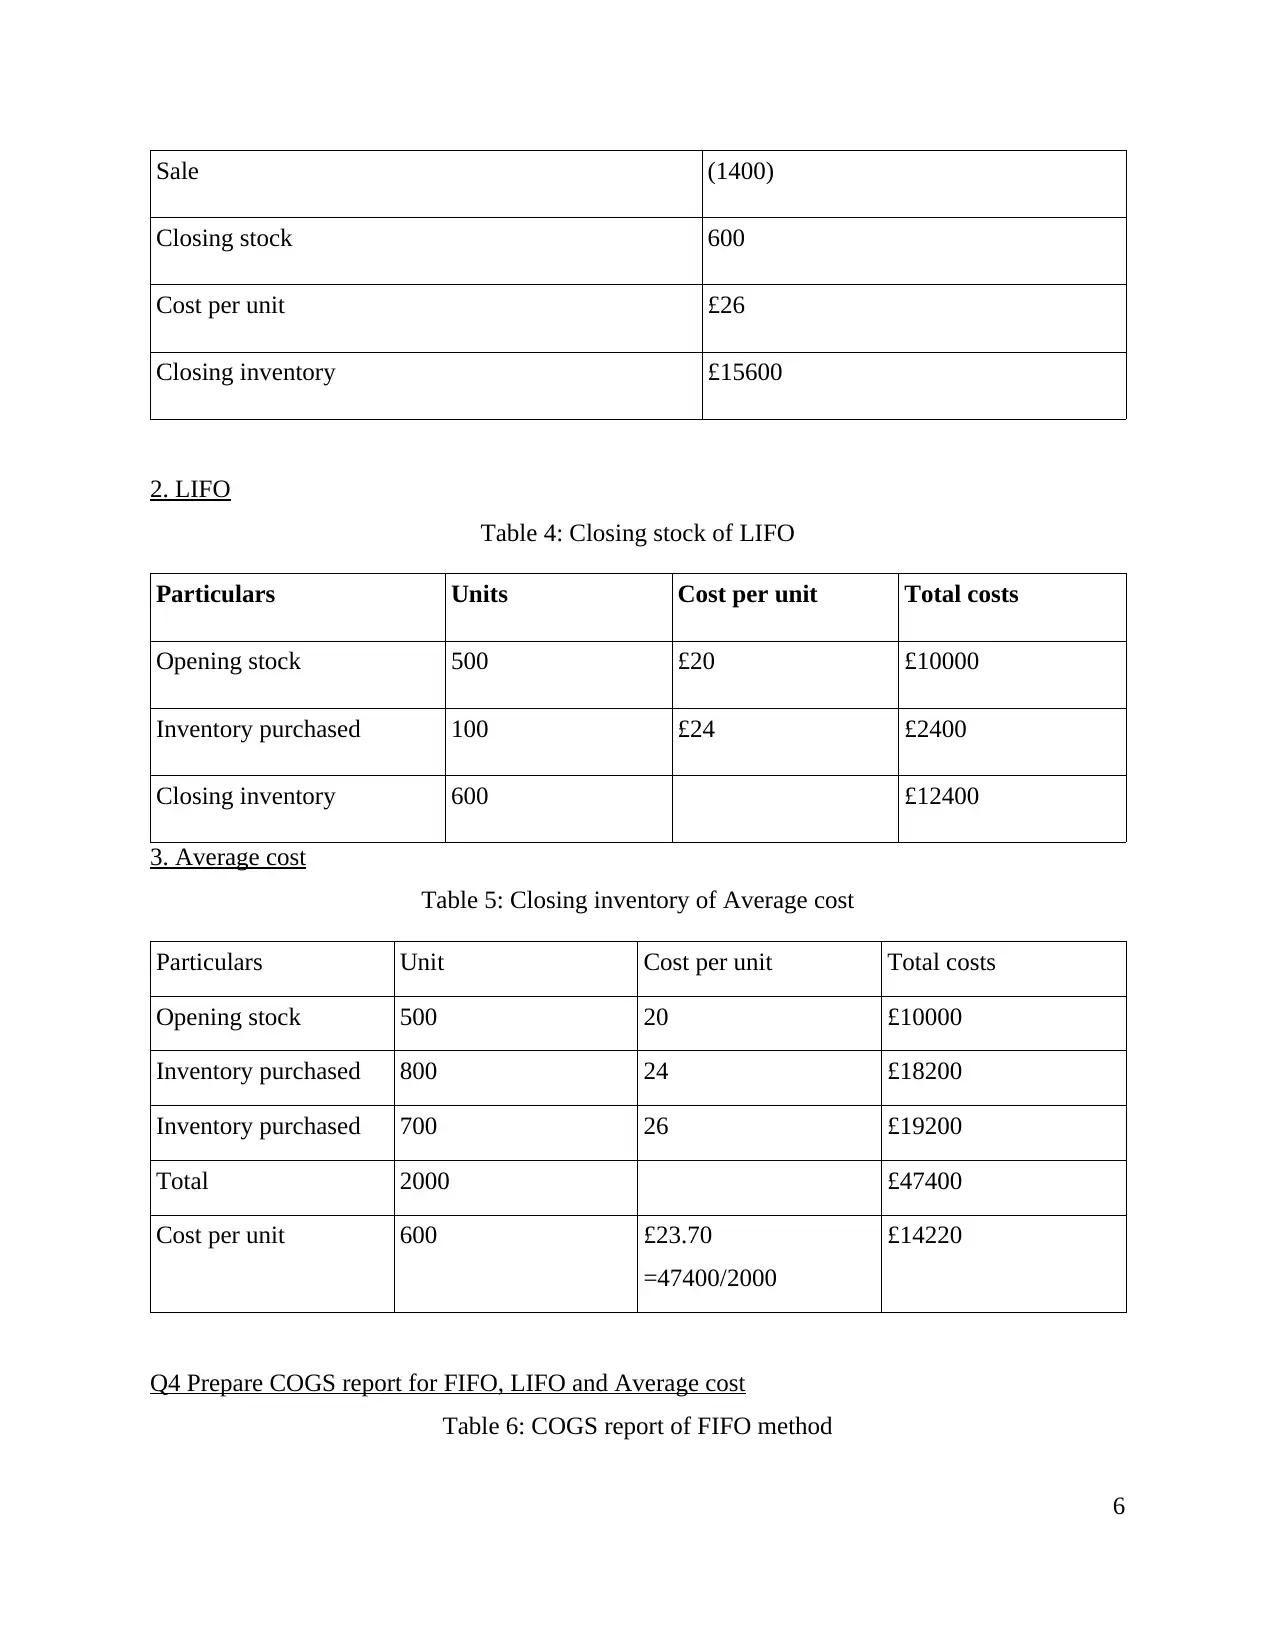
Sale (1400)
Closing stock 600
Cost per unit £26
Closing inventory £15600
2. LIFO
Table 4: Closing stock of LIFO
Particulars Units Cost per unit Total costs
Opening stock 500 £20 £10000
Inventory purchased 100 £24 £2400
Closing inventory 600 £12400
3. Average cost
Table 5: Closing inventory of Average cost
Particulars Unit Cost per unit Total costs
Opening stock 500 20 £10000
Inventory purchased 800 24 £18200
Inventory purchased 700 26 £19200
Total 2000 £47400
Cost per unit 600 £23.70
=47400/2000
£14220
Q4 Prepare COGS report for FIFO, LIFO and Average cost
Table 6: COGS report of FIFO method
6
Paraphrase This Document
Need a fresh take? Get an instant paraphrase of this document with our AI Paraphraser
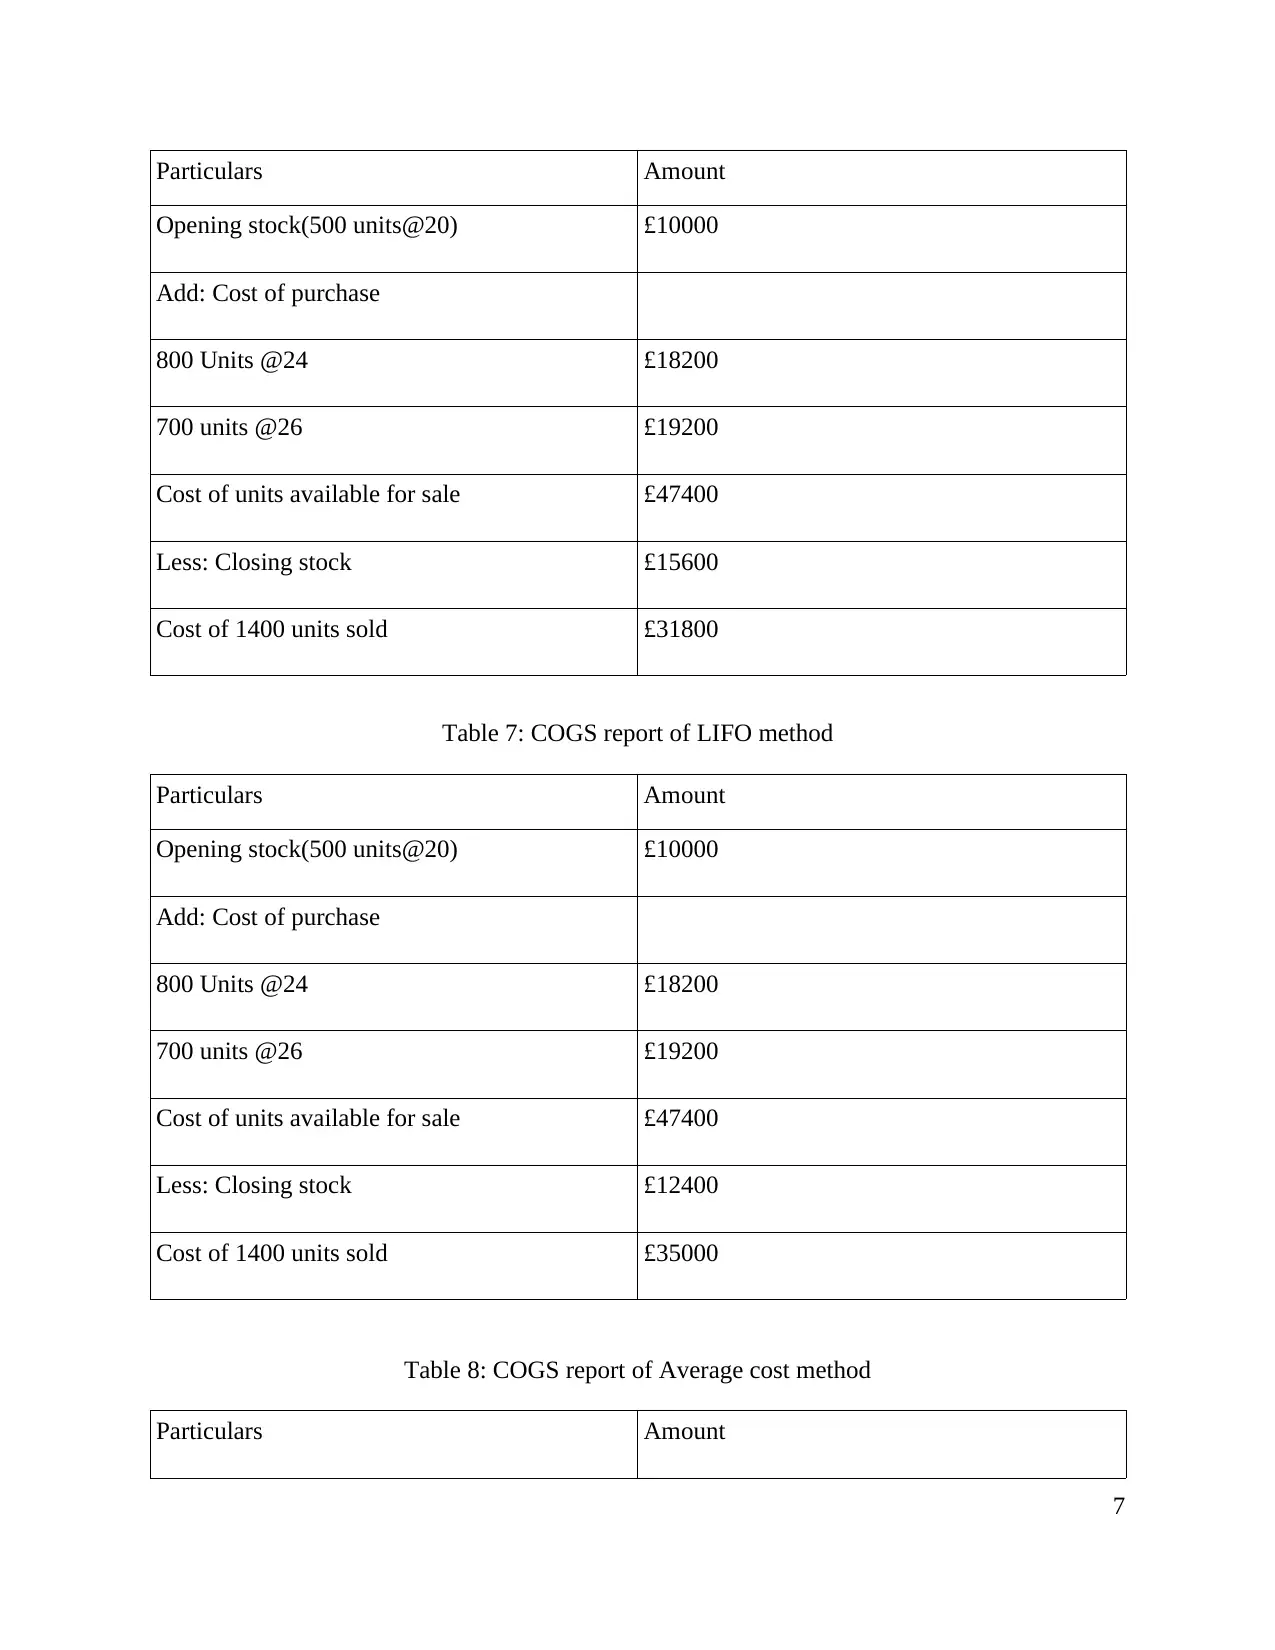
Particulars Amount
Opening stock(500 units@20) £10000
Add: Cost of purchase
800 Units @24 £18200
700 units @26 £19200
Cost of units available for sale £47400
Less: Closing stock £15600
Cost of 1400 units sold £31800
Table 7: COGS report of LIFO method
Particulars Amount
Opening stock(500 units@20) £10000
Add: Cost of purchase
800 Units @24 £18200
700 units @26 £19200
Cost of units available for sale £47400
Less: Closing stock £12400
Cost of 1400 units sold £35000
Table 8: COGS report of Average cost method
Particulars Amount
7
Opening stock(500 units@20) £10000
Add: Cost of purchase
800 Units @24 £18200
700 units @26 £19200
Cost of units available for sale £47400
Less: Closing stock £15600
Cost of 1400 units sold £31800
Table 7: COGS report of LIFO method
Particulars Amount
Opening stock(500 units@20) £10000
Add: Cost of purchase
800 Units @24 £18200
700 units @26 £19200
Cost of units available for sale £47400
Less: Closing stock £12400
Cost of 1400 units sold £35000
Table 8: COGS report of Average cost method
Particulars Amount
7
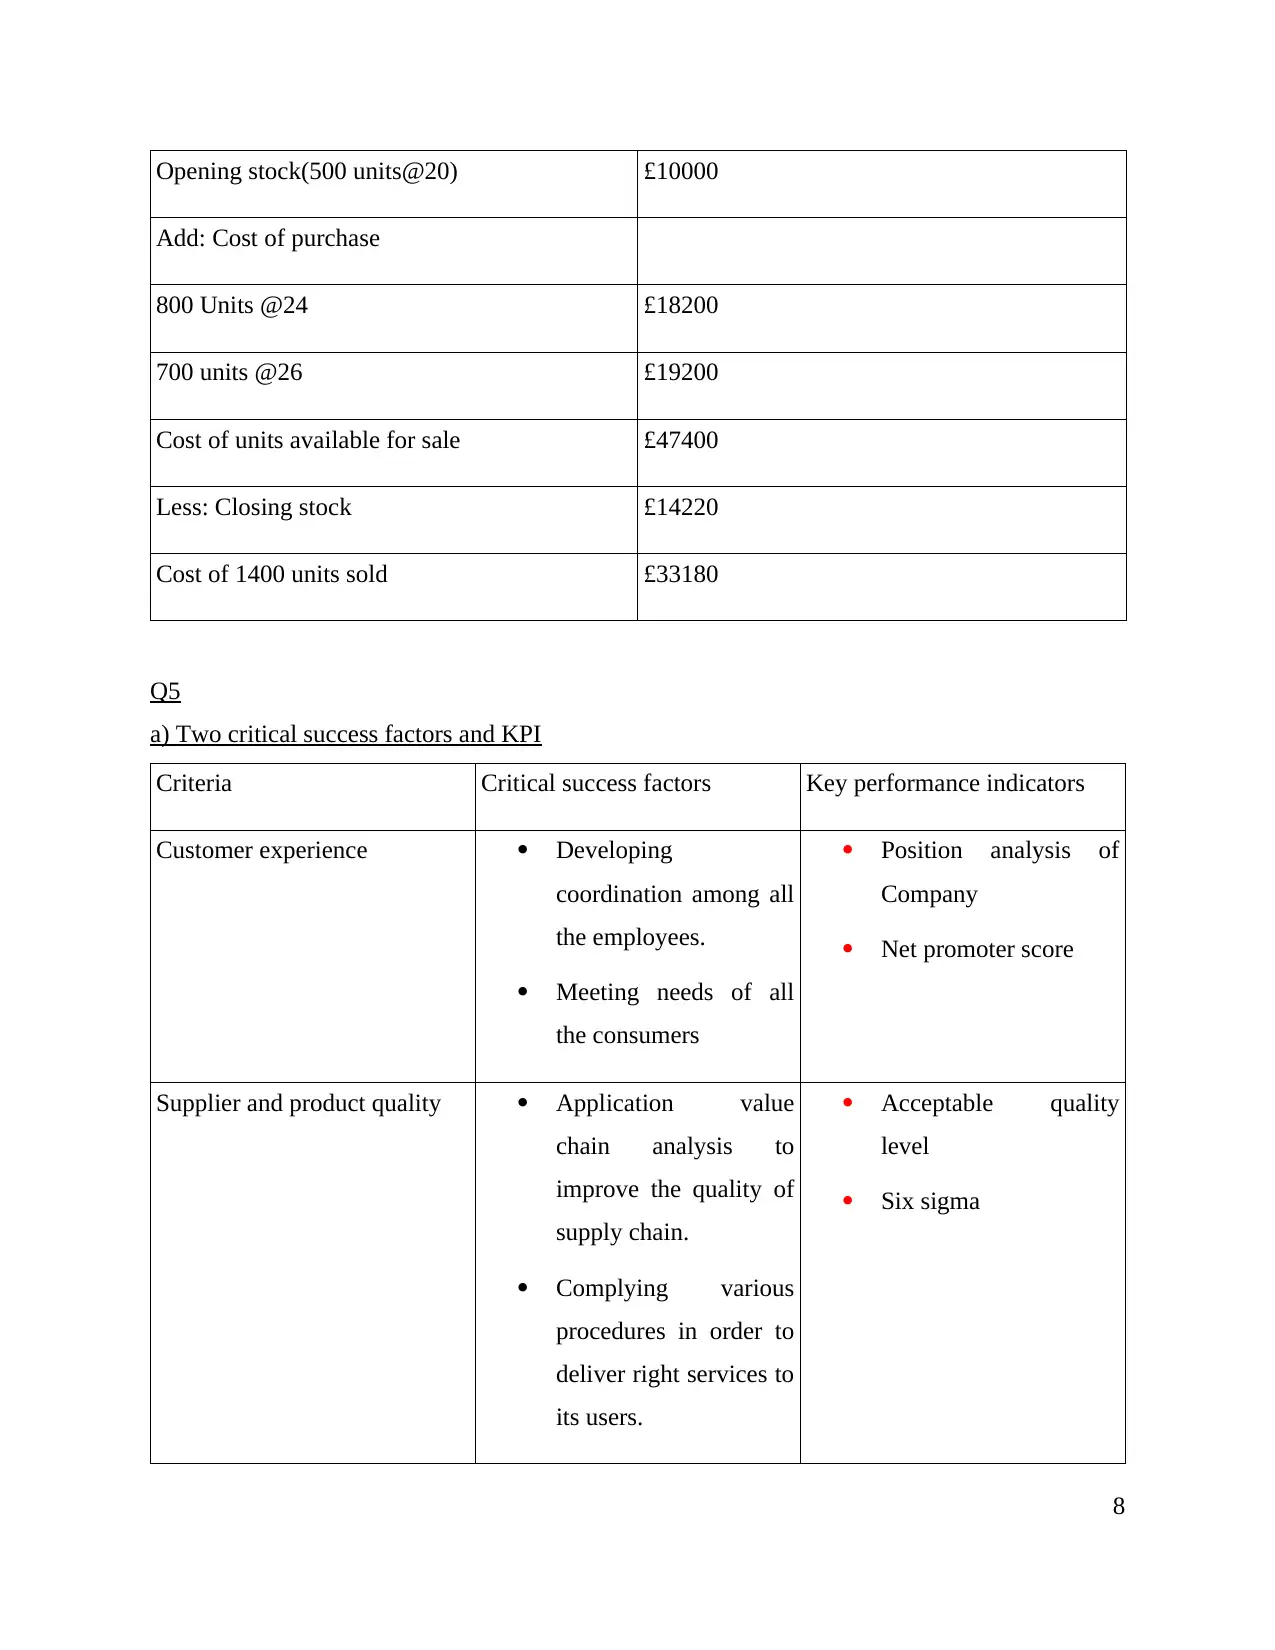
Opening stock(500 units@20) £10000
Add: Cost of purchase
800 Units @24 £18200
700 units @26 £19200
Cost of units available for sale £47400
Less: Closing stock £14220
Cost of 1400 units sold £33180
Q5
a) Two critical success factors and KPI
Criteria Critical success factors Key performance indicators
Customer experience Developing
coordination among all
the employees.
Meeting needs of all
the consumers
Position analysis of
Company
Net promoter score
Supplier and product quality Application value
chain analysis to
improve the quality of
supply chain.
Complying various
procedures in order to
deliver right services to
its users.
Acceptable quality
level
Six sigma
8
⊘ This is a preview!⊘
Do you want full access?
Subscribe today to unlock all pages.
Trusted by 1+ million students worldwide
1 out of 22
Related Documents


Your All-in-One AI-Powered Toolkit for Academic Success.
+13062052269
info@desklib.com
Available 24*7 on WhatsApp / Email
![[object Object]](/_next/static/media/star-bottom.7253800d.svg)
Unlock your academic potential
Copyright © 2020–2026 A2Z Services. All Rights Reserved. Developed and managed by ZUCOL.