Management Accounting & Control Assessment Report - LK Ltd & Kadlex
VerifiedAdded on 2021/02/21
|18
|5618
|29
Report
AI Summary
This report provides a comprehensive analysis of management accounting and control assessments, focusing on two key scenarios involving LK Ltd and Kadlex Consultancy. The first scenario delves into LK Ltd's production planning, profit and loss statements, and the evaluation of cost reduction techniques such as Economic Order Quantity, Margin of Safety, and Just-in-Time systems. It also explores the use of a Balanced Scorecard for cost control. The second scenario shifts to Kadlex Consultancy, evaluating investment decisions and the benefits and limitations of investment appraisal measures. It culminates in the preparation of a Balanced Scorecard to address short-term financial performance concerns. The report incorporates various accounting methods and tools to assess cost control, production efficiency, and financial performance, offering valuable insights into optimizing business operations and maximizing profitability. The document also discusses ad hoc analysis for cost reduction and the implementation of ABC analysis and safety stocks to optimize inventory management and cost control.

Management Accounting &
Control Assessment
Control Assessment
Paraphrase This Document
Need a fresh take? Get an instant paraphrase of this document with our AI Paraphraser
Table of Contents
INTRODUCTION................................................................................................................................3
Scenario 1.............................................................................................................................................3
(a) Calculation of production plan and profit and loss statement for LK Ltd.................................3
(b) Evaluation of adopting Economic Order Quantity, Margin- of- safety and Just- in- Time in
cost reduction by LK Ltd.................................................................................................................4
(c) Using Balanced Scorecard evaluating the areas where cost can be controlled..........................5
Scenario 2.............................................................................................................................................7
(a) Evaluation of best Investment Decision to be selected for Kadlex Consultancy from available
alternatives.......................................................................................................................................7
(b) Evaluating the benefits and limitations of measures used in selection of Investment
Appraisals by kadlex Consultancy Ltd..........................................................................................10
(c) Preparation of Balanced Scorecard for short- term Financial Performance by Kadlex
Consultancy for reduction of short- term orientation....................................................................12
CONCLUSION..................................................................................................................................12
REFERENCES...................................................................................................................................14
INTRODUCTION
Management Accounting can be defined as the accounting used for identifying, analysing,
measuring, interpretation and recording to preparation of Financial Statements. Accounting
considers all the monetary transactions to be recorder in the books of account. It also deals with
other accounting methods such as Cost accounting, financial accounting etc. Control Assessment
helps in controlling of various extra costs allocated in different departments of company.
Management Accounting helps in preparation of books of accounts (Management Accounting and
Control Assessment, 2019). This books of accounts help in analysing the various loopholes in
company and where company can control extra cost allocation. Im this manner, management
accounting helps in controlling and assessing cost in LK Ltd. Lazy King Ltd is a company who
wants to maximize its profits by preparing proper production plan for the company. Company wants
to prepare such production plan which helps company in achieving their targets and maximizing
company's profits. The report covers profit or loss statement and production plan for four goods
which are produced by company in order to maximize profits of company. Company wants to also
know Economic order quantity, Margin of safety and Just- in- time system in order to know
minimum requirement of raw material for completing maximum demands of company. LK Ltd also
uses Balanced Score Card in order to make decisions on how to control extra cost in company. LK
Ltd sells its company to Kadlex Consultancy in order to earn higher profits. Kadlex Consultancy
uses divisional method for running its business.
Scenario 1
(a) Calculation of production plan and profit and loss statement for LK Ltd
Production Plan can be defined as the process which starts from purchasing raw material to
converting them into finished goods (Becher, and et.al., 2018). This process helps in knowing the
cost of production and manufacturing cost. It helps in preparing the optimum level of different types
of products portfolio so as to earn higher profits as compared to the past performance.
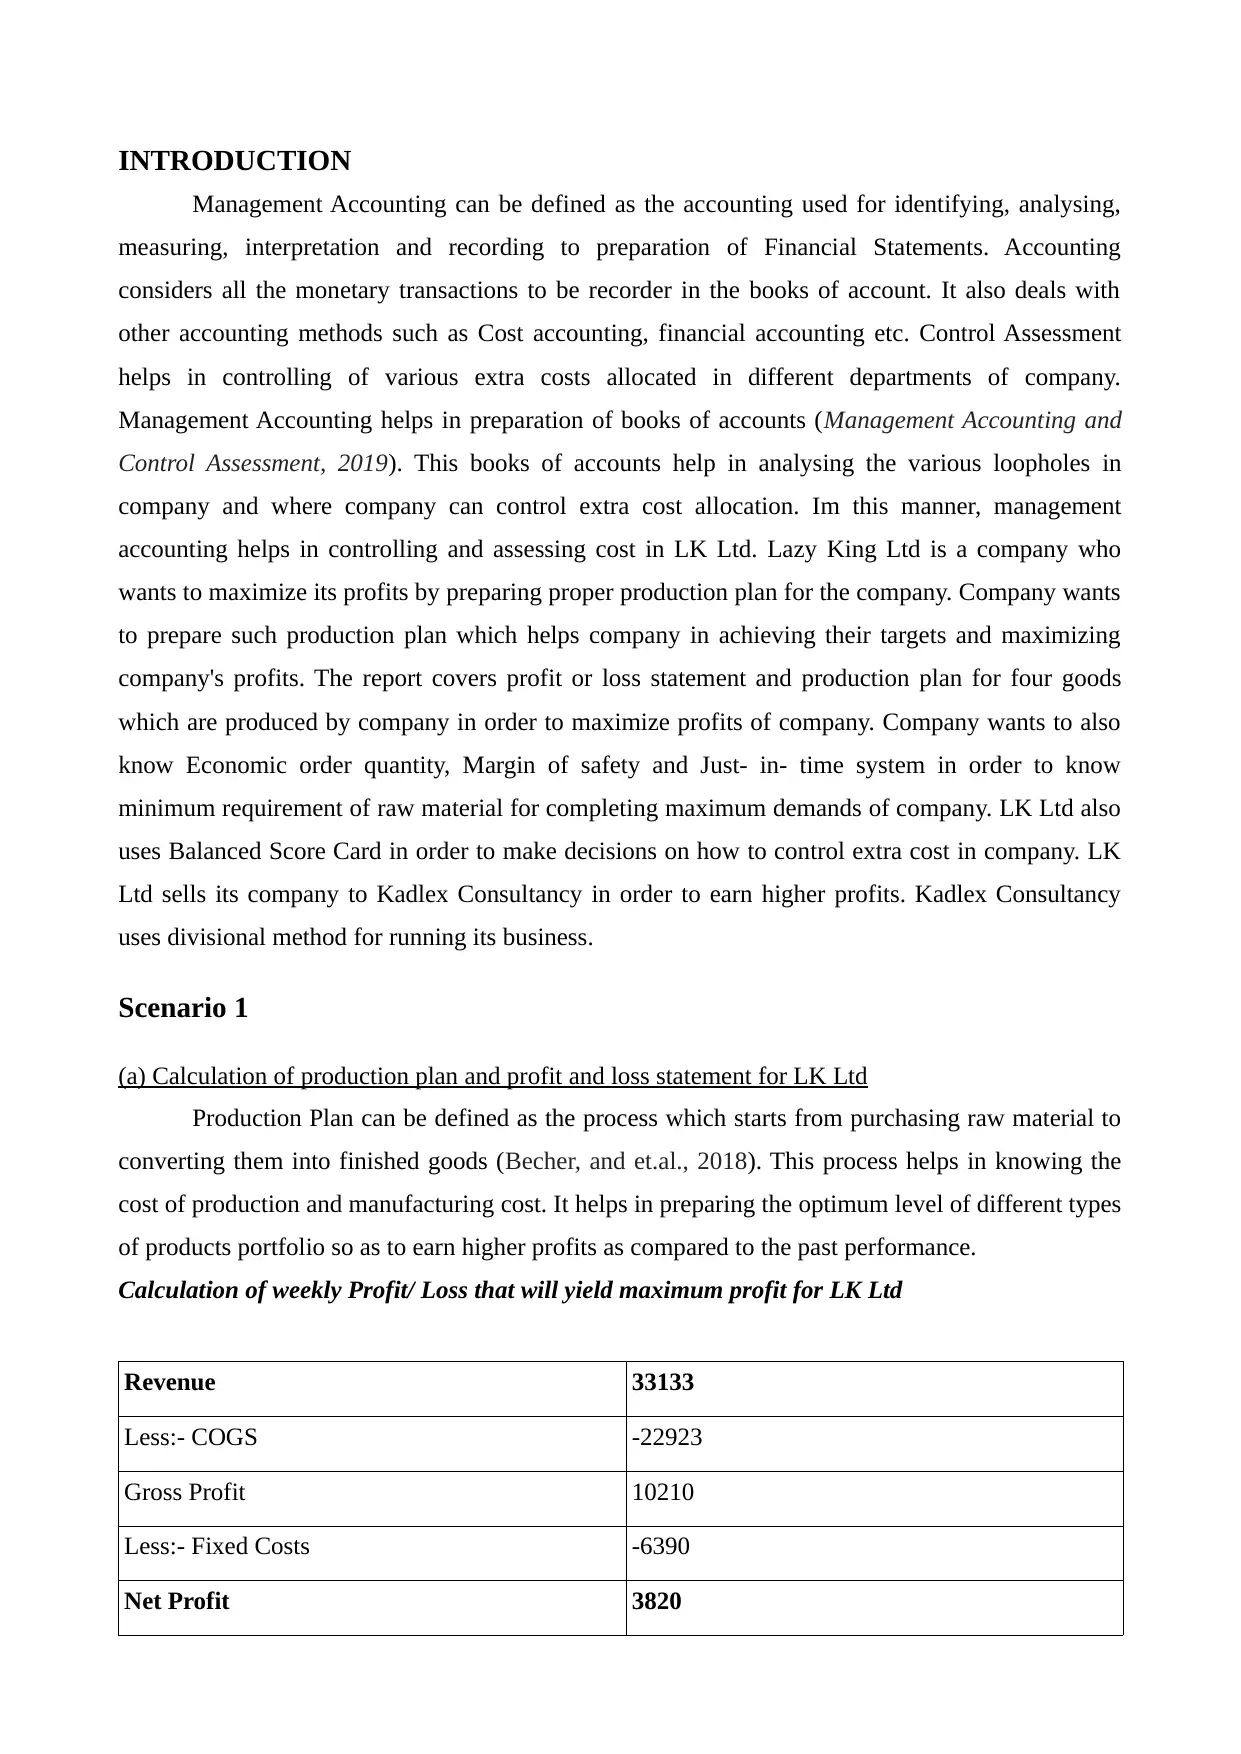
Calculation of weekly Profit/ Loss that will yield maximum profit for LK Ltd
Revenue 33133
Less:- COGS -22923
Gross Profit 10210
Less:- Fixed Costs -6390
Net Profit 3820
Management Accounting can be defined as the accounting used for identifying, analysing,
measuring, interpretation and recording to preparation of Financial Statements. Accounting
considers all the monetary transactions to be recorder in the books of account. It also deals with
other accounting methods such as Cost accounting, financial accounting etc. Control Assessment
helps in controlling of various extra costs allocated in different departments of company.
Management Accounting helps in preparation of books of accounts (Management Accounting and
Control Assessment, 2019). This books of accounts help in analysing the various loopholes in
company and where company can control extra cost allocation. Im this manner, management
accounting helps in controlling and assessing cost in LK Ltd. Lazy King Ltd is a company who
wants to maximize its profits by preparing proper production plan for the company. Company wants
to prepare such production plan which helps company in achieving their targets and maximizing
company's profits. The report covers profit or loss statement and production plan for four goods
which are produced by company in order to maximize profits of company. Company wants to also
know Economic order quantity, Margin of safety and Just- in- time system in order to know
minimum requirement of raw material for completing maximum demands of company. LK Ltd also
uses Balanced Score Card in order to make decisions on how to control extra cost in company. LK
Ltd sells its company to Kadlex Consultancy in order to earn higher profits. Kadlex Consultancy
uses divisional method for running its business.
Scenario 1
(a) Calculation of production plan and profit and loss statement for LK Ltd
Production Plan can be defined as the process which starts from purchasing raw material to
converting them into finished goods (Becher, and et.al., 2018). This process helps in knowing the
cost of production and manufacturing cost. It helps in preparing the optimum level of different types
of products portfolio so as to earn higher profits as compared to the past performance.
Calculation of weekly Profit/ Loss that will yield maximum profit for LK Ltd
Revenue 33133
Less:- COGS -22923
Gross Profit 10210
Less:- Fixed Costs -6390
Net Profit 3820
⊘ This is a preview!⊘
Do you want full access?
Subscribe today to unlock all pages.
Trusted by 1+ million students worldwide
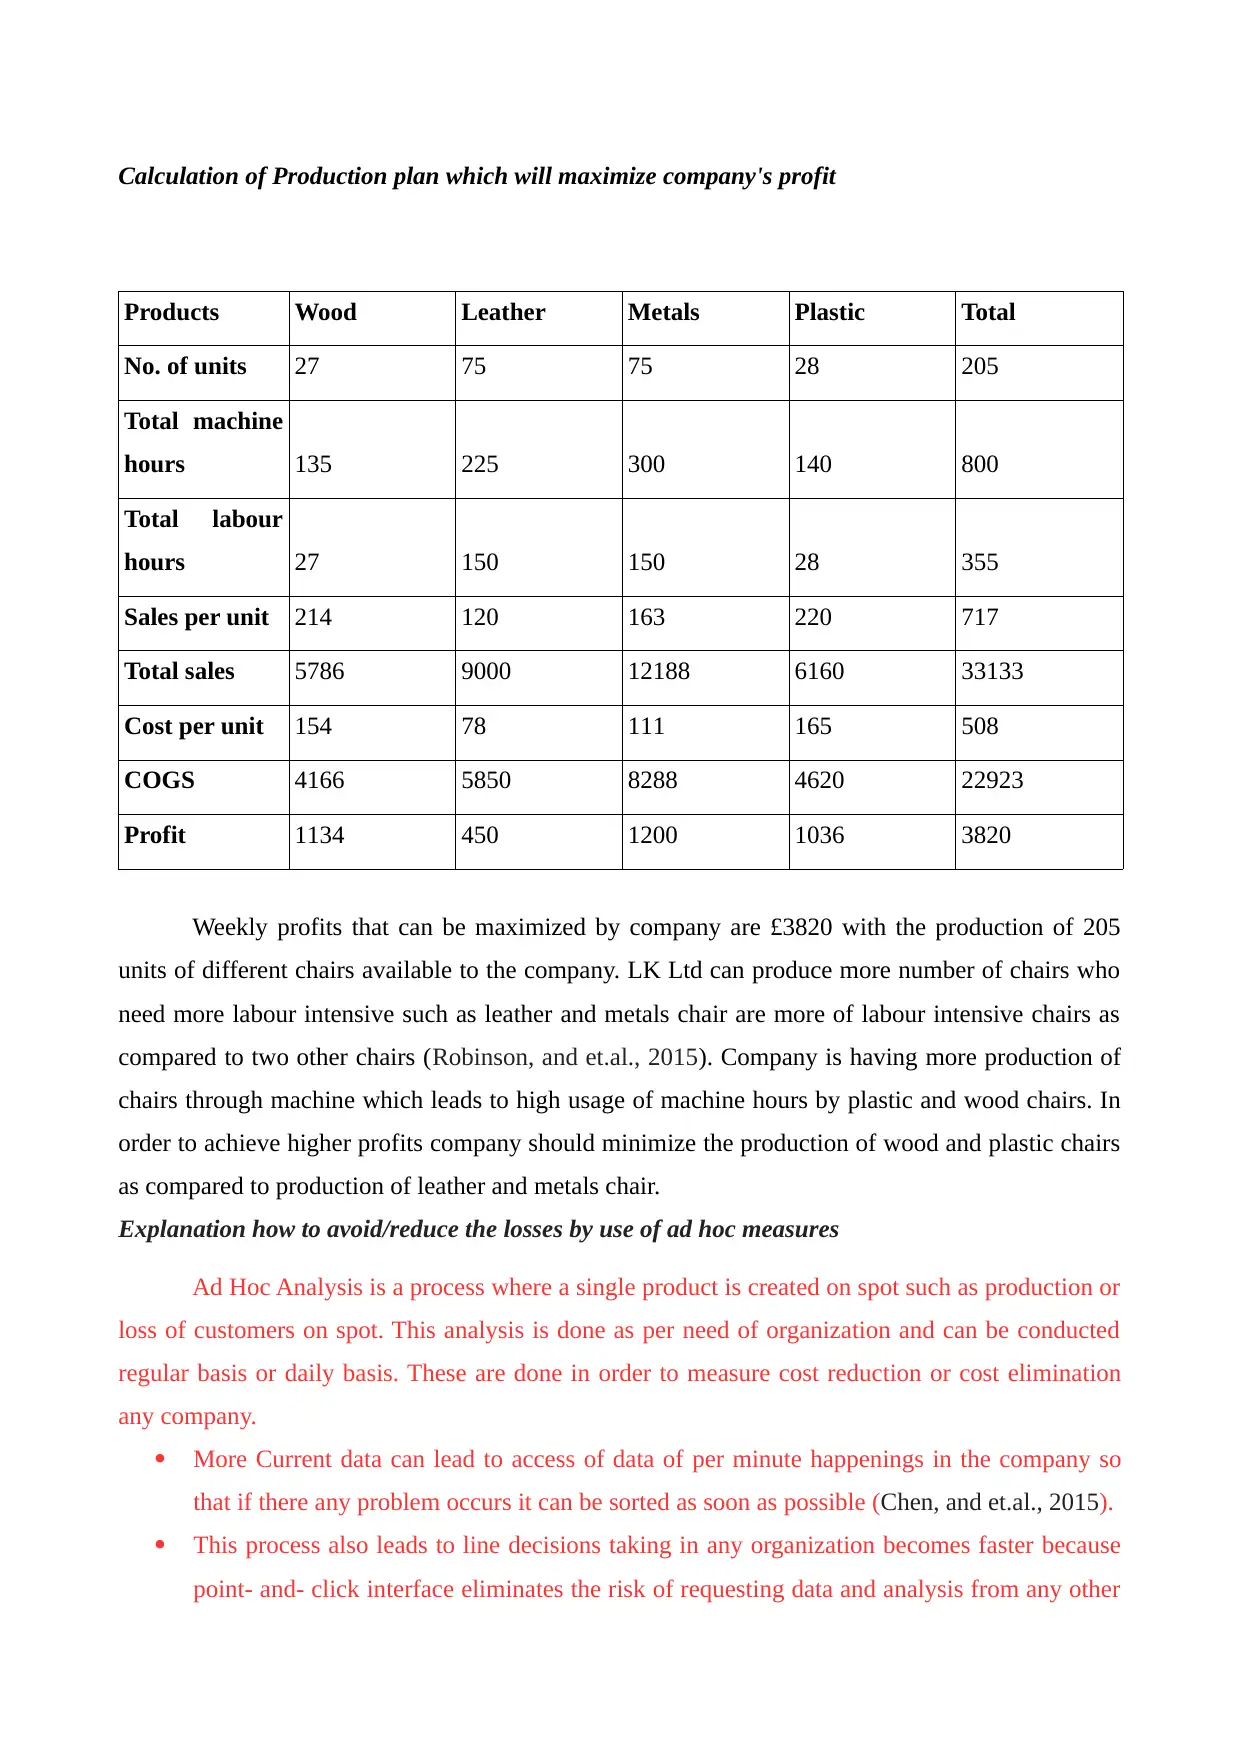
Calculation of Production plan which will maximize company's profit
Products Wood Leather Metals Plastic Total
No. of units 27 75 75 28 205
Total machine
hours 135 225 300 140 800
Total labour
hours 27 150 150 28 355
Sales per unit 214 120 163 220 717
Total sales 5786 9000 12188 6160 33133
Cost per unit 154 78 111 165 508
COGS 4166 5850 8288 4620 22923
Profit 1134 450 1200 1036 3820
Weekly profits that can be maximized by company are £3820 with the production of 205
units of different chairs available to the company. LK Ltd can produce more number of chairs who
need more labour intensive such as leather and metals chair are more of labour intensive chairs as
compared to two other chairs (Robinson, and et.al., 2015). Company is having more production of
chairs through machine which leads to high usage of machine hours by plastic and wood chairs. In
order to achieve higher profits company should minimize the production of wood and plastic chairs
as compared to production of leather and metals chair.
Explanation how to avoid/reduce the losses by use of ad hoc measures
Ad Hoc Analysis is a process where a single product is created on spot such as production or
loss of customers on spot. This analysis is done as per need of organization and can be conducted
regular basis or daily basis. These are done in order to measure cost reduction or cost elimination
any company.
More Current data can lead to access of data of per minute happenings in the company so
that if there any problem occurs it can be sorted as soon as possible (Chen, and et.al., 2015).
This process also leads to line decisions taking in any organization becomes faster because
point- and- click interface eliminates the risk of requesting data and analysis from any other
Paraphrase This Document
Need a fresh take? Get an instant paraphrase of this document with our AI Paraphraser
group in within that company. This capacity helps in quicker response times when business
decisions are to be taken.
Ad Hoc also help IT users to run their own queries in organization than it leads IT team to
fewer create reports and can easily focus on other tasks (Balaji, 2019).
(b) Evaluation of adopting Economic Order Quantity, Margin- of- safety and Just- in- Time in cost
reduction by LK Ltd
Economic Order Quantity can be defined as in how many time company has to order goods
from its suppliers keeping in context of cost of production, demand rate by the competitors and
other suitable variables (Bian, and et.al., 2017). This method helps the company in controlling the
cost of company by evaluating that how much quantity should be purchased by company so that
their will be no problem of order in future. The main aim of this method is to minimize its cost of
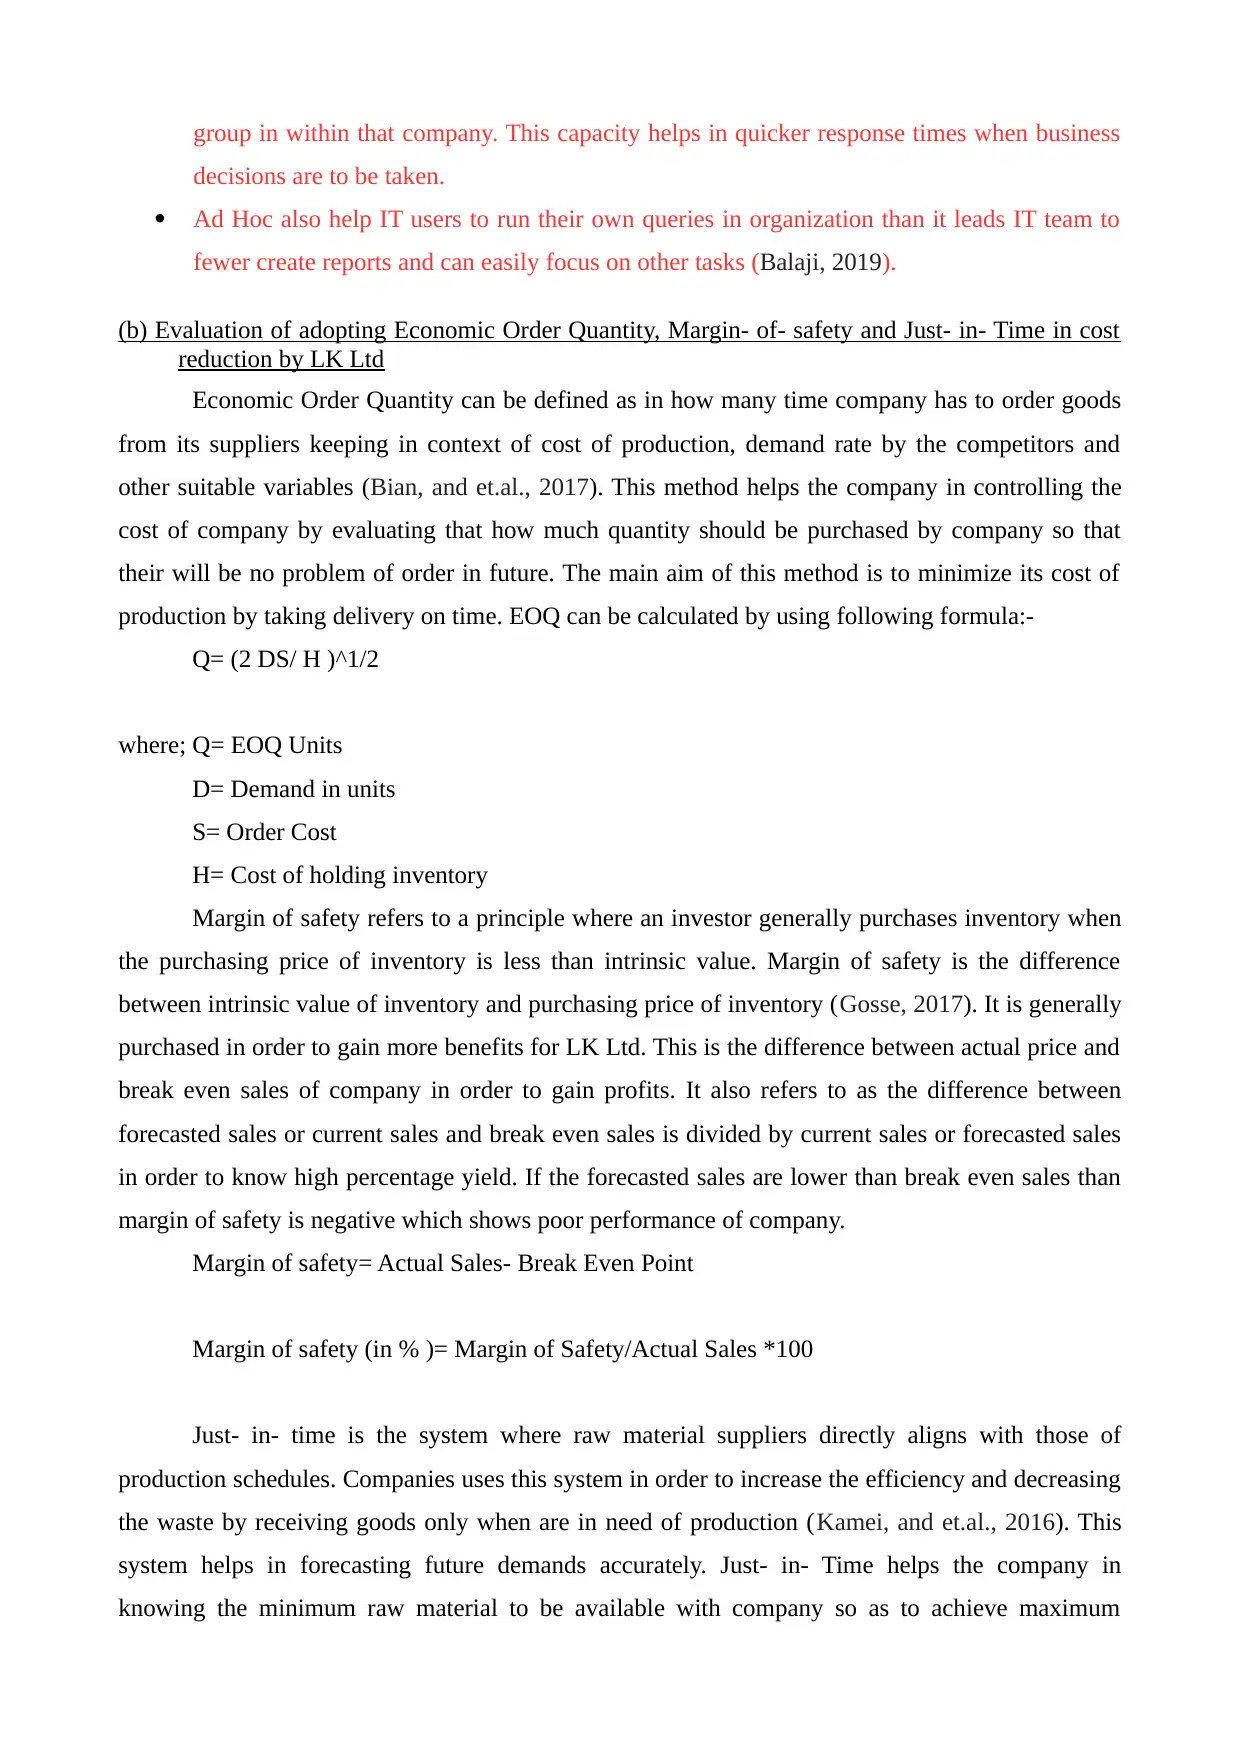
production by taking delivery on time. EOQ can be calculated by using following formula:-
Q= (2 DS/ H )^1/2
where; Q= EOQ Units
D= Demand in units
S= Order Cost
H= Cost of holding inventory
Margin of safety refers to a principle where an investor generally purchases inventory when
the purchasing price of inventory is less than intrinsic value. Margin of safety is the difference
between intrinsic value of inventory and purchasing price of inventory (Gosse, 2017). It is generally
purchased in order to gain more benefits for LK Ltd. This is the difference between actual price and
break even sales of company in order to gain profits. It also refers to as the difference between
forecasted sales or current sales and break even sales is divided by current sales or forecasted sales
in order to know high percentage yield. If the forecasted sales are lower than break even sales than
margin of safety is negative which shows poor performance of company.
Margin of safety= Actual Sales- Break Even Point
Margin of safety (in % )= Margin of Safety/Actual Sales *100
Just- in- time is the system where raw material suppliers directly aligns with those of
production schedules. Companies uses this system in order to increase the efficiency and decreasing
the waste by receiving goods only when are in need of production (Kamei, and et.al., 2016). This
system helps in forecasting future demands accurately. Just- in- Time helps the company in
knowing the minimum raw material to be available with company so as to achieve maximum
decisions are to be taken.
Ad Hoc also help IT users to run their own queries in organization than it leads IT team to
fewer create reports and can easily focus on other tasks (Balaji, 2019).
(b) Evaluation of adopting Economic Order Quantity, Margin- of- safety and Just- in- Time in cost
reduction by LK Ltd
Economic Order Quantity can be defined as in how many time company has to order goods
from its suppliers keeping in context of cost of production, demand rate by the competitors and
other suitable variables (Bian, and et.al., 2017). This method helps the company in controlling the
cost of company by evaluating that how much quantity should be purchased by company so that
their will be no problem of order in future. The main aim of this method is to minimize its cost of
production by taking delivery on time. EOQ can be calculated by using following formula:-
Q= (2 DS/ H )^1/2
where; Q= EOQ Units
D= Demand in units
S= Order Cost
H= Cost of holding inventory
Margin of safety refers to a principle where an investor generally purchases inventory when
the purchasing price of inventory is less than intrinsic value. Margin of safety is the difference
between intrinsic value of inventory and purchasing price of inventory (Gosse, 2017). It is generally
purchased in order to gain more benefits for LK Ltd. This is the difference between actual price and
break even sales of company in order to gain profits. It also refers to as the difference between
forecasted sales or current sales and break even sales is divided by current sales or forecasted sales
in order to know high percentage yield. If the forecasted sales are lower than break even sales than
margin of safety is negative which shows poor performance of company.
Margin of safety= Actual Sales- Break Even Point
Margin of safety (in % )= Margin of Safety/Actual Sales *100
Just- in- time is the system where raw material suppliers directly aligns with those of
production schedules. Companies uses this system in order to increase the efficiency and decreasing
the waste by receiving goods only when are in need of production (Kamei, and et.al., 2016). This
system helps in forecasting future demands accurately. Just- in- Time helps the company in
knowing the minimum raw material to be available with company so as to achieve maximum
market demand by LK Ltd. It helps company in increasing high- quality products, no beak down
machines and reliable suppliers.
ABC is the method which can be also in cost reduction in any organization. In this “A items”
refers to very tight and there is accurate recording of inventory, “B items” are with very less tightly
controlled and good records are maintained of inventory and “C items” are very less tighten in
company and with very minimum records are kept of these items. ABC analysis is the method in
which overall inventory cost has been defined and requires different inventory controls in any
organization (Kumar, 2015). “A items” are very important to be kept in any organization. It is also
estimated that 'A items' covers 20% of inventory charges for 70% of annual consumption, 'B items'
covers 30% of total inventory charges 25% of annual consumption and 'C items' covers 50% of
inventory charges 5% of annual consumption.
Safety stocks can be defined as an additional quantity required in order to minimise risks in
an organization. This inventory helps at the time when there is huge sale occurring in company
because of which huge production occurs which needs raw material in company (Albrecht, 2017). If
any manufacturer properly maintains safety stocks in any company than it can avoid risk of
production. In this way safety stocks can help company in production of extra products at time of
extra sales.
All these factors will be helping LK Ltd in cost reduction because these factors help
company in knowing what quantity are to be purchased, in what time period inventory is to be
purchased. The other factors which are also present in cost reduction of company by knowing the
actual sales of company and break even sales of company. If company comes to know about the
minimum order quantity to complete the maximum demand of LK Ltd will be helping company in
cost elimination. Just- in- Time also help decrease in break down of machines which helps the
company in decreasing their cost. Margin safety helps in increasing profits of company by
purchasing raw material at the difference between forecasted sales and actual sale of company. In
this manner, all these above mentioned factors help LK Ltd in cost reduction or cost elimination of
company.
(c) Using Balanced Scorecard evaluating the areas where cost can be controlled
Balance Scorecard is prepared on the basis of four perspectives i.e. Financial Perspective,
International Business Perspectives, Customer Perspectives and Innovation & Learning Perspective.
Balance Scorecard is prepared to know the standard set for organization and these are to be
achieved by management in all perspectives. These are prepared on the past performance of
company for current year's performance. Financial Perspectives are used to know that company is
achieving its standard targets or not. This helps in comparison between actual performance of
⊘ This is a preview!⊘
Do you want full access?
Subscribe today to unlock all pages.
Trusted by 1+ million students worldwide
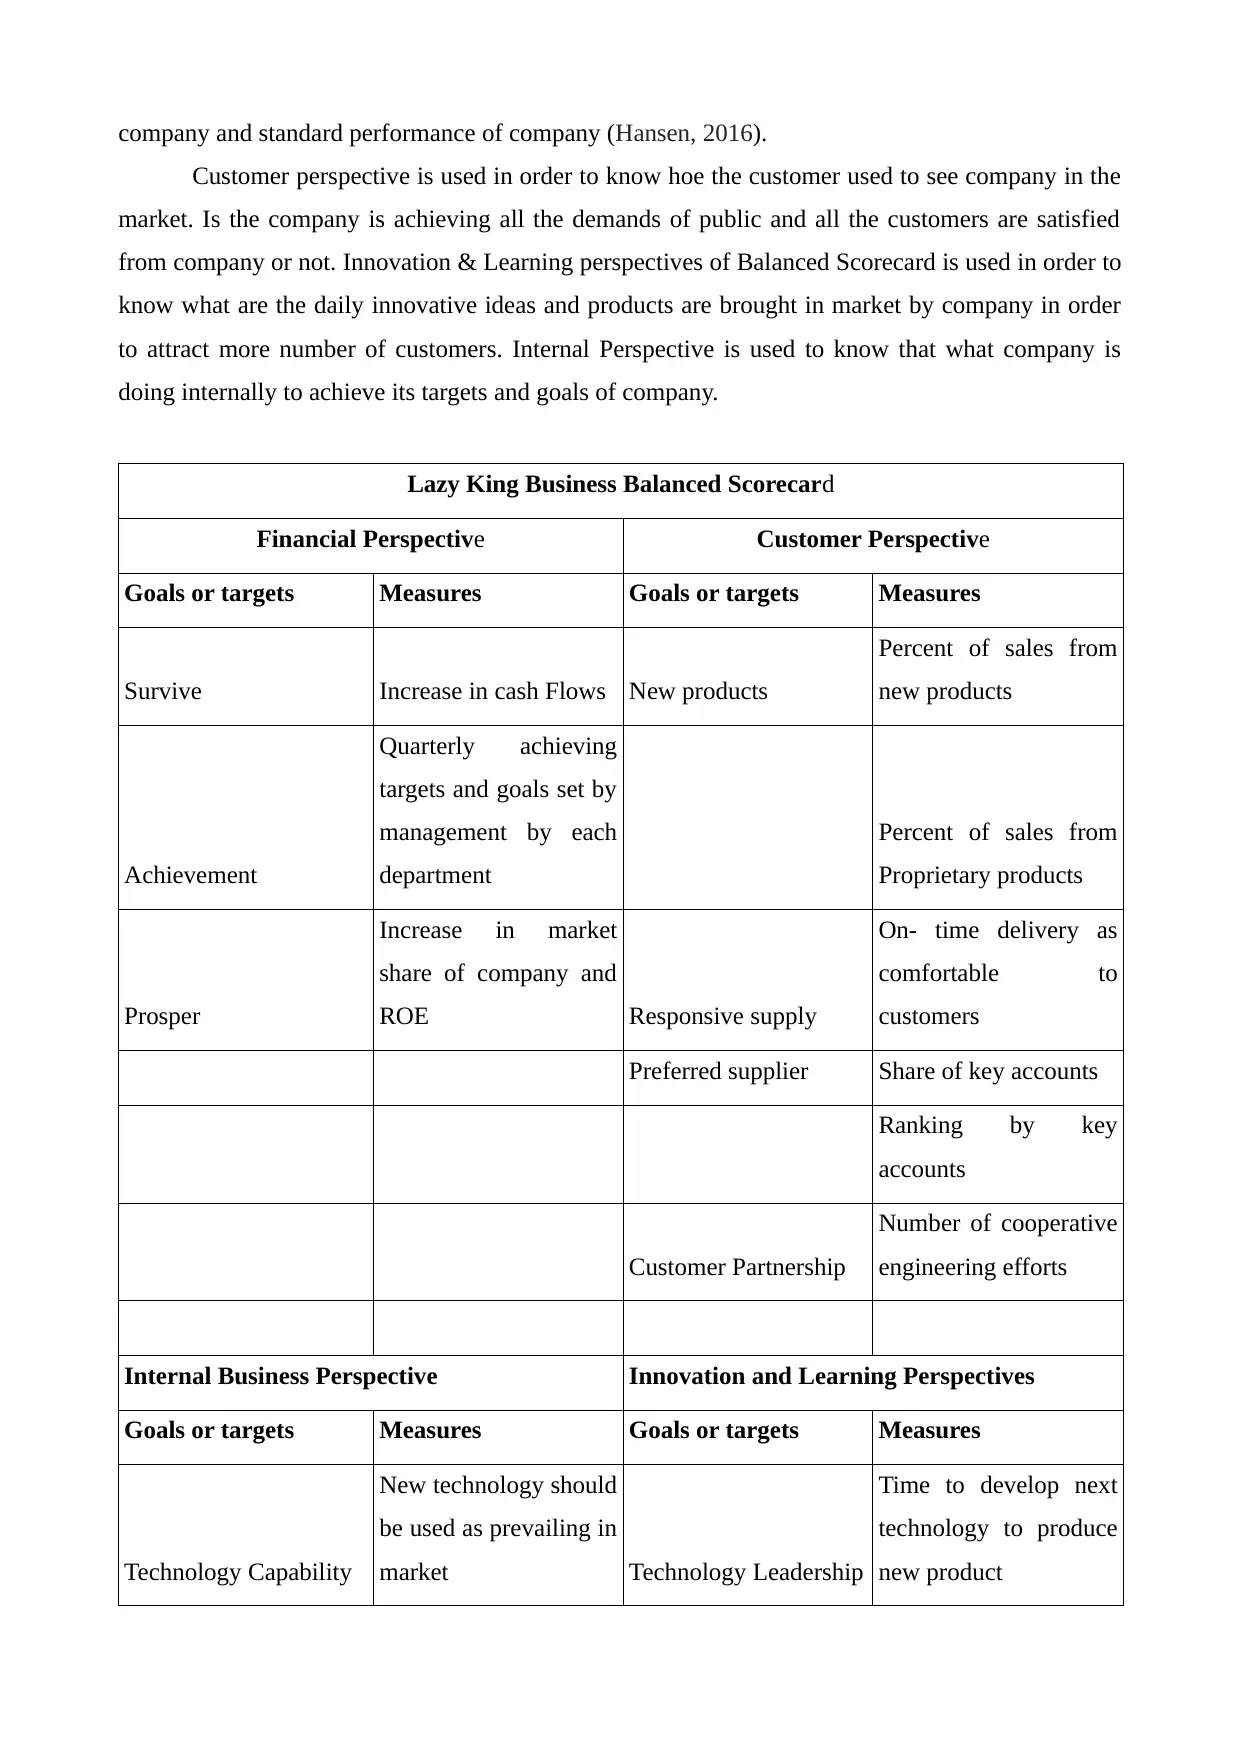
company and standard performance of company (Hansen, 2016).
Customer perspective is used in order to know hoe the customer used to see company in the
market. Is the company is achieving all the demands of public and all the customers are satisfied
from company or not. Innovation & Learning perspectives of Balanced Scorecard is used in order to
know what are the daily innovative ideas and products are brought in market by company in order
to attract more number of customers. Internal Perspective is used to know that what company is
doing internally to achieve its targets and goals of company.
Lazy King Business Balanced Scorecard
Financial Perspective Customer Perspective
Goals or targets Measures Goals or targets Measures
Survive Increase in cash Flows New products
Percent of sales from
new products
Achievement
Quarterly achieving
targets and goals set by
management by each
department
Percent of sales from
Proprietary products
Prosper
Increase in market
share of company and
ROE Responsive supply
On- time delivery as
comfortable to
customers
Preferred supplier Share of key accounts
Ranking by key
accounts
Customer Partnership
Number of cooperative
engineering efforts
Internal Business Perspective Innovation and Learning Perspectives
Goals or targets Measures Goals or targets Measures
Technology Capability
New technology should
be used as prevailing in
market Technology Leadership
Time to develop next
technology to produce
new product
Paraphrase This Document
Need a fresh take? Get an instant paraphrase of this document with our AI Paraphraser
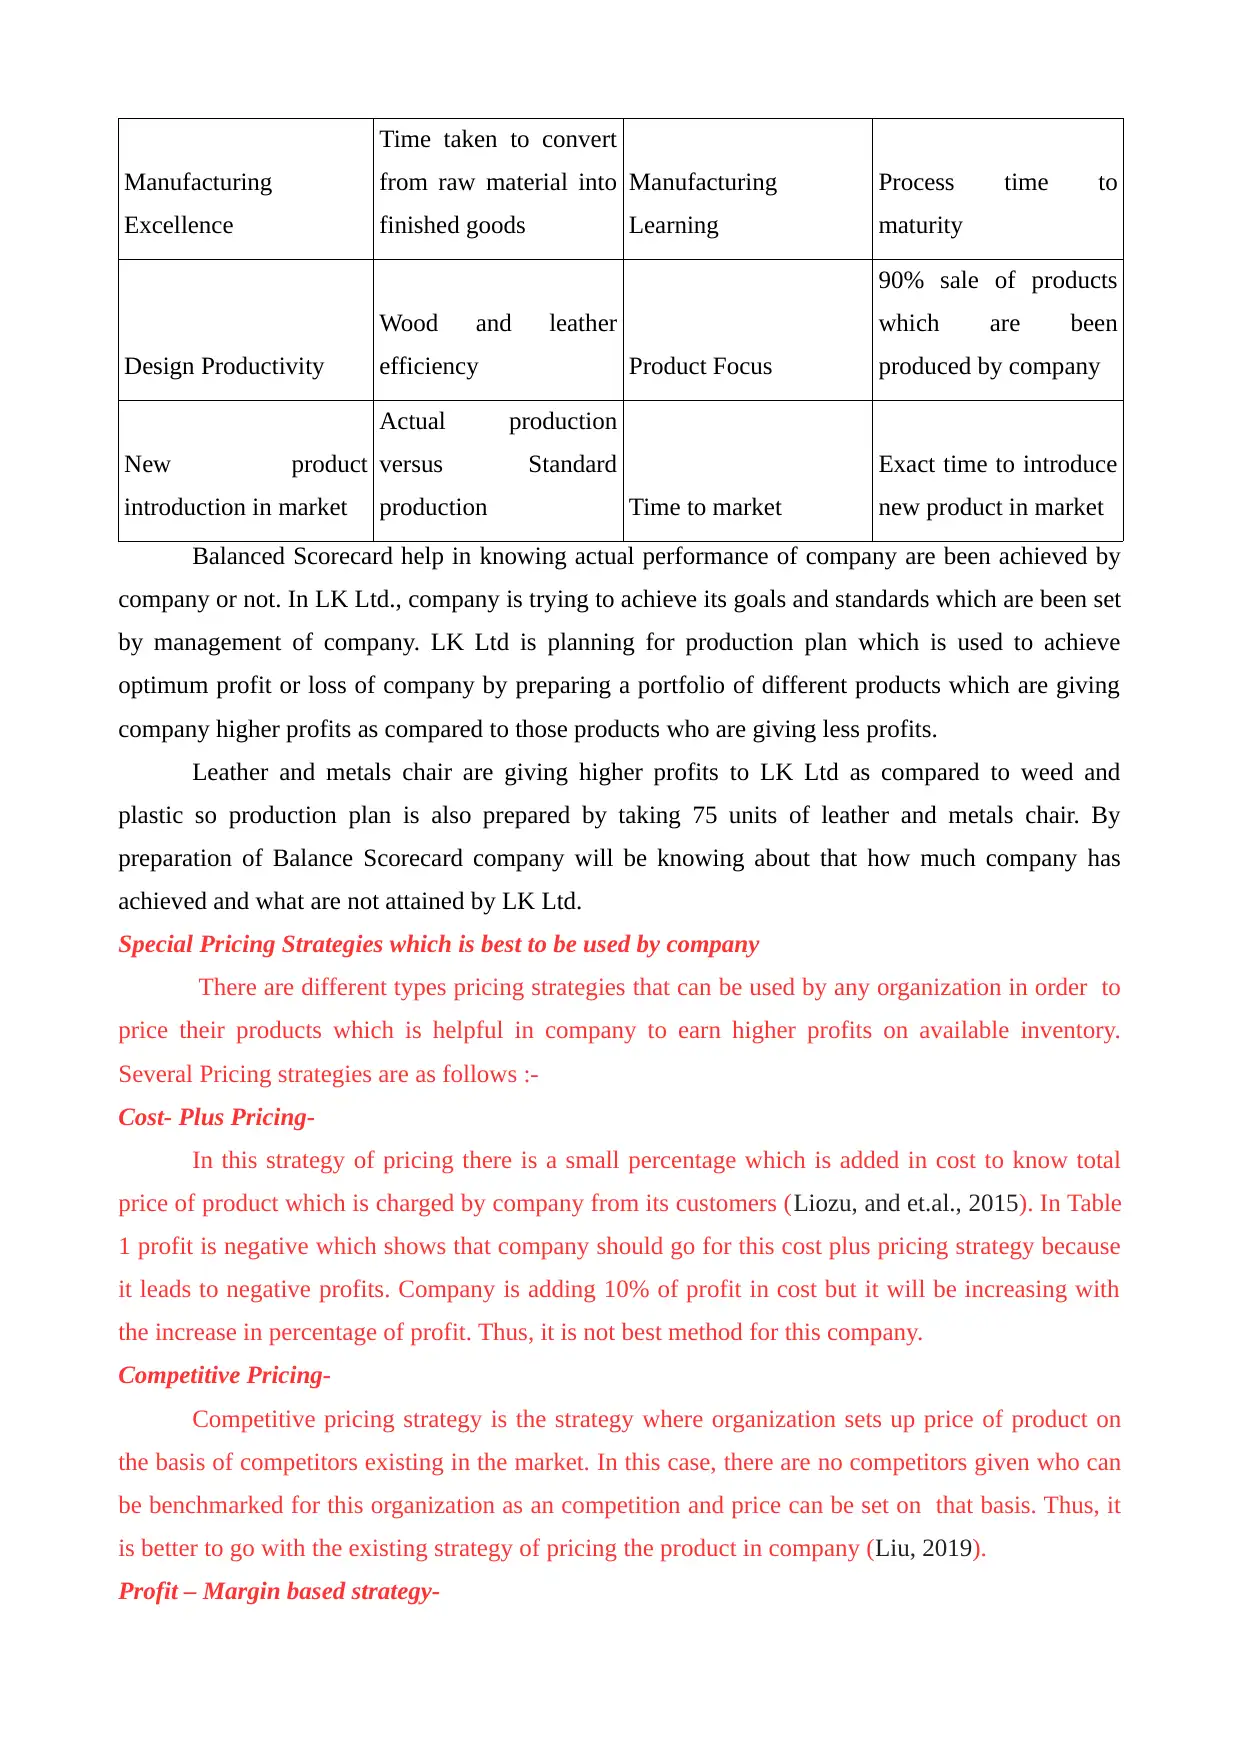
Manufacturing
Excellence
Time taken to convert
from raw material into
finished goods
Manufacturing
Learning
Process time to
maturity
Design Productivity
Wood and leather
efficiency Product Focus
90% sale of products
which are been
produced by company
New product
introduction in market
Actual production
versus Standard
production Time to market
Exact time to introduce
new product in market
Balanced Scorecard help in knowing actual performance of company are been achieved by
company or not. In LK Ltd., company is trying to achieve its goals and standards which are been set
by management of company. LK Ltd is planning for production plan which is used to achieve
optimum profit or loss of company by preparing a portfolio of different products which are giving
company higher profits as compared to those products who are giving less profits.
Leather and metals chair are giving higher profits to LK Ltd as compared to weed and
plastic so production plan is also prepared by taking 75 units of leather and metals chair. By
preparation of Balance Scorecard company will be knowing about that how much company has
achieved and what are not attained by LK Ltd.
Special Pricing Strategies which is best to be used by company
There are different types pricing strategies that can be used by any organization in order to
price their products which is helpful in company to earn higher profits on available inventory.
Several Pricing strategies are as follows :-
Cost- Plus Pricing-
In this strategy of pricing there is a small percentage which is added in cost to know total
price of product which is charged by company from its customers (Liozu, and et.al., 2015). In Table
1 profit is negative which shows that company should go for this cost plus pricing strategy because
it leads to negative profits. Company is adding 10% of profit in cost but it will be increasing with
the increase in percentage of profit. Thus, it is not best method for this company.
Competitive Pricing-
Competitive pricing strategy is the strategy where organization sets up price of product on
the basis of competitors existing in the market. In this case, there are no competitors given who can
be benchmarked for this organization as an competition and price can be set on that basis. Thus, it
is better to go with the existing strategy of pricing the product in company (Liu, 2019).
Profit – Margin based strategy-
In this strategy price is set by keeping some profit margin on sale after deciding sales per
unit. This strategy of pricing is best strategy which any organization can use and also it is easy to
calculate and implement in company. In table 2 profit shown are positive and company should go
for adopting this strategy of pricing the products in its business.
Scenario 2
(a) Evaluation of best Investment Decision to be selected for Kadlex Consultancy from available
alternatives
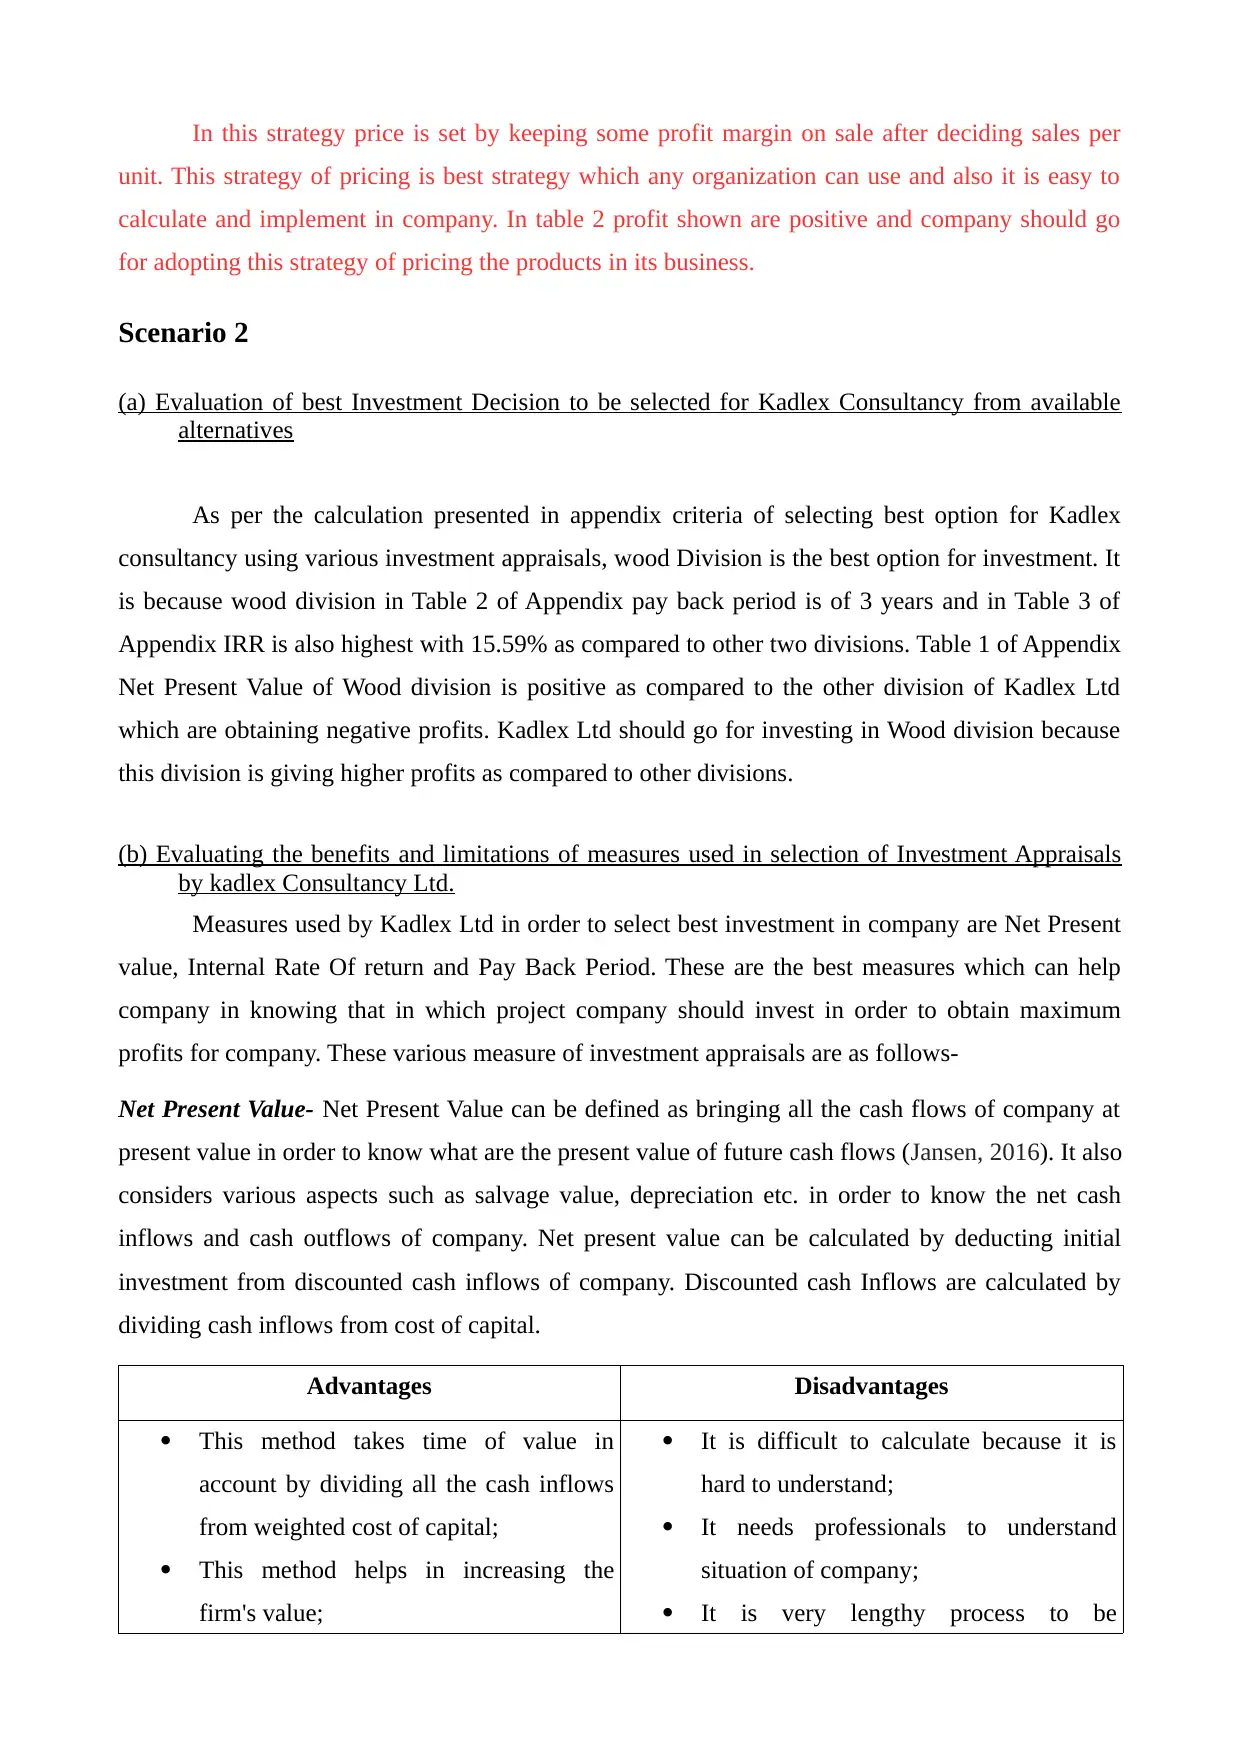
As per the calculation presented in appendix criteria of selecting best option for Kadlex
consultancy using various investment appraisals, wood Division is the best option for investment. It
is because wood division in Table 2 of Appendix pay back period is of 3 years and in Table 3 of
Appendix IRR is also highest with 15.59% as compared to other two divisions. Table 1 of Appendix
Net Present Value of Wood division is positive as compared to the other division of Kadlex Ltd
which are obtaining negative profits. Kadlex Ltd should go for investing in Wood division because
this division is giving higher profits as compared to other divisions.
(b) Evaluating the benefits and limitations of measures used in selection of Investment Appraisals
by kadlex Consultancy Ltd.
Measures used by Kadlex Ltd in order to select best investment in company are Net Present
value, Internal Rate Of return and Pay Back Period. These are the best measures which can help
company in knowing that in which project company should invest in order to obtain maximum
profits for company. These various measure of investment appraisals are as follows-
Net Present Value- Net Present Value can be defined as bringing all the cash flows of company at
present value in order to know what are the present value of future cash flows (Jansen, 2016). It also
considers various aspects such as salvage value, depreciation etc. in order to know the net cash
inflows and cash outflows of company. Net present value can be calculated by deducting initial
investment from discounted cash inflows of company. Discounted cash Inflows are calculated by
dividing cash inflows from cost of capital.
Advantages Disadvantages
This method takes time of value in
account by dividing all the cash inflows
from weighted cost of capital;
This method helps in increasing the
firm's value;
It is difficult to calculate because it is
hard to understand;
It needs professionals to understand
situation of company;
It is very lengthy process to be
unit. This strategy of pricing is best strategy which any organization can use and also it is easy to
calculate and implement in company. In table 2 profit shown are positive and company should go
for adopting this strategy of pricing the products in its business.
Scenario 2
(a) Evaluation of best Investment Decision to be selected for Kadlex Consultancy from available
alternatives
As per the calculation presented in appendix criteria of selecting best option for Kadlex
consultancy using various investment appraisals, wood Division is the best option for investment. It
is because wood division in Table 2 of Appendix pay back period is of 3 years and in Table 3 of
Appendix IRR is also highest with 15.59% as compared to other two divisions. Table 1 of Appendix
Net Present Value of Wood division is positive as compared to the other division of Kadlex Ltd
which are obtaining negative profits. Kadlex Ltd should go for investing in Wood division because
this division is giving higher profits as compared to other divisions.
(b) Evaluating the benefits and limitations of measures used in selection of Investment Appraisals
by kadlex Consultancy Ltd.
Measures used by Kadlex Ltd in order to select best investment in company are Net Present
value, Internal Rate Of return and Pay Back Period. These are the best measures which can help
company in knowing that in which project company should invest in order to obtain maximum
profits for company. These various measure of investment appraisals are as follows-
Net Present Value- Net Present Value can be defined as bringing all the cash flows of company at
present value in order to know what are the present value of future cash flows (Jansen, 2016). It also
considers various aspects such as salvage value, depreciation etc. in order to know the net cash
inflows and cash outflows of company. Net present value can be calculated by deducting initial
investment from discounted cash inflows of company. Discounted cash Inflows are calculated by
dividing cash inflows from cost of capital.
Advantages Disadvantages
This method takes time of value in
account by dividing all the cash inflows
from weighted cost of capital;
This method helps in increasing the
firm's value;
It is difficult to calculate because it is
hard to understand;
It needs professionals to understand
situation of company;
It is very lengthy process to be
⊘ This is a preview!⊘
Do you want full access?
Subscribe today to unlock all pages.
Trusted by 1+ million students worldwide
Profitability and risk associated with
those profits are given highest priority;
Both cash flows after and before are
taken into account over the span of life.
implemented in company;
It is very difficult to calculate appropriate
discount rate for company.
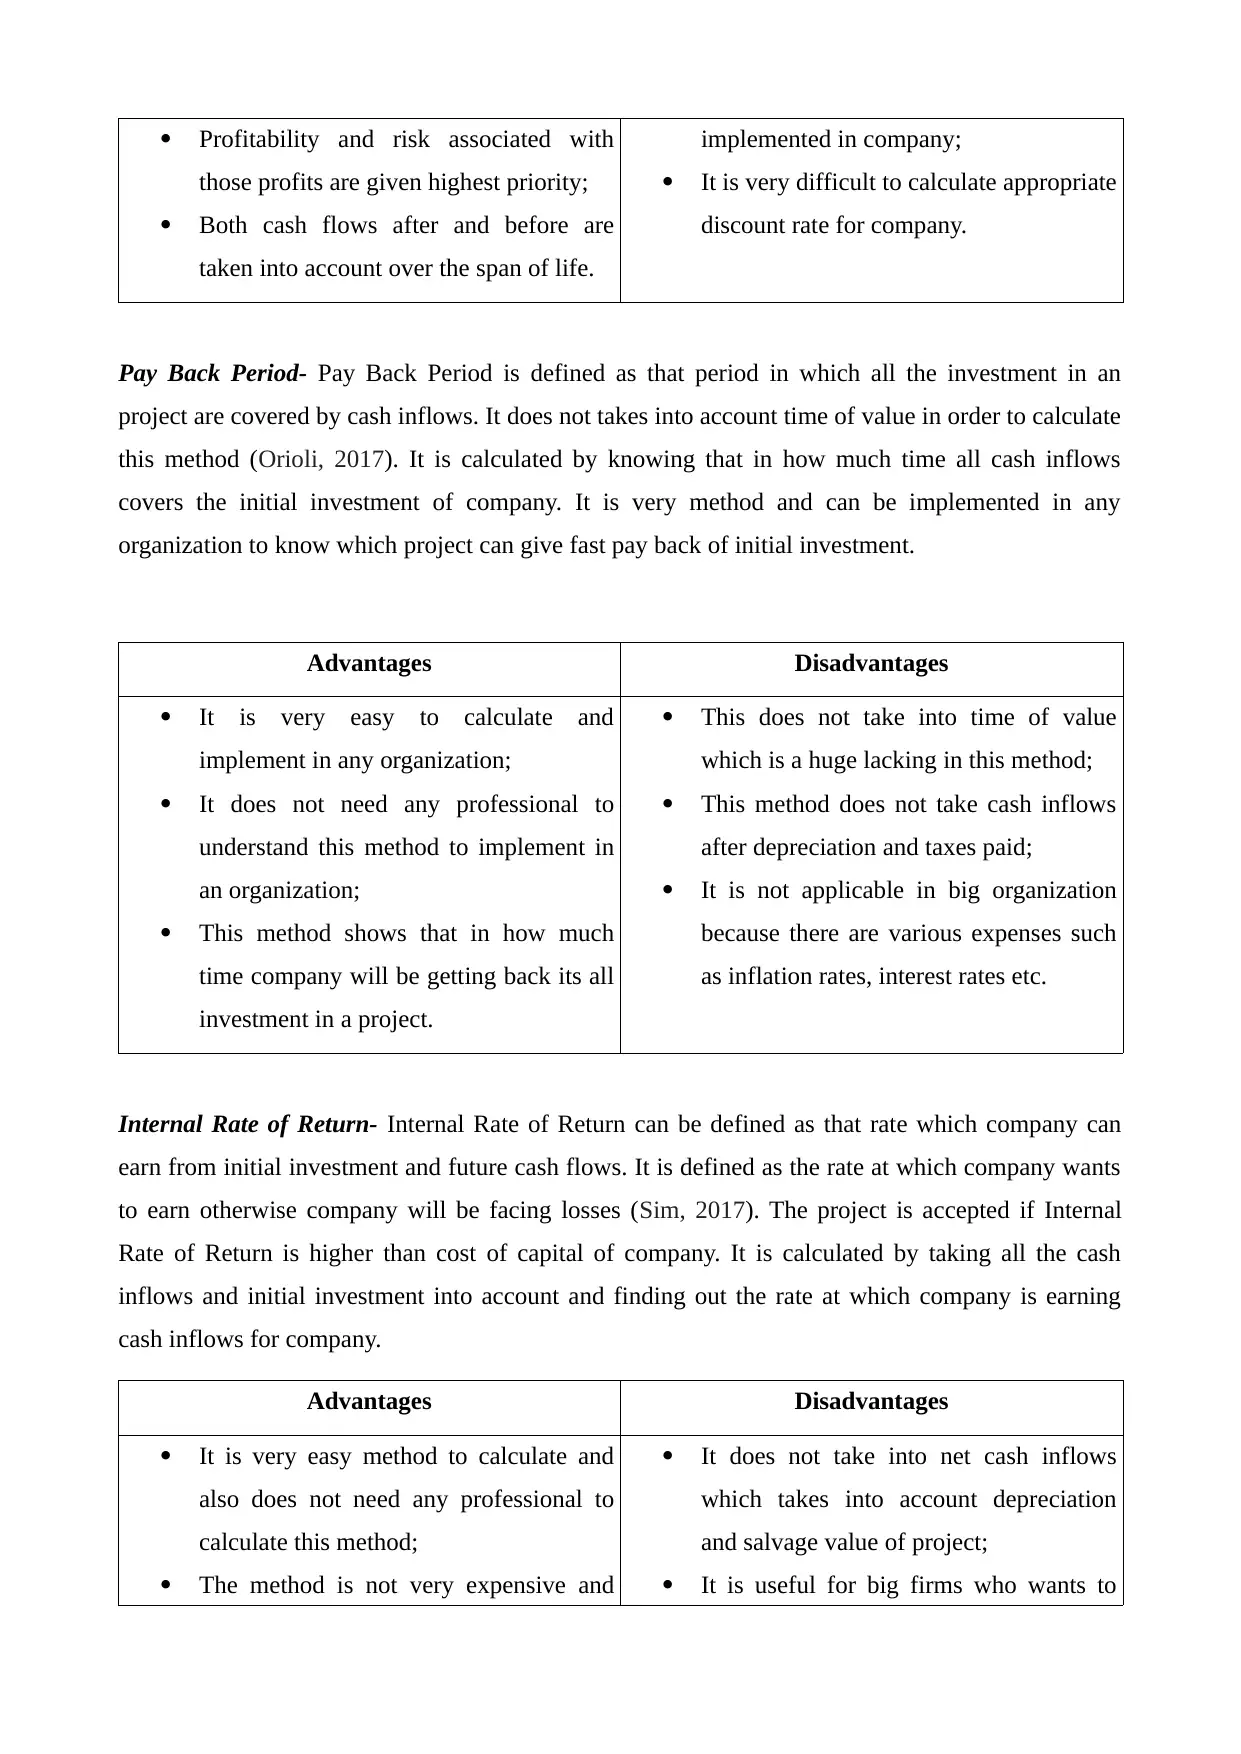
Pay Back Period- Pay Back Period is defined as that period in which all the investment in an
project are covered by cash inflows. It does not takes into account time of value in order to calculate
this method (Orioli, 2017). It is calculated by knowing that in how much time all cash inflows
covers the initial investment of company. It is very method and can be implemented in any
organization to know which project can give fast pay back of initial investment.
Advantages Disadvantages
It is very easy to calculate and
implement in any organization;
It does not need any professional to
understand this method to implement in
an organization;
This method shows that in how much
time company will be getting back its all
investment in a project.
This does not take into time of value
which is a huge lacking in this method;
This method does not take cash inflows
after depreciation and taxes paid;
It is not applicable in big organization
because there are various expenses such
as inflation rates, interest rates etc.
Internal Rate of Return- Internal Rate of Return can be defined as that rate which company can
earn from initial investment and future cash flows. It is defined as the rate at which company wants
to earn otherwise company will be facing losses (Sim, 2017). The project is accepted if Internal
Rate of Return is higher than cost of capital of company. It is calculated by taking all the cash
inflows and initial investment into account and finding out the rate at which company is earning
cash inflows for company.
Advantages Disadvantages
It is very easy method to calculate and
also does not need any professional to
calculate this method;
The method is not very expensive and
It does not take into net cash inflows
which takes into account depreciation
and salvage value of project;
It is useful for big firms who wants to
those profits are given highest priority;
Both cash flows after and before are
taken into account over the span of life.
implemented in company;
It is very difficult to calculate appropriate
discount rate for company.
Pay Back Period- Pay Back Period is defined as that period in which all the investment in an
project are covered by cash inflows. It does not takes into account time of value in order to calculate
this method (Orioli, 2017). It is calculated by knowing that in how much time all cash inflows
covers the initial investment of company. It is very method and can be implemented in any
organization to know which project can give fast pay back of initial investment.
Advantages Disadvantages
It is very easy to calculate and
implement in any organization;
It does not need any professional to
understand this method to implement in
an organization;
This method shows that in how much
time company will be getting back its all
investment in a project.
This does not take into time of value
which is a huge lacking in this method;
This method does not take cash inflows
after depreciation and taxes paid;
It is not applicable in big organization
because there are various expenses such
as inflation rates, interest rates etc.
Internal Rate of Return- Internal Rate of Return can be defined as that rate which company can
earn from initial investment and future cash flows. It is defined as the rate at which company wants
to earn otherwise company will be facing losses (Sim, 2017). The project is accepted if Internal
Rate of Return is higher than cost of capital of company. It is calculated by taking all the cash
inflows and initial investment into account and finding out the rate at which company is earning
cash inflows for company.
Advantages Disadvantages
It is very easy method to calculate and
also does not need any professional to
calculate this method;
The method is not very expensive and
It does not take into net cash inflows
which takes into account depreciation
and salvage value of project;
It is useful for big firms who wants to
Paraphrase This Document
Need a fresh take? Get an instant paraphrase of this document with our AI Paraphraser
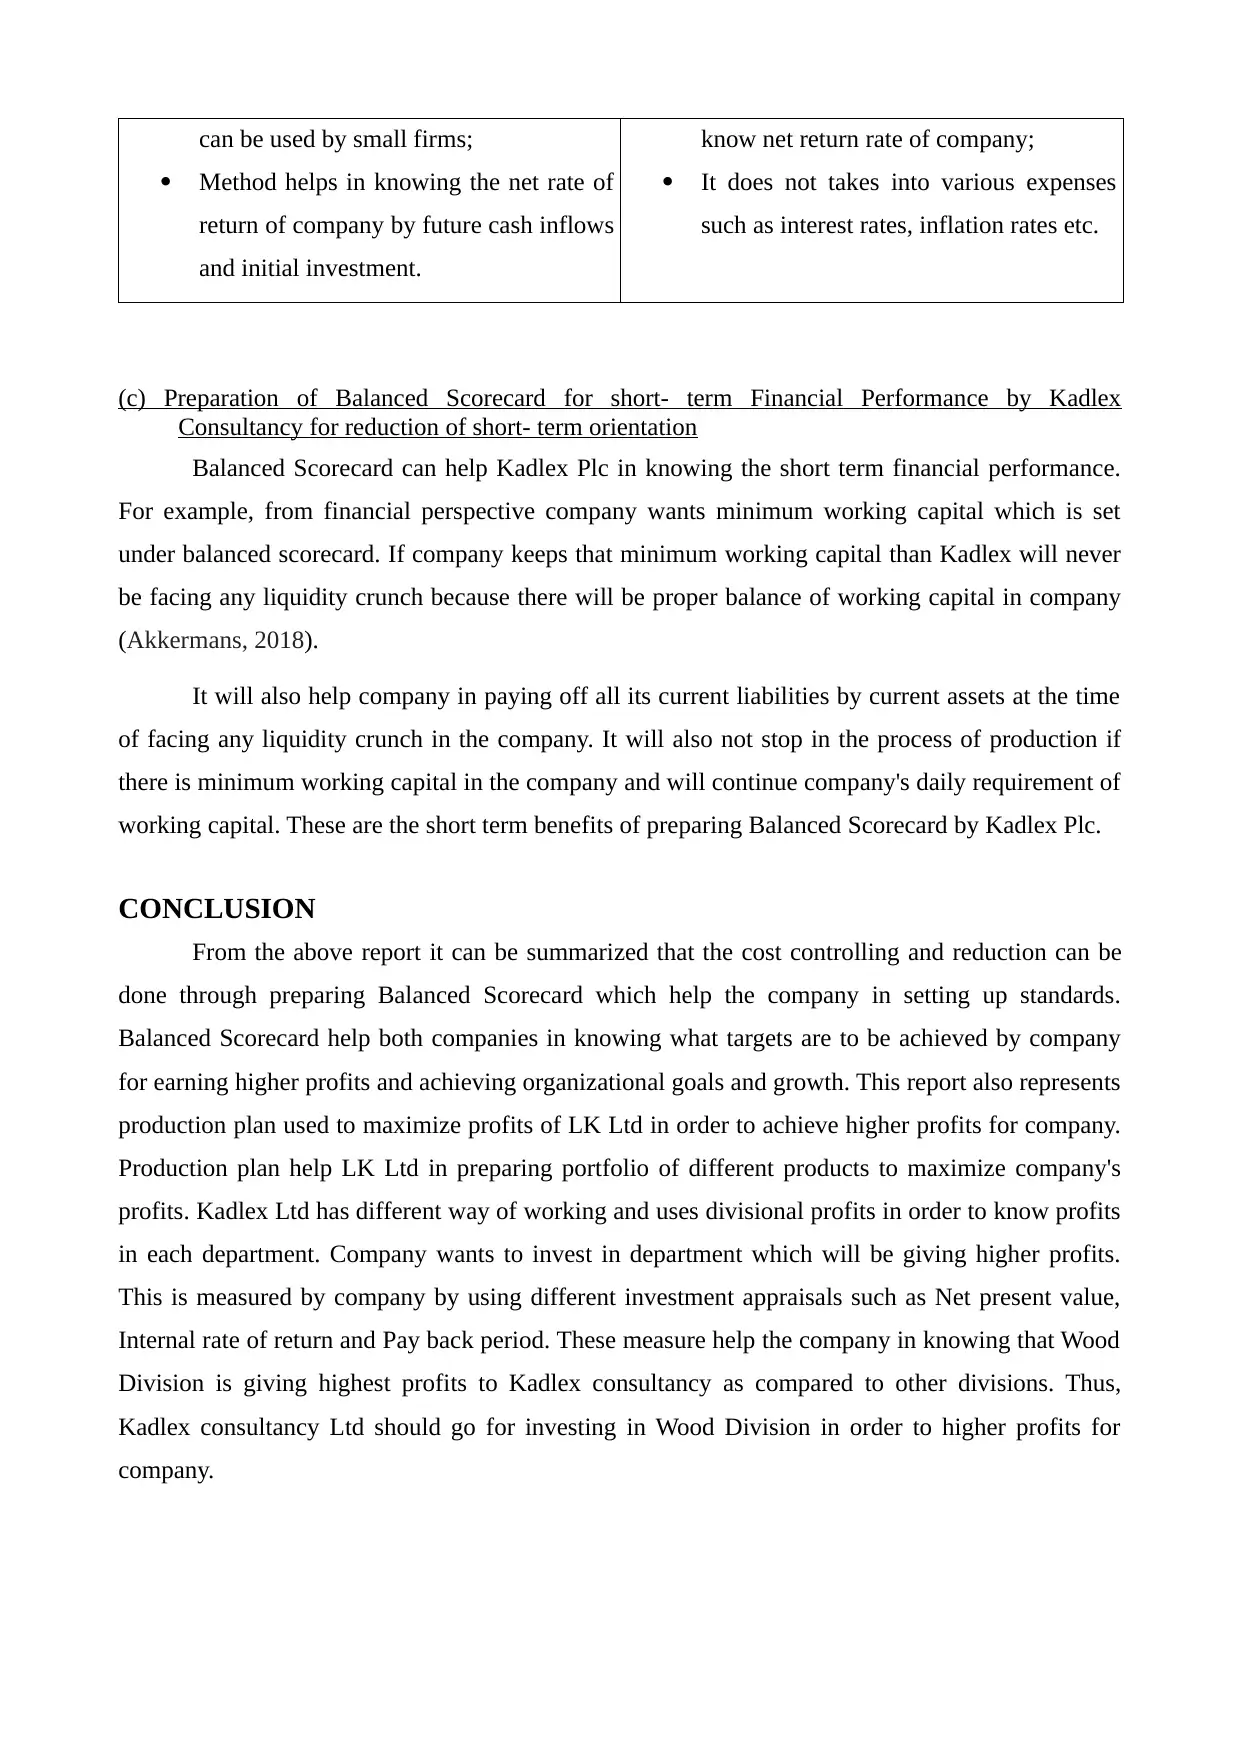
can be used by small firms;
Method helps in knowing the net rate of
return of company by future cash inflows
and initial investment.
know net return rate of company;
It does not takes into various expenses
such as interest rates, inflation rates etc.
(c) Preparation of Balanced Scorecard for short- term Financial Performance by Kadlex
Consultancy for reduction of short- term orientation
Balanced Scorecard can help Kadlex Plc in knowing the short term financial performance.
For example, from financial perspective company wants minimum working capital which is set
under balanced scorecard. If company keeps that minimum working capital than Kadlex will never
be facing any liquidity crunch because there will be proper balance of working capital in company
(Akkermans, 2018).
It will also help company in paying off all its current liabilities by current assets at the time
of facing any liquidity crunch in the company. It will also not stop in the process of production if
there is minimum working capital in the company and will continue company's daily requirement of
working capital. These are the short term benefits of preparing Balanced Scorecard by Kadlex Plc.
CONCLUSION
From the above report it can be summarized that the cost controlling and reduction can be
done through preparing Balanced Scorecard which help the company in setting up standards.
Balanced Scorecard help both companies in knowing what targets are to be achieved by company
for earning higher profits and achieving organizational goals and growth. This report also represents
production plan used to maximize profits of LK Ltd in order to achieve higher profits for company.
Production plan help LK Ltd in preparing portfolio of different products to maximize company's
profits. Kadlex Ltd has different way of working and uses divisional profits in order to know profits
in each department. Company wants to invest in department which will be giving higher profits.
This is measured by company by using different investment appraisals such as Net present value,
Internal rate of return and Pay back period. These measure help the company in knowing that Wood
Division is giving highest profits to Kadlex consultancy as compared to other divisions. Thus,
Kadlex consultancy Ltd should go for investing in Wood Division in order to higher profits for
company.
REFERENCES
Books and Journals
Akkermans, H. A. and Van Oorschot, K. E., 2018. Relevance assumed: a case study of balanced
scorecard development using system dynamics. In System Dynamics (pp. 107-132). Palgrave
Macmillan. London.
Albrecht, M., 2017. Optimization of safety stocks in models with an order service level objective or
constraint. European Journal of Operational Research. 263(3). pp.900-909.
Balaji, N. A., Sukumar, R. and Parvathy, M., 2019. Enhanced dual authentication and key
management scheme for data authentication in vehicular ad hoc network. Computers &
Electrical Engineering. 76. pp.94-110.
Becher, S., and et.al., 2018. A method for manufacturing a product according to a production plan.
U.S. Patent Application 15/553.459.
Bian, Y., and et.al., 2017. An EOQ-based profit maximization model considering financing cost of
working capital requirement.
Chen, M., and et.al., 2015. On the computation offloading at ad hoc cloudlet: architecture and
service modes. IEEE Communications Magazine. 53(6). pp.18-24.
Gosse, J. H. and Sharp, E. J., 2017. September. Explicit Margin of Safety Assessment of Composite
Structure. In International Workshop on Meshfree Methods for Partial Differential
Equations (pp. 43-51). Springer. Cham.
Hansen, E. G. and Schaltegger, S., 2016. The sustainability balanced scorecard: A systematic review
of architectures. Journal of Business Ethics. 133(2). pp.193-221.
Jansen, J. G. J., 2016. Dredge Mining Sequence Optimization: Maximizing the Net Present Value
(NPV).
Kamei, Y., and et.al., 2016. Studying just-in-time defect prediction using cross-project
models. Empirical Software Engineering. 21(5). pp.2072-2106.
Kumar, S. and Chakravarty, A., 2015. ABC–VED analysis of expendable medical stores at a tertiary
care hospital. Medical journal armed forces india. 71(1). pp.24-27.
Liozu, S., and et.al., 2015. Mindful Pricing: Transforming Organizations Through Value Based
Pricing. In Marketing Dynamism & Sustainability: Things Change, Things Stay the
Same… (pp. 412-421). Springer, Cham.
Liu, Z., Gao, R., Zhou, C. and Ma, N., 2019. Two-period pricing and strategy choice for a supply
⊘ This is a preview!⊘
Do you want full access?
Subscribe today to unlock all pages.
Trusted by 1+ million students worldwide
1 out of 18
Related Documents


Your All-in-One AI-Powered Toolkit for Academic Success.
+13062052269
info@desklib.com
Available 24*7 on WhatsApp / Email
![[object Object]](/_next/static/media/star-bottom.7253800d.svg)
Unlock your academic potential
Copyright © 2020–2026 A2Z Services. All Rights Reserved. Developed and managed by ZUCOL.