Management Accounting Report: XLG Cleaning Products - Part A and B
VerifiedAdded on 2023/01/07
|12
|3092
|81
Report
AI Summary
This report provides a comprehensive analysis of management accounting principles applied to XLG, a cleaning products company. The report is divided into two parts. Part A focuses on variance analysis, including sales price variance, sales volume variance, and material price variance, and discusses the advantages and disadvantages of variance analysis in assessing managerial performance. Part B presents a comparative study of two options: manufacturing Fama Q in the UK versus importing it from Brazil, considering cost and revenue implications under a new scenario with increased demand. The analysis includes detailed calculations of costs, revenues, and profit margins for each option, ultimately providing a recommendation based on financial feasibility. The report considers the company's specific circumstances, including patent ownership and import costs, to provide a well-rounded analysis for decision-making.
MANAGEMENT
ACCOUNTING
(A4)
ACCOUNTING
(A4)
Paraphrase This Document
Need a fresh take? Get an instant paraphrase of this document with our AI Paraphraser
Contents
INTRODUCTION...........................................................................................................................3
PART A...........................................................................................................................................3
Part B......................................................................................................................................8
CONCLUSION..............................................................................................................................11
REFERENCES..............................................................................................................................12
INTRODUCTION
The detailed process of recording, analysing, reviewing and making decision with the help
of financial and non-financial information by the inner manager to increase overall profit is
known as management accounting (Taschner and Charifzadeh, 2020). This help in achieving
small daily target of the company and reduce ant error at initial level so that entire profit margin
can be increased in specific time period. The study is being prepared on a business which is
XLG that produces and markets different forms of cleaning products across the UK.
In the report Section A and B are addressed, which is cantered on gathered market
knowledge. Data concerning the measurement of different differences between benefits and
drawbacks have been included in Part A. Although the part b is really being evaluated as to
whether company will enforce making item at home or importing from another region.
PART A
(i) Contracts price and capacity involvement modification.
Sales Price Variance: This volatility may be defined as the difference between actual
sales market prices and overall revenue from budget costs. As per the information provided, the
measurement of this volatility in a specific way indicates below:
Formula: (Actual Price-Standard price) (*) Actual number of units
Chemical X:
Provided data:
Authentic price= 45 Pounds
Standard value= 35 Pounds
Actual amount of deals unit= 850 units
Sales price difference: (45-35) *850
= 8500 (F)
Chemical Y:
Given figures:
Authentic price= 37 Pounds
Normal price= 30 Pounds
Real amount of sales part= 750 units
Sales value variance: (37-30) * 750
⊘ This is a preview!⊘
Do you want full access?
Subscribe today to unlock all pages.
Trusted by 1+ million students worldwide
= 5250 (F)
Uncertainty of amount of spending revenues: Such uncertainty may be applied to the study of
income transfer owing to the difference between the budget period and real selling levels.
Formula: (recent units valued at a massive premium within each unit) - (budged component
valued at an expenditure cost per share).
Chemical X:
Identified data:
Actual components sold= 850 Units
Scheduled value for entire unit= 35 Pounds
Strategic unit total sale= 595 Units
Strategic value for all component= 35 Pounds
Sales size result modification: (850*35) – (595*35)
= 8925 (F)
Chemical Y:
Provided statistics:
Definite units traded= 750 Units
Accounted price for all unit = 30 Pounds
Planned unit sold= 595 Units
Planned price for each unit= 30 Pounds
Sales capacity influence variance: (750*30) – (595*30)
= 4650 (F)
The variations in the organization of material costs and also the differentiation across the
component 's organizational price.
Volatility in the arrangement of commodity prices: This is also a form of volatility measured
to assess the disparity between both the material's current and expected values (Wegmann,
2019). This is calculated using the mentioned equation below that is as define in the following:
Equation: [(Revised Plan Revenue X Average Margin) - (Current Average Margin X Profit
Quantities)]
Chemical X:
Specified numbers-
Revised budgeted sales= 595 units @ 4.5
Paraphrase This Document
Need a fresh take? Get an instant paraphrase of this document with our AI Paraphraser
Normal Margin= 25
Certain Sales Volume= 850 Units
Average Margin= 25
Considerable price planning variance: [(595*4.5*25) -(850*25)]
45687.5
Chemical Y:
Stated data-
Studied accounted sales = 595 units @ 4.5
Average Margin = 20
Definite Sales Extent = 750 Units
Standard Margin = 20
Actual worth preparation alteration: [(595*4.5*20) - (750*20)]
38550
Variability in product cost operation: This type of variability is calculated to determine
differences in resource costs, labour, etc. This is evaluated by multiplication with real outcomes
the actual information as well as the updated budgets (Bhimani, 2020). With respect to the
distribution info supplied, this difference was calculated in a way that's really as outlined as
follows:
Formula: [(Original Sales Budget x Standard Margin) - (Revised Sales Budget x Standard)
Chemical X:
Specific data:
Exclusive accounted sales= 595 Units @ 2.5
Standard Margin= 25
Revised planned sales= 595 Units @ 4.5
Ordinary Margin= 25
Material worth planning difference= [(595*2.5*25) -(595*4.5*25)]
= -29750
Chemical Y:
Given material:
New budgeted figures = 595 Units @ 2.5
Standard Margin= 20
Updated accounted sales= 595 Units @ 4.5
Standard margin= 20
Material price planning variance= [(595*2.5*20) -(595*4.5*20)]
= -23800
Given the change between methods, the positives and drawbacks between utilizing variances are
measured critically in assessing managers’ performance.
Variance predictive research is often a study of current activity variances against expected or
intended financial modelling or accounting behaviour (Horvat and Mojzer, 2019). This deals
primarily about how the disparity between real and planned activities shows the efficiency of the
company is being affected. In general words, the assignment of variability is perhaps the system
is an advanced of the distinction among data and expected behaviour. This retains influence of
the company by doing this analysis. For example, if the expected revenue is $10,000 and the
actual revenue is $8,000 and then perhaps the study of the variation resulted in a difference of
$2,000. Eventually, by help of this technique it becomes easier for managers to focus on those
activities which are leading to poor or excellent performance. For instance, in the context of
above company they have computed a range of variances such as material, price and many more.
Herein, below key advantages and disadvantages of variance analysis are mentioned below in
such manner:
Advantages:
Helps in analysing performance- It is one of the key importance of this method as it leads
to effective analysis of performance of company (Asiri, Khan and Kend, 2020). This
becomes possible because of availability of a range of variances such as price, cost,
material and many more. In the aspect of above company, they have computed different
types of material and price variances which helped them in order to measure variation in
actual and estimated performance. In the absence of proper calculation of variances, this
may become complex for companies to measure actual level of performance of different
kinds of activities. Another reason due to which, this technique is preferred first over
financial statement is that under it, systematic values are provided to managers separately
for each and every activity.
Recognizing changes needed in business strategies- This is an another role of variance
analysis as by help of it, managers can become able to address needed changes in current
⊘ This is a preview!⊘
Do you want full access?
Subscribe today to unlock all pages.
Trusted by 1+ million students worldwide
business strategies. It becomes possible because of different kinds of variances such as if
outcome of price variance is not favourable then managers can revise their prices at a
level that can bring price variances favourable. Similar to this, other variances are also
useful for managers to keep an extra sight of eye over performance each and every
activity so that they can make modification in their strategies accordingly.
Helps in recognizing & managing risks- The variance analysis is useful in order to
identify and control different kinds of risks. This is so because by help of different kinds
of variances, it becomes possible for managers to concentrate on adverse activities and
operations. And in accordance of computed outcome, they can prepare effective
strategies and policies in order to meet their achieved target as well as to reduce risk of
loss.
Disadvantage:
Source of variance- In most of the companies, variances are kept away from accounting
records, due to which managers cannot find these when they needed. It is an indicating
that variance analysis is not a reliable source in order to do proper analysis of financial
performance of different kinds of activities and operations (Zand and Lee, 2019). As well
as small companies cannot even apply this technique as it needs a systematic data about
each and every activity that is not possible for them. So it is difficult to find out source of
variance for taking crucial decisions.
Further investigation required- The variance analysis gives information only about an
amount implying the change in financial gain or revenue. Only this little piece of info
can't base the choices. In order to take crucial decisions, it is essential to do proper
analysis of each aspect including cause and solution of lower performance. Examination
of variances is worthless without further analysis of these discrepancies between the
quantities budgeted and real output.
Manipulation of variances- The workers can exploit the variances for their own purposes.
The management can take inappropriate action to achieve a desirable variance or to
prevent a negative variance (Jovanović, Dražić-Lutilsk and Vašiček, 2019). For instance,
the business could buy higher quantities of low-quality material at a better price only so
that the variation in material usage would be beneficial. Employees may also attempt to
Paraphrase This Document
Need a fresh take? Get an instant paraphrase of this document with our AI Paraphraser
hide negative variances in order to conceal their shortfalls, or because it individually
advantages them. So it is also a main issue under variance analysis as managers do not
have proper control over these aspects which may lead to manipulation of data.
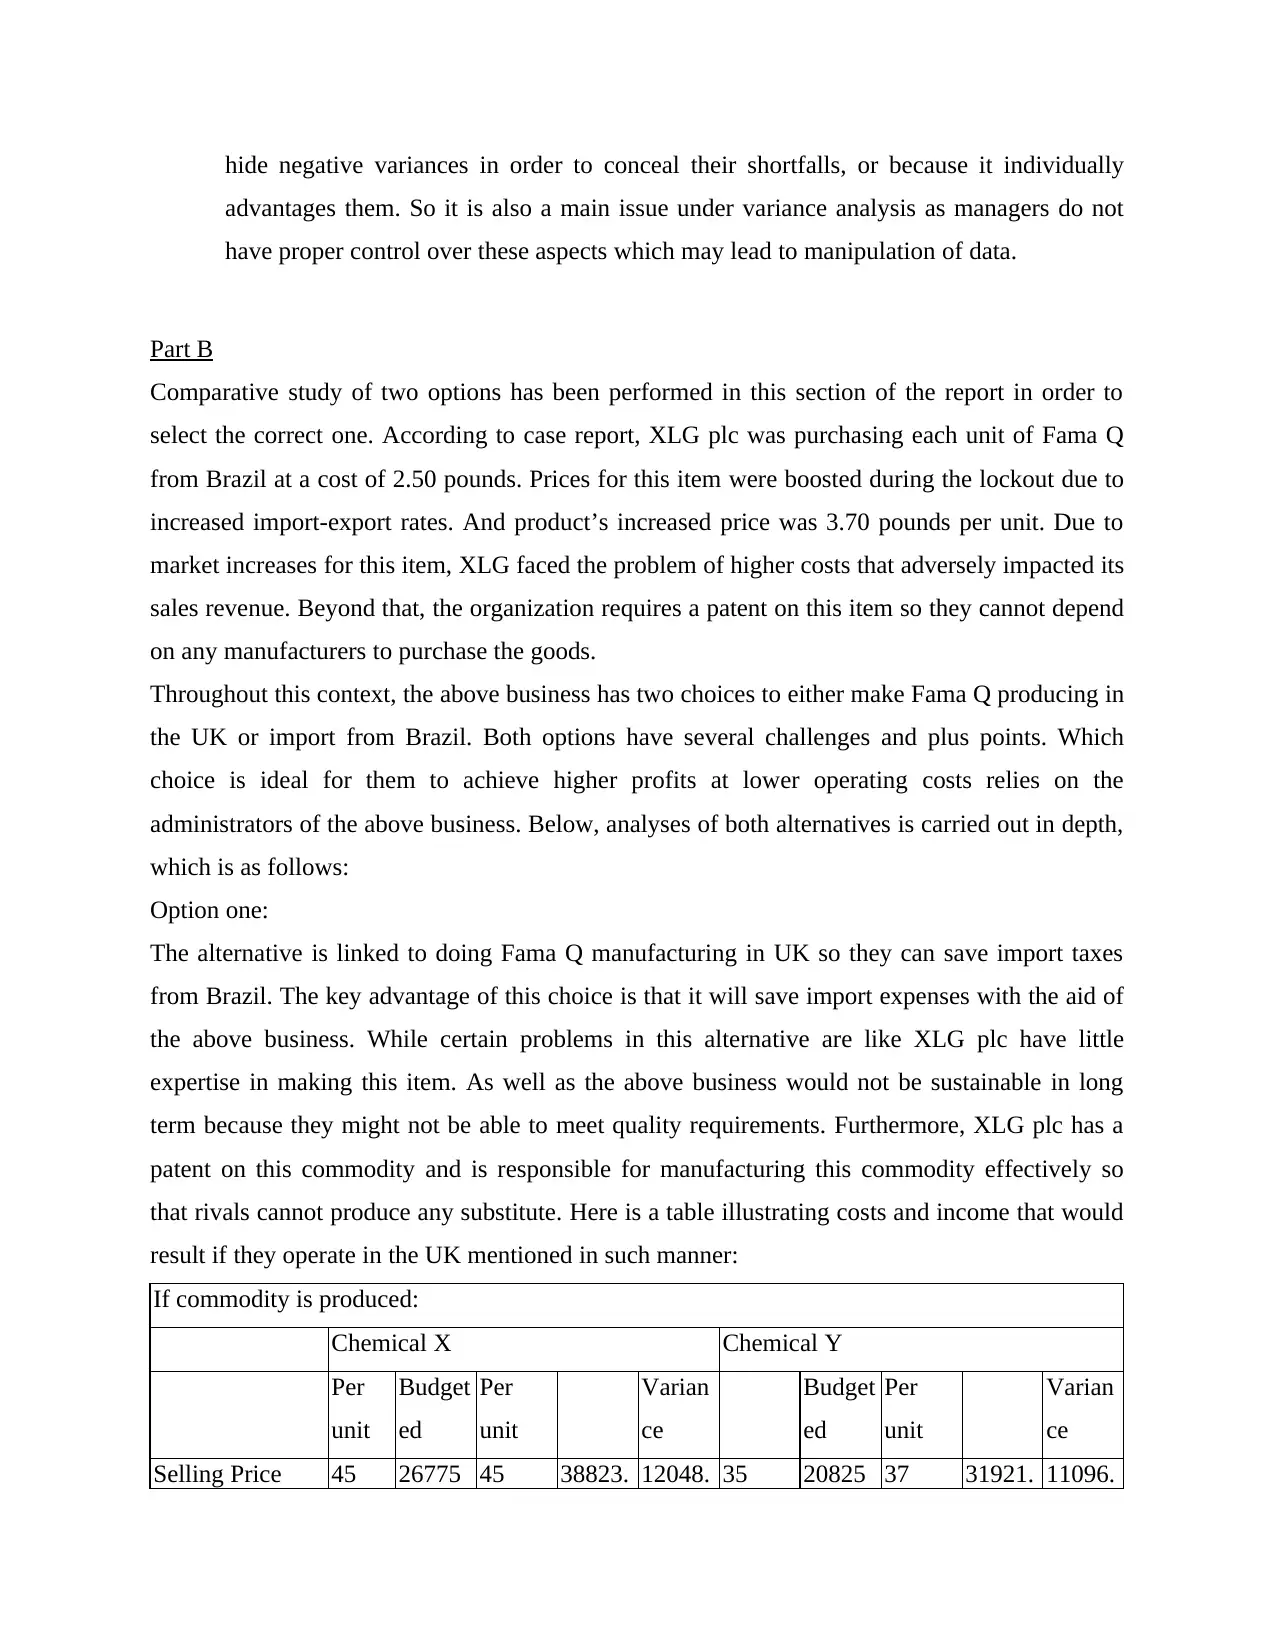
Part B
Comparative study of two options has been performed in this section of the report in order to
select the correct one. According to case report, XLG plc was purchasing each unit of Fama Q
from Brazil at a cost of 2.50 pounds. Prices for this item were boosted during the lockout due to
increased import-export rates. And product’s increased price was 3.70 pounds per unit. Due to
market increases for this item, XLG faced the problem of higher costs that adversely impacted its
sales revenue. Beyond that, the organization requires a patent on this item so they cannot depend
on any manufacturers to purchase the goods.
Throughout this context, the above business has two choices to either make Fama Q producing in
the UK or import from Brazil. Both options have several challenges and plus points. Which
choice is ideal for them to achieve higher profits at lower operating costs relies on the
administrators of the above business. Below, analyses of both alternatives is carried out in depth,
which is as follows:
Option one:
The alternative is linked to doing Fama Q manufacturing in UK so they can save import taxes
from Brazil. The key advantage of this choice is that it will save import expenses with the aid of
the above business. While certain problems in this alternative are like XLG plc have little
expertise in making this item. As well as the above business would not be sustainable in long
term because they might not be able to meet quality requirements. Furthermore, XLG plc has a
patent on this commodity and is responsible for manufacturing this commodity effectively so
that rivals cannot produce any substitute. Here is a table illustrating costs and income that would
result if they operate in the UK mentioned in such manner:
If commodity is produced:
Chemical X Chemical Y
Per
unit
Budget
ed
Per
unit
Varian
ce
Budget
ed
Per
unit
Varian
ce
Selling Price 45 26775 45 38823. 12048. 35 20825 37 31921. 11096.
advantages them. So it is also a main issue under variance analysis as managers do not
have proper control over these aspects which may lead to manipulation of data.
Part B
Comparative study of two options has been performed in this section of the report in order to
select the correct one. According to case report, XLG plc was purchasing each unit of Fama Q
from Brazil at a cost of 2.50 pounds. Prices for this item were boosted during the lockout due to
increased import-export rates. And product’s increased price was 3.70 pounds per unit. Due to
market increases for this item, XLG faced the problem of higher costs that adversely impacted its
sales revenue. Beyond that, the organization requires a patent on this item so they cannot depend
on any manufacturers to purchase the goods.
Throughout this context, the above business has two choices to either make Fama Q producing in
the UK or import from Brazil. Both options have several challenges and plus points. Which
choice is ideal for them to achieve higher profits at lower operating costs relies on the
administrators of the above business. Below, analyses of both alternatives is carried out in depth,
which is as follows:
Option one:
The alternative is linked to doing Fama Q manufacturing in UK so they can save import taxes
from Brazil. The key advantage of this choice is that it will save import expenses with the aid of
the above business. While certain problems in this alternative are like XLG plc have little
expertise in making this item. As well as the above business would not be sustainable in long
term because they might not be able to meet quality requirements. Furthermore, XLG plc has a
patent on this commodity and is responsible for manufacturing this commodity effectively so
that rivals cannot produce any substitute. Here is a table illustrating costs and income that would
result if they operate in the UK mentioned in such manner:
If commodity is produced:
Chemical X Chemical Y
Per
unit
Budget
ed
Per
unit
Varian
ce
Budget
ed
Per
unit
Varian
ce
Selling Price 45 26775 45 38823. 12048. 35 20825 37 31921. 11096.
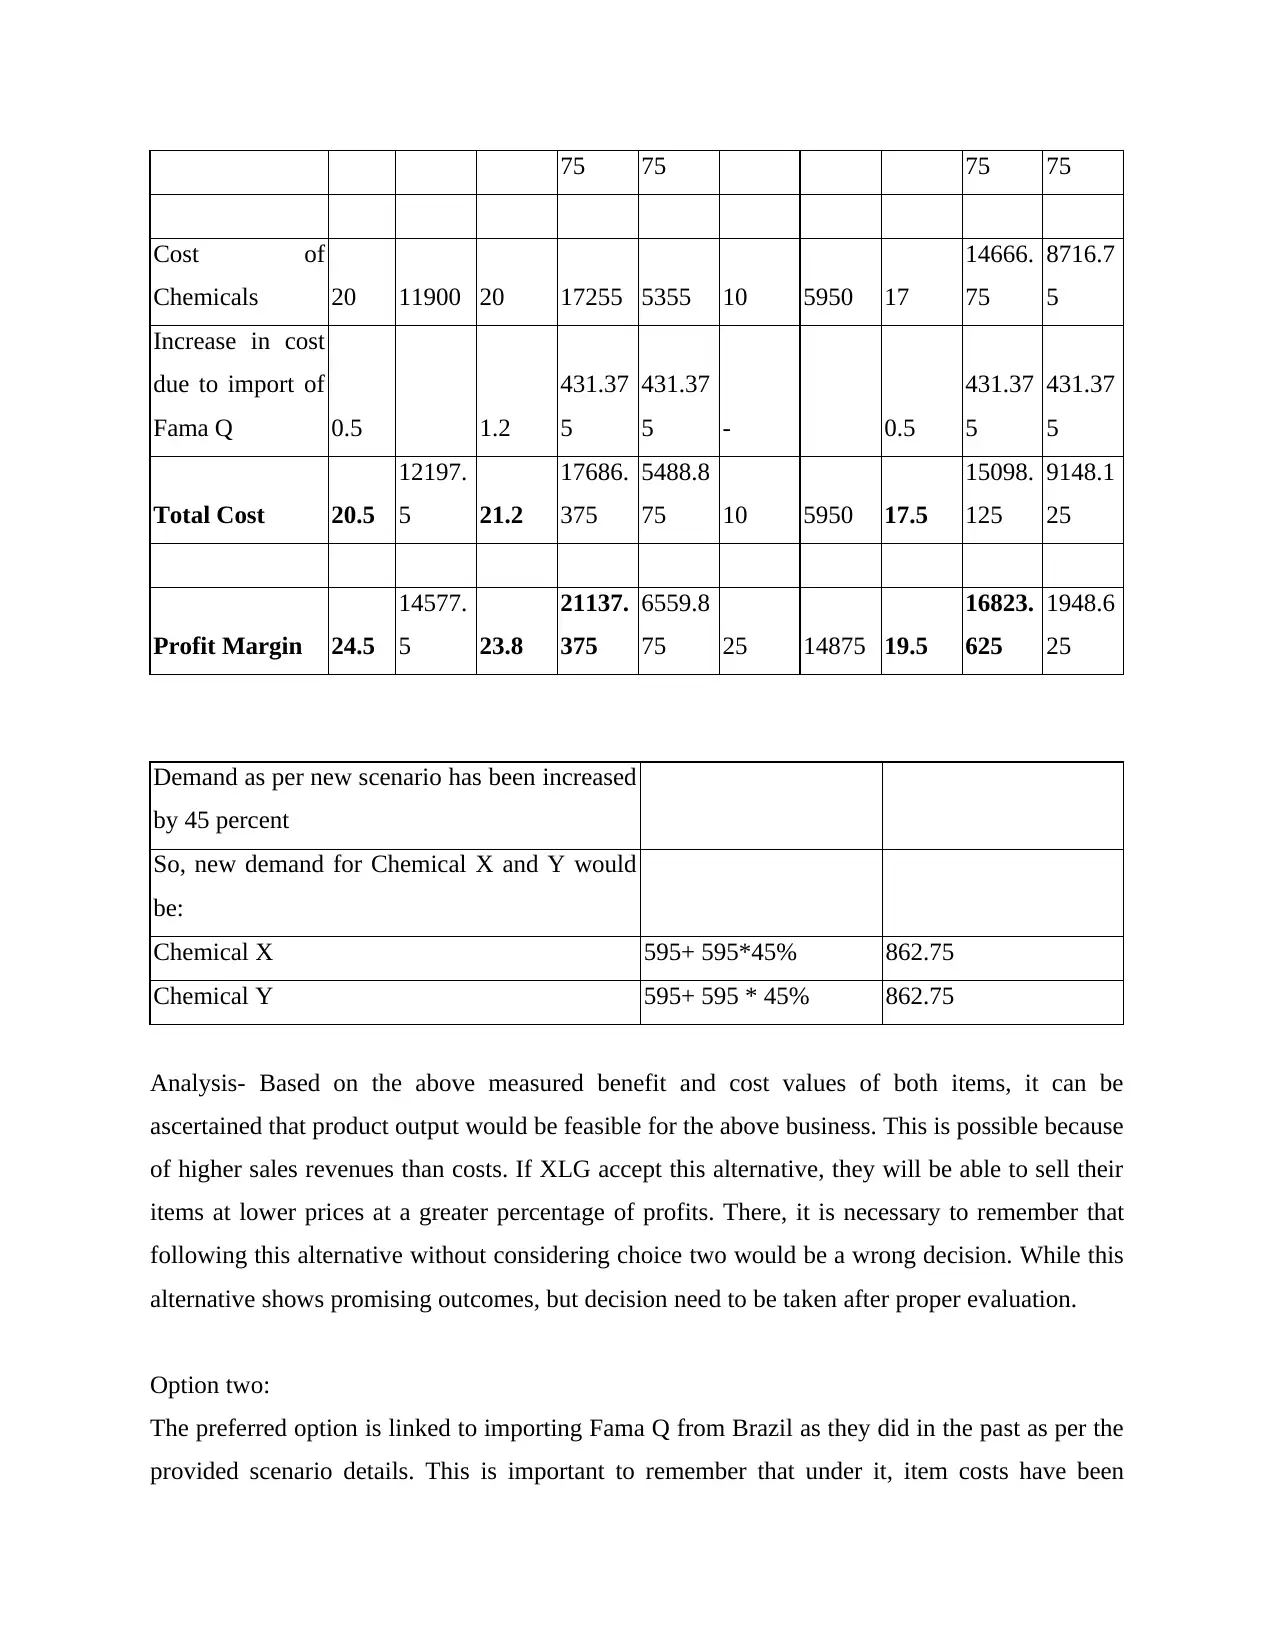
75 75 75 75
Cost of
Chemicals 20 11900 20 17255 5355 10 5950 17
14666.
75
8716.7
5
Increase in cost
due to import of
Fama Q 0.5 1.2
431.37
5
431.37
5 - 0.5
431.37
5
431.37
5
Total Cost 20.5
12197.
5 21.2
17686.
375
5488.8
75 10 5950 17.5
15098.
125
9148.1
25
Profit Margin 24.5
14577.
5 23.8
21137.
375
6559.8
75 25 14875 19.5
16823.
625
1948.6
25
Demand as per new scenario has been increased
by 45 percent
So, new demand for Chemical X and Y would
be:
Chemical X 595+ 595*45% 862.75
Chemical Y 595+ 595 * 45% 862.75
Analysis- Based on the above measured benefit and cost values of both items, it can be
ascertained that product output would be feasible for the above business. This is possible because
of higher sales revenues than costs. If XLG accept this alternative, they will be able to sell their
items at lower prices at a greater percentage of profits. There, it is necessary to remember that
following this alternative without considering choice two would be a wrong decision. While this
alternative shows promising outcomes, but decision need to be taken after proper evaluation.
Option two:
The preferred option is linked to importing Fama Q from Brazil as they did in the past as per the
provided scenario details. This is important to remember that under it, item costs have been
⊘ This is a preview!⊘
Do you want full access?
Subscribe today to unlock all pages.
Trusted by 1+ million students worldwide
increased by an immense amount and could become the cause of this product's high makeup
price. In this option, the only advantage being that the business does not have to worry about
demand as well as preserving the price. Beyond these things, before considering an option, there
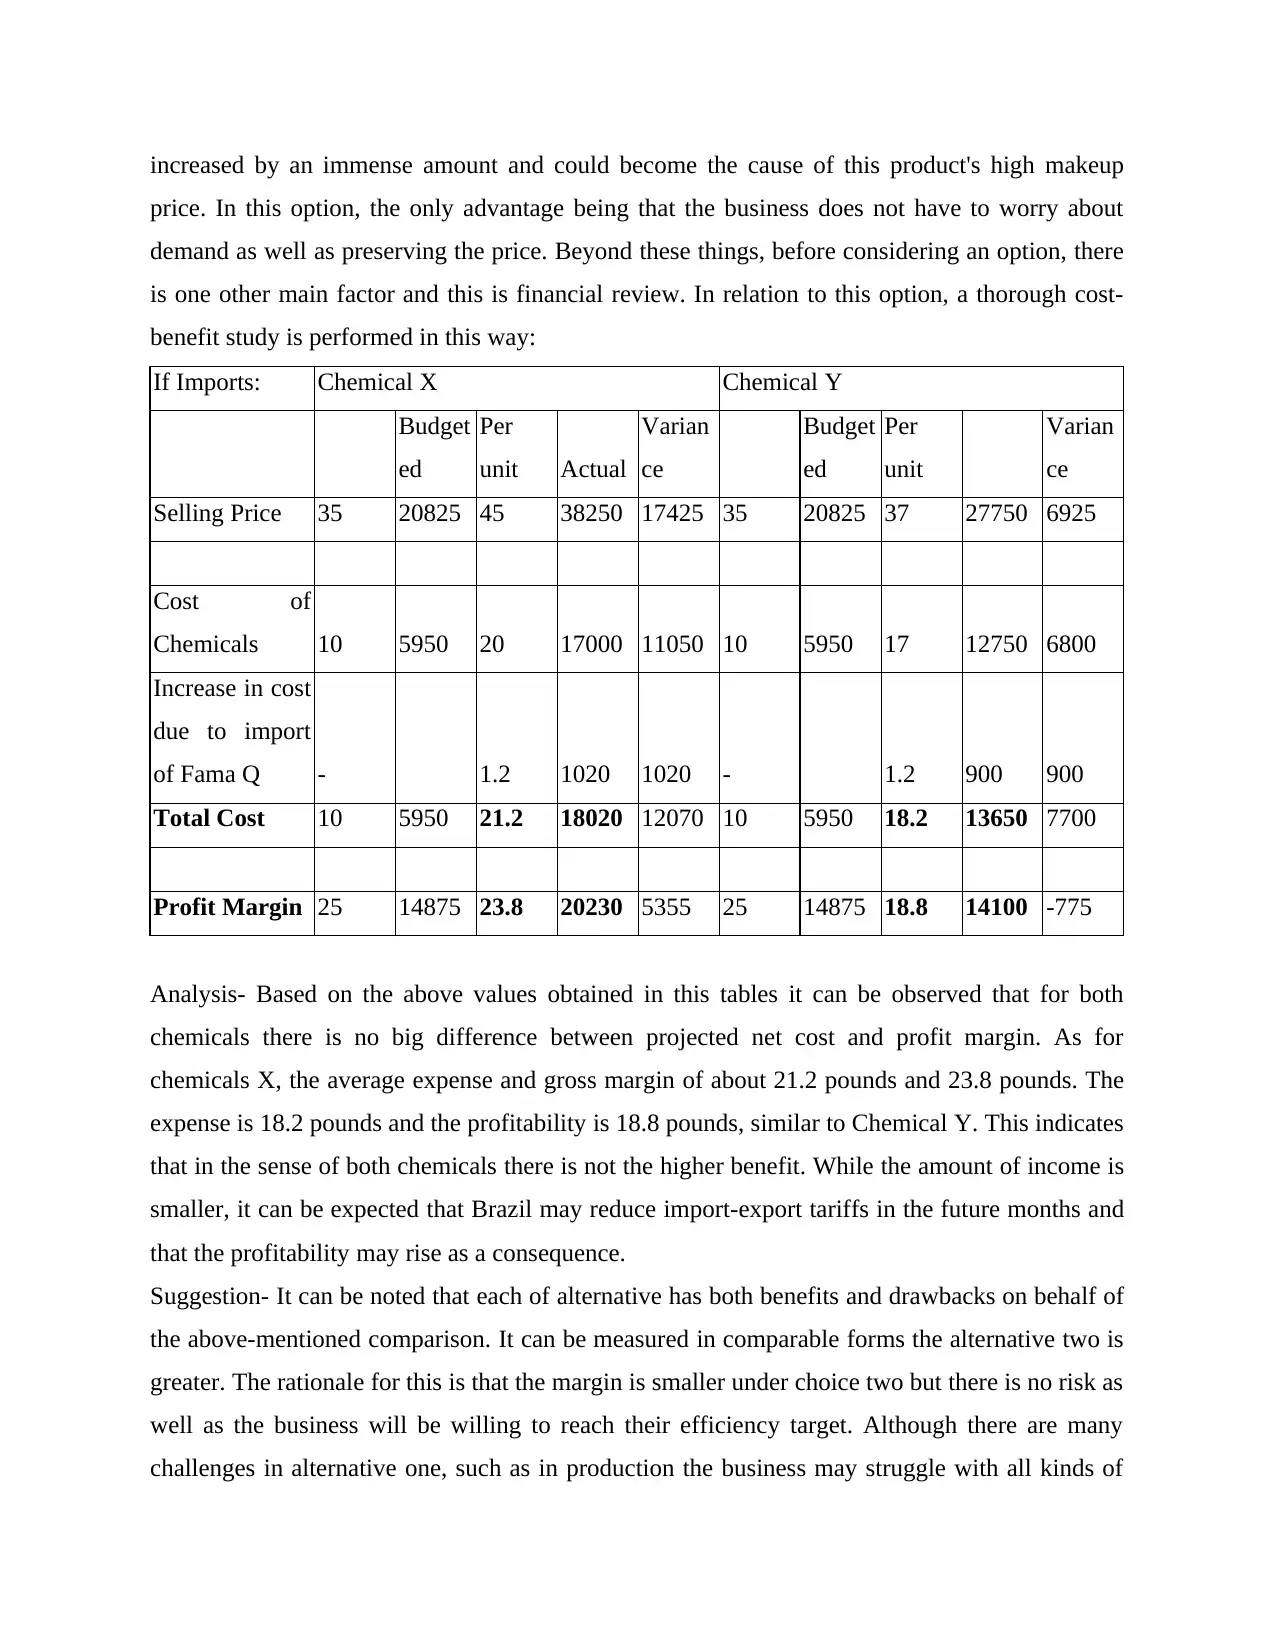
is one other main factor and this is financial review. In relation to this option, a thorough cost-
benefit study is performed in this way:
If Imports: Chemical X Chemical Y
Budget
ed
Per
unit Actual
Varian
ce
Budget
ed
Per
unit
Varian
ce
Selling Price 35 20825 45 38250 17425 35 20825 37 27750 6925
Cost of
Chemicals 10 5950 20 17000 11050 10 5950 17 12750 6800
Increase in cost
due to import
of Fama Q - 1.2 1020 1020 - 1.2 900 900
Total Cost 10 5950 21.2 18020 12070 10 5950 18.2 13650 7700
Profit Margin 25 14875 23.8 20230 5355 25 14875 18.8 14100 -775
Analysis- Based on the above values obtained in this tables it can be observed that for both
chemicals there is no big difference between projected net cost and profit margin. As for
chemicals X, the average expense and gross margin of about 21.2 pounds and 23.8 pounds. The
expense is 18.2 pounds and the profitability is 18.8 pounds, similar to Chemical Y. This indicates
that in the sense of both chemicals there is not the higher benefit. While the amount of income is
smaller, it can be expected that Brazil may reduce import-export tariffs in the future months and
that the profitability may rise as a consequence.
Suggestion- It can be noted that each of alternative has both benefits and drawbacks on behalf of
the above-mentioned comparison. It can be measured in comparable forms the alternative two is
greater. The rationale for this is that the margin is smaller under choice two but there is no risk as
well as the business will be willing to reach their efficiency target. Although there are many
challenges in alternative one, such as in production the business may struggle with all kinds of
price. In this option, the only advantage being that the business does not have to worry about
demand as well as preserving the price. Beyond these things, before considering an option, there
is one other main factor and this is financial review. In relation to this option, a thorough cost-
benefit study is performed in this way:
If Imports: Chemical X Chemical Y
Budget
ed
Per
unit Actual
Varian
ce
Budget
ed
Per
unit
Varian
ce
Selling Price 35 20825 45 38250 17425 35 20825 37 27750 6925
Cost of
Chemicals 10 5950 20 17000 11050 10 5950 17 12750 6800
Increase in cost
due to import
of Fama Q - 1.2 1020 1020 - 1.2 900 900
Total Cost 10 5950 21.2 18020 12070 10 5950 18.2 13650 7700
Profit Margin 25 14875 23.8 20230 5355 25 14875 18.8 14100 -775
Analysis- Based on the above values obtained in this tables it can be observed that for both
chemicals there is no big difference between projected net cost and profit margin. As for
chemicals X, the average expense and gross margin of about 21.2 pounds and 23.8 pounds. The
expense is 18.2 pounds and the profitability is 18.8 pounds, similar to Chemical Y. This indicates
that in the sense of both chemicals there is not the higher benefit. While the amount of income is
smaller, it can be expected that Brazil may reduce import-export tariffs in the future months and
that the profitability may rise as a consequence.
Suggestion- It can be noted that each of alternative has both benefits and drawbacks on behalf of
the above-mentioned comparison. It can be measured in comparable forms the alternative two is
greater. The rationale for this is that the margin is smaller under choice two but there is no risk as
well as the business will be willing to reach their efficiency target. Although there are many
challenges in alternative one, such as in production the business may struggle with all kinds of
Paraphrase This Document
Need a fresh take? Get an instant paraphrase of this document with our AI Paraphraser
manufacturing costs. This is not clear that manufacturing of commodity can produce higher
returns in the long run.
CONCLUSION
It may be inferred on behalf of the following project study that various forms of
management accounting strategies play a crucial role in the optimal use of available funds.
The study articulates about the method of variance analysis and accordingly various types of
variances are measured which indicate that the output of the above firm is not so successful.
By the second part of the report, it may be inferred that alternative two for their Fama Q
item must be chosen by the client. It is so because underneath this, the business will not face
any disadvantage because this approach appears acceptable in the long run. Although
alternative one can be beneficial for a shorter duration of time rather than longer span of
time.
REFERENCES
Books and journal:
Taschner, A. and Charifzadeh, M., 2020. Management accounting in supply chains–what we
know and what we teach. Journal of Accounting & Organizational Change.
Wegmann, G., 2019. A typology of cost accounting practices based on activity-based costing-a
strategic cost management approach. Asia-Pacific Management Accounting Journal, 14,
pp.161-184.
Bhimani, A., 2020. Digital data and management accounting: why we need to rethink research
methods. Journal of Management Control, pp.1-15.
Asiri, N., Khan, T. and Kend, M., 2020. Environmental management accounting in the Middle
East and North Africa region: Significance of resource slack and coercive
isomorphism. Journal of Cleaner Production, p.121870.
Zandi, G. and Lee, H., 2019. Factors affecting environmental management accounting and
environmental performance: An empirical assessment. Int. J. Energy Econ. Policy, 9,
pp.342-348.
Jovanović, T., Dražić-Lutilsky, I. and Vašiček, D., 2019. Implementation of cost accounting as
the economic pillar of management accounting systems in public hospitals–the case of
Slovenia and Croatia. Economic research-Ekonomska istraživanja, 32(1), pp.3754-3772.
Horvat, T. and Mojzer, J., 2019. Influence of Company Size on Accounting Information for
Decision-Making of Management. Naše gospodarstvo/Our economy, 65(2), pp.11-20.
⊘ This is a preview!⊘
Do you want full access?
Subscribe today to unlock all pages.
Trusted by 1+ million students worldwide
1 out of 12
Related Documents


Your All-in-One AI-Powered Toolkit for Academic Success.
+13062052269
info@desklib.com
Available 24*7 on WhatsApp / Email
![[object Object]](/_next/static/media/star-bottom.7253800d.svg)
Unlock your academic potential
Copyright © 2020–2026 A2Z Services. All Rights Reserved. Developed and managed by ZUCOL.