Management Accounting Report: Master Budget and Analysis
VerifiedAdded on 2021/05/30
|14
|1816
|81
Report
AI Summary
This report provides a comprehensive analysis of management accounting principles, focusing on the formulation of a master budget, analysis of a production program, and a comparison between participative and imposed budgeting approaches. The report includes detailed figures illustrating sales, production, direct labor, purchase, direct material, manufacturing overhead, cash flow, cost of goods manufactured, and income statements. The analysis of the production program evaluates the impact of a new production plan on revenue and costs, utilizing budget figures to forecast sales volume, production volume, and direct material requirements. The report also contrasts participative and imposed budgets, discussing their respective advantages and disadvantages in terms of employee involvement, communication, and cost-effectiveness. The report concludes by highlighting the importance of participative budgeting in implementing business strategies and objectives.

Running head: MANAGEMENT ACCOUNTING
Management Accounting
Name of the Student:
Name of the University:
Author’s Note:
Management Accounting
Name of the Student:
Name of the University:
Author’s Note:
Paraphrase This Document
Need a fresh take? Get an instant paraphrase of this document with our AI Paraphraser
1
MANAGEMENT ACCOUNTING
Table of Contents
Part A.................................................................................................................................2
Formulation of Master Budget........................................................................................2
Part B.................................................................................................................................8
Analysis of Production Program.....................................................................................8
Part C...............................................................................................................................10
Participative Budget and Imposed Budget...................................................................10
Reference........................................................................................................................12

2
MANAGEMENT ACCOUNTING
Part A
Formulation of Master Budget
Figure 1: (Image Showing Sales Budget)
Source: (Created by Author)
Figure 2: (Image Showing Production Budget)
Source: (Created by Author)
MANAGEMENT ACCOUNTING
Part A
Formulation of Master Budget
Figure 1: (Image Showing Sales Budget)
Source: (Created by Author)
Figure 2: (Image Showing Production Budget)
Source: (Created by Author)
⊘ This is a preview!⊘
Do you want full access?
Subscribe today to unlock all pages.
Trusted by 1+ million students worldwide
3
MANAGEMENT ACCOUNTING
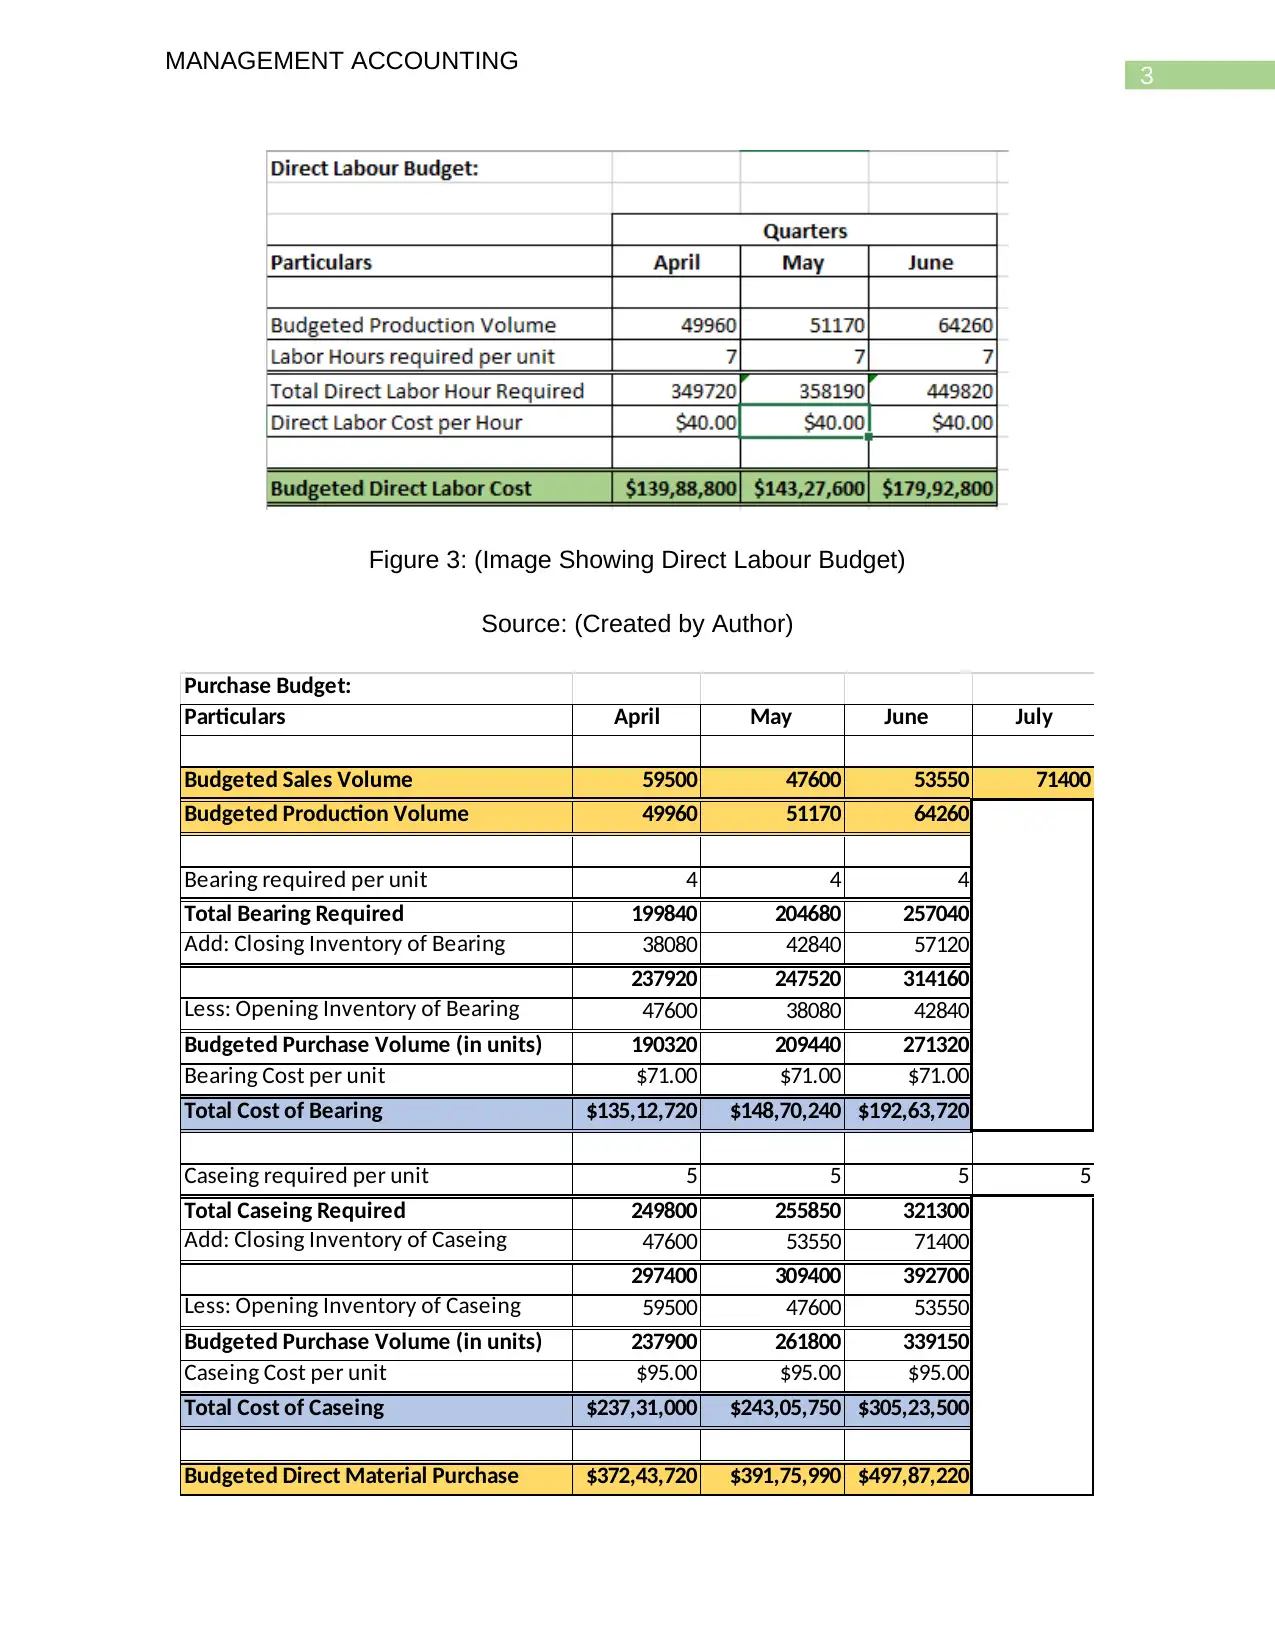
Figure 3: (Image Showing Direct Labour Budget)
Source: (Created by Author)
Purchase Budget:
Particulars April May June July
Budgeted Sales Volume 59500 47600 53550 71400
Budgeted Production Volume 49960 51170 64260
Bearing required per unit 4 4 4
Total Bearing Required 199840 204680 257040
Add: Closing Inventory of Bearing 38080 42840 57120
237920 247520 314160
Less: Opening Inventory of Bearing 47600 38080 42840
Budgeted Purchase Volume (in units) 190320 209440 271320
Bearing Cost per unit $71.00 $71.00 $71.00
Total Cost of Bearing $135,12,720 $148,70,240 $192,63,720
Caseing required per unit 5 5 5 5
Total Caseing Required 249800 255850 321300
Add: Closing Inventory of Caseing 47600 53550 71400
297400 309400 392700
Less: Opening Inventory of Caseing 59500 47600 53550
Budgeted Purchase Volume (in units) 237900 261800 339150
Caseing Cost per unit $95.00 $95.00 $95.00
Total Cost of Caseing $237,31,000 $243,05,750 $305,23,500
Budgeted Direct Material Purchase $372,43,720 $391,75,990 $497,87,220
MANAGEMENT ACCOUNTING
Figure 3: (Image Showing Direct Labour Budget)
Source: (Created by Author)
Purchase Budget:
Particulars April May June July
Budgeted Sales Volume 59500 47600 53550 71400
Budgeted Production Volume 49960 51170 64260
Bearing required per unit 4 4 4
Total Bearing Required 199840 204680 257040
Add: Closing Inventory of Bearing 38080 42840 57120
237920 247520 314160
Less: Opening Inventory of Bearing 47600 38080 42840
Budgeted Purchase Volume (in units) 190320 209440 271320
Bearing Cost per unit $71.00 $71.00 $71.00
Total Cost of Bearing $135,12,720 $148,70,240 $192,63,720
Caseing required per unit 5 5 5 5
Total Caseing Required 249800 255850 321300
Add: Closing Inventory of Caseing 47600 53550 71400
297400 309400 392700
Less: Opening Inventory of Caseing 59500 47600 53550
Budgeted Purchase Volume (in units) 237900 261800 339150
Caseing Cost per unit $95.00 $95.00 $95.00
Total Cost of Caseing $237,31,000 $243,05,750 $305,23,500
Budgeted Direct Material Purchase $372,43,720 $391,75,990 $497,87,220
Paraphrase This Document
Need a fresh take? Get an instant paraphrase of this document with our AI Paraphraser

4
MANAGEMENT ACCOUNTING
Figure 4: (Image Showing Purchase Budget)
Source: (Created by Author)
Figure 5: (Image Showing Direct Material Budget)
Source: (Created by Author)
MANAGEMENT ACCOUNTING
Figure 4: (Image Showing Purchase Budget)
Source: (Created by Author)
Figure 5: (Image Showing Direct Material Budget)
Source: (Created by Author)

5
MANAGEMENT ACCOUNTING
Manufacturing Overhead Budget:
Particulars April May June
Direct Labour Hour 349720 358190 449820
Indirect Labor Cost per DLH $49.98 $49.98 $49.98
Total Indirect Labor Cost $174,79,006 $179,02,336 $224,82,004
Power Cost per DLH $4.76 $4.76 $4.76
Total Power Cost $16,64,667 $17,04,984 $21,41,143
Variable Maintenance Cost per unit $37.78 $37.78 $37.78
Variable Maintenance Cost $132,11,644 $135,31,622 $169,93,200
Fixed Maintenance $270,65,889 $270,65,889 $270,65,889
Total Maintenance Costs $402,77,533 $405,97,511 $440,59,089
Other Variable Cost per unit $35.70 $35.70 $35.70
Other Variable Cost $124,85,004 $127,87,383 $160,58,574
Other Fixed Cost $119,00,000 $119,00,000 $119,00,000
Other Manufacturing Costs $243,85,004 $246,87,383 $279,58,574
Supervision $333,20,000 $333,20,000 $333,20,000
Depreciation $29,75,000 $29,75,000 $29,75,000
Rates & Utilities $24,58,500 $24,58,500 $24,58,500
Budgeted Manufacturing Overhead $1225,59,710 $1236,45,715 $1353,94,310
Figure 6: (Image Showing Manufacturing Overhead Budget)
Source: (Created by Author)
⊘ This is a preview!⊘
Do you want full access?
Subscribe today to unlock all pages.
Trusted by 1+ million students worldwide
6
MANAGEMENT ACCOUNTING
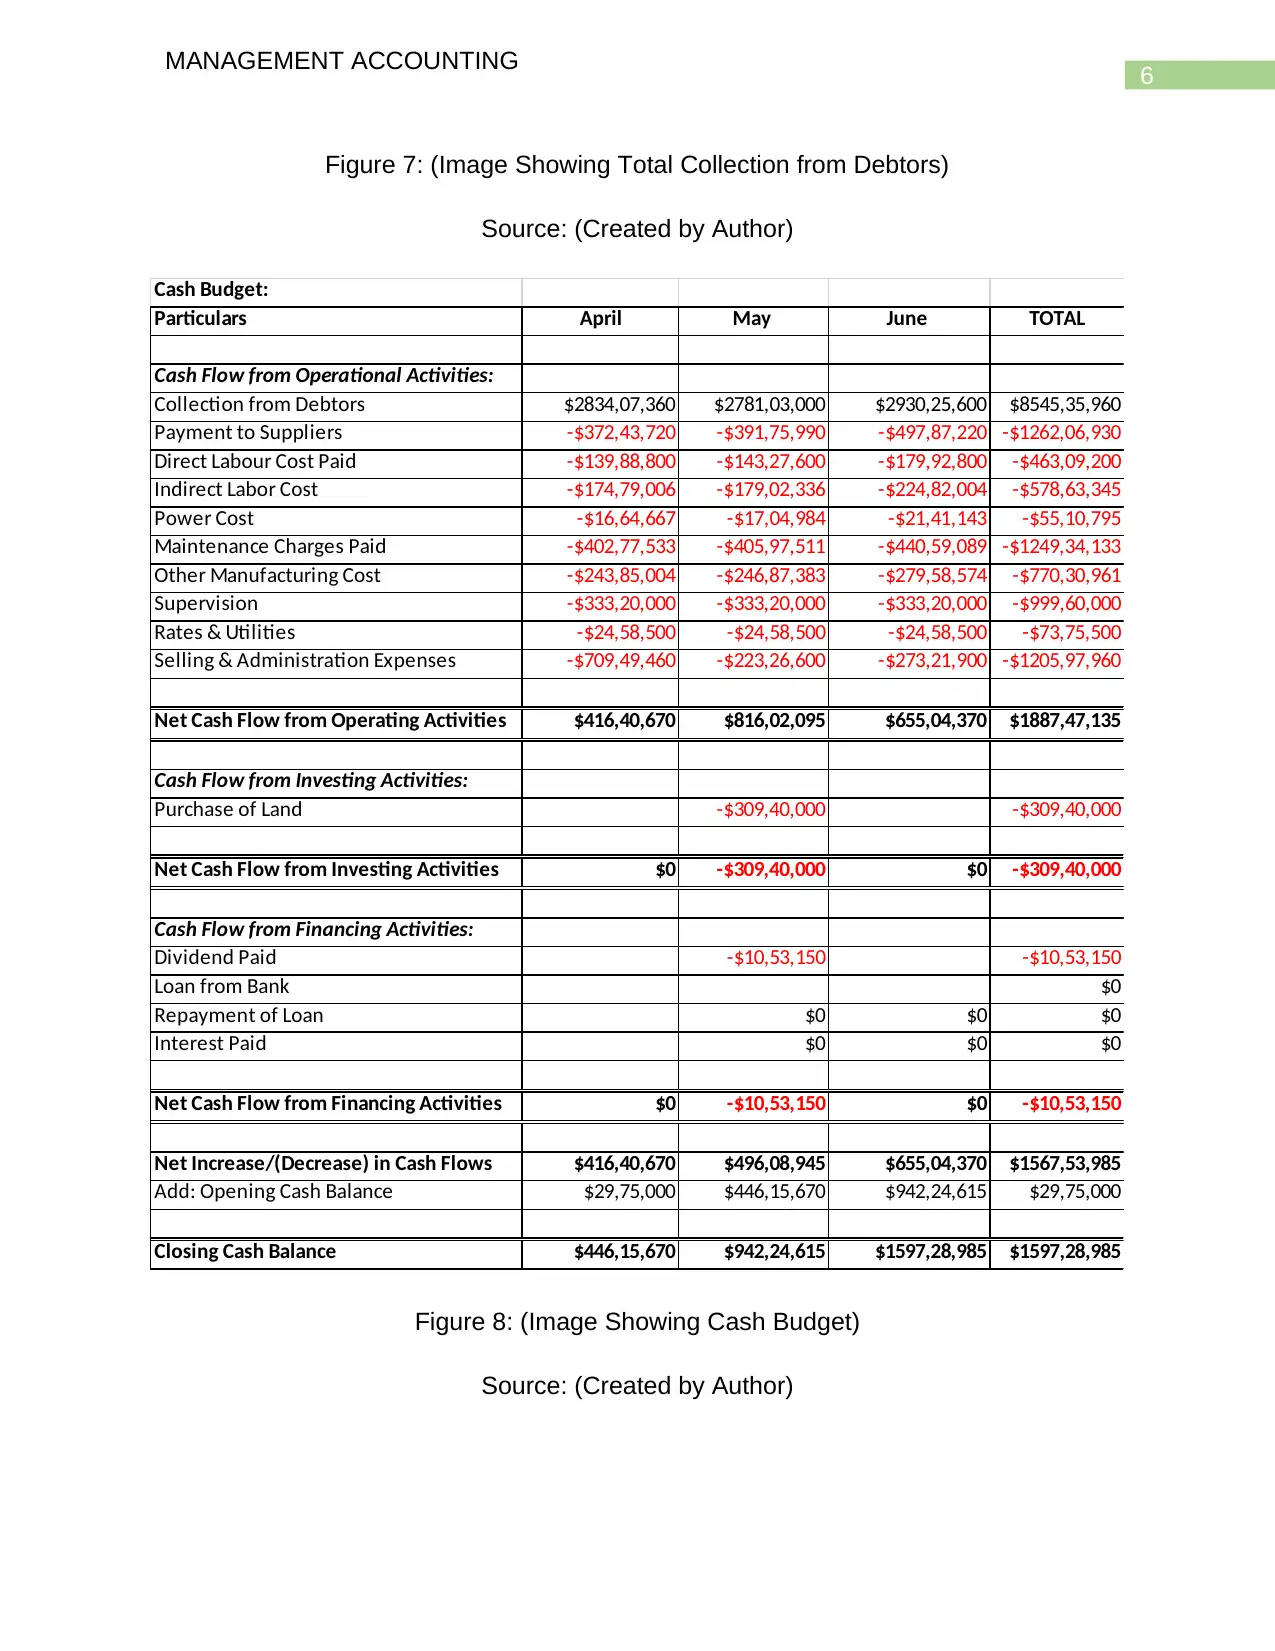
Figure 7: (Image Showing Total Collection from Debtors)
Source: (Created by Author)
Cash Budget:
Particulars April May June TOTAL
Cash Flow from Operational Activities:
Collection from Debtors $2834,07,360 $2781,03,000 $2930,25,600 $8545,35,960
Payment to Suppliers -$372,43,720 -$391,75,990 -$497,87,220 -$1262,06,930
Direct Labour Cost Paid -$139,88,800 -$143,27,600 -$179,92,800 -$463,09,200
Indirect Labor Cost -$174,79,006 -$179,02,336 -$224,82,004 -$578,63,345
Power Cost -$16,64,667 -$17,04,984 -$21,41,143 -$55,10,795
Maintenance Charges Paid -$402,77,533 -$405,97,511 -$440,59,089 -$1249,34,133
Other Manufacturing Cost -$243,85,004 -$246,87,383 -$279,58,574 -$770,30,961
Supervision -$333,20,000 -$333,20,000 -$333,20,000 -$999,60,000
Rates & Utilities -$24,58,500 -$24,58,500 -$24,58,500 -$73,75,500
Selling & Administration Expenses -$709,49,460 -$223,26,600 -$273,21,900 -$1205,97,960
Net Cash Flow from Operating Activities $416,40,670 $816,02,095 $655,04,370 $1887,47,135
Cash Flow from Investing Activities:
Purchase of Land -$309,40,000 -$309,40,000
Net Cash Flow from Investing Activities $0 -$309,40,000 $0 -$309,40,000
Cash Flow from Financing Activities:
Dividend Paid -$10,53,150 -$10,53,150
Loan from Bank $0
Repayment of Loan $0 $0 $0
Interest Paid $0 $0 $0
Net Cash Flow from Financing Activities $0 -$10,53,150 $0 -$10,53,150
Net Increase/(Decrease) in Cash Flows $416,40,670 $496,08,945 $655,04,370 $1567,53,985
Add: Opening Cash Balance $29,75,000 $446,15,670 $942,24,615 $29,75,000
Closing Cash Balance $446,15,670 $942,24,615 $1597,28,985 $1597,28,985
Figure 8: (Image Showing Cash Budget)
Source: (Created by Author)
MANAGEMENT ACCOUNTING
Figure 7: (Image Showing Total Collection from Debtors)
Source: (Created by Author)
Cash Budget:
Particulars April May June TOTAL
Cash Flow from Operational Activities:
Collection from Debtors $2834,07,360 $2781,03,000 $2930,25,600 $8545,35,960
Payment to Suppliers -$372,43,720 -$391,75,990 -$497,87,220 -$1262,06,930
Direct Labour Cost Paid -$139,88,800 -$143,27,600 -$179,92,800 -$463,09,200
Indirect Labor Cost -$174,79,006 -$179,02,336 -$224,82,004 -$578,63,345
Power Cost -$16,64,667 -$17,04,984 -$21,41,143 -$55,10,795
Maintenance Charges Paid -$402,77,533 -$405,97,511 -$440,59,089 -$1249,34,133
Other Manufacturing Cost -$243,85,004 -$246,87,383 -$279,58,574 -$770,30,961
Supervision -$333,20,000 -$333,20,000 -$333,20,000 -$999,60,000
Rates & Utilities -$24,58,500 -$24,58,500 -$24,58,500 -$73,75,500
Selling & Administration Expenses -$709,49,460 -$223,26,600 -$273,21,900 -$1205,97,960
Net Cash Flow from Operating Activities $416,40,670 $816,02,095 $655,04,370 $1887,47,135
Cash Flow from Investing Activities:
Purchase of Land -$309,40,000 -$309,40,000
Net Cash Flow from Investing Activities $0 -$309,40,000 $0 -$309,40,000
Cash Flow from Financing Activities:
Dividend Paid -$10,53,150 -$10,53,150
Loan from Bank $0
Repayment of Loan $0 $0 $0
Interest Paid $0 $0 $0
Net Cash Flow from Financing Activities $0 -$10,53,150 $0 -$10,53,150
Net Increase/(Decrease) in Cash Flows $416,40,670 $496,08,945 $655,04,370 $1567,53,985
Add: Opening Cash Balance $29,75,000 $446,15,670 $942,24,615 $29,75,000
Closing Cash Balance $446,15,670 $942,24,615 $1597,28,985 $1597,28,985
Figure 8: (Image Showing Cash Budget)
Source: (Created by Author)
Paraphrase This Document
Need a fresh take? Get an instant paraphrase of this document with our AI Paraphraser
7
MANAGEMENT ACCOUNTING
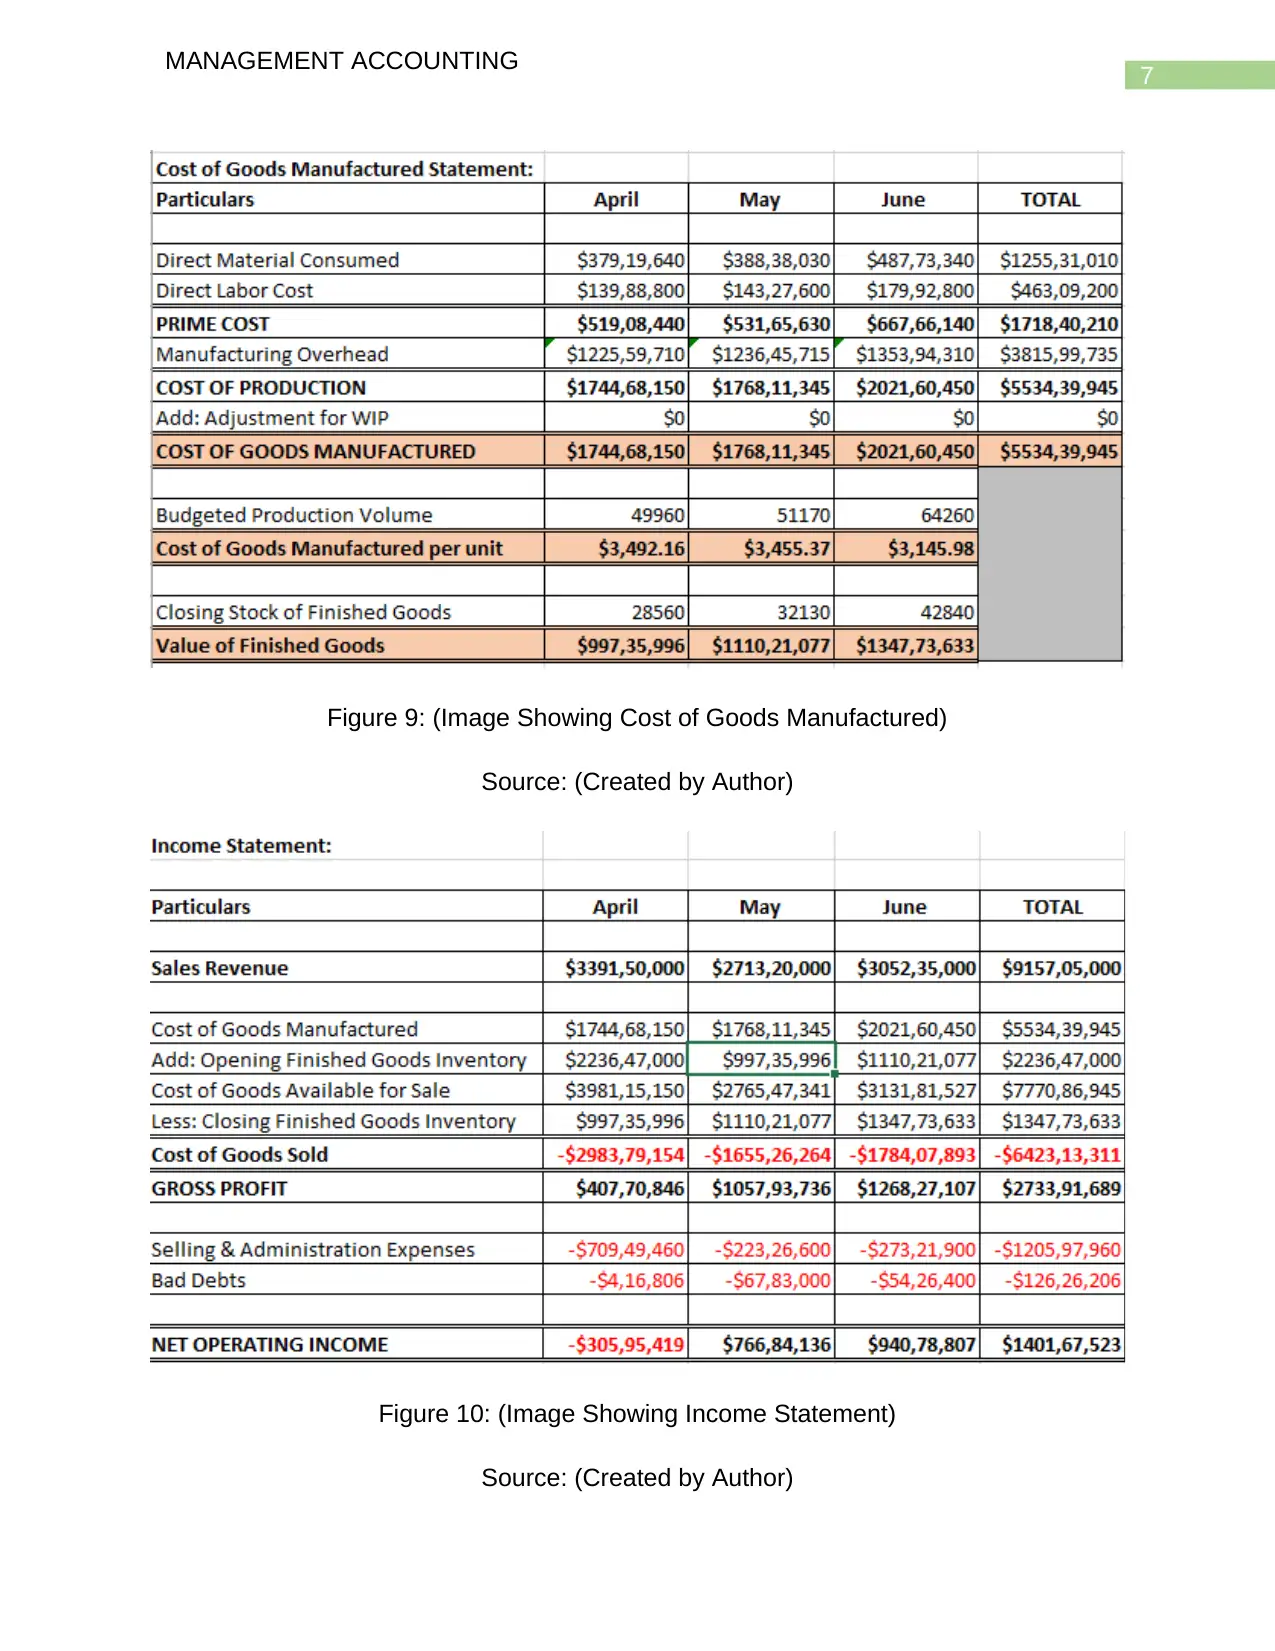
Figure 9: (Image Showing Cost of Goods Manufactured)
Source: (Created by Author)
Figure 10: (Image Showing Income Statement)
Source: (Created by Author)
MANAGEMENT ACCOUNTING
Figure 9: (Image Showing Cost of Goods Manufactured)
Source: (Created by Author)
Figure 10: (Image Showing Income Statement)
Source: (Created by Author)
8
MANAGEMENT ACCOUNTING
Part B
Analysis of Production Program
The sales manager of Weiming Pty ltd is considering introducing a new
production program which can benefit the company and thereby increase the production
volume of the business. The sales manager is of the opinion that the new production
plan will be increasing the revenue of the company but in order to be sure the
management will be preparing a master budget which will be estimating the revenue
and the costs which are associated with the production plan (Cox 2014). The analysis of
the budget is discussed in the paragraph which are given below.
As per the budget which is prepared by the company, the sales budget shows
that the sales volume has decreased from the month of April to May and then it has
again increased from May to June. The sales volume has further increased from 53550
in June to 71400 in July. The Budgeted sales revenue is shown to be $ 4069,80,000 in
the month of July which is due to the increase in the production units (Hutchings et al.
2014). The production budget shows that the production volume of the company has
increased from April which was 49960 and has become 64260 in the month of June
which shows the increase in the production of the company. Such an increase in the
production is estimated due to the increase in the production capacity of the company.
The direct material budget shows that it is estimated that the direct labour hours which
are required to achieve the production target will also increase with the increase in the
production volume of the company (Brown and Koettl 2015). The direct labour hour
which is anticipated in the month of June which is highest in terms of production volume
shows that 449820 hours will be required. The budgeted direct labour cost which are
incurred is estimated to be highest in the month of June as per the quarterly analysis
which is shown to be $ 179,92,800 as per the budget. As the sales volume and
production volume is expected to increase and reach a highest by the month of June,
the direct material requirement will also be high (Drury 2013). The material which is
used by the business is bearing which is estimated to cost $ 192,63,720 in the month of
June which shows a tremendous increase as per the estimate for the month of May
which was $ 148,70,240. The cost of caseing is estimated to be $ 305,23,500 for the
⊘ This is a preview!⊘
Do you want full access?
Subscribe today to unlock all pages.
Trusted by 1+ million students worldwide
9
MANAGEMENT ACCOUNTING
month of June. The combined cost of Bearing and Caseing gives the estimated direct
material costs as shown in the calculations above.
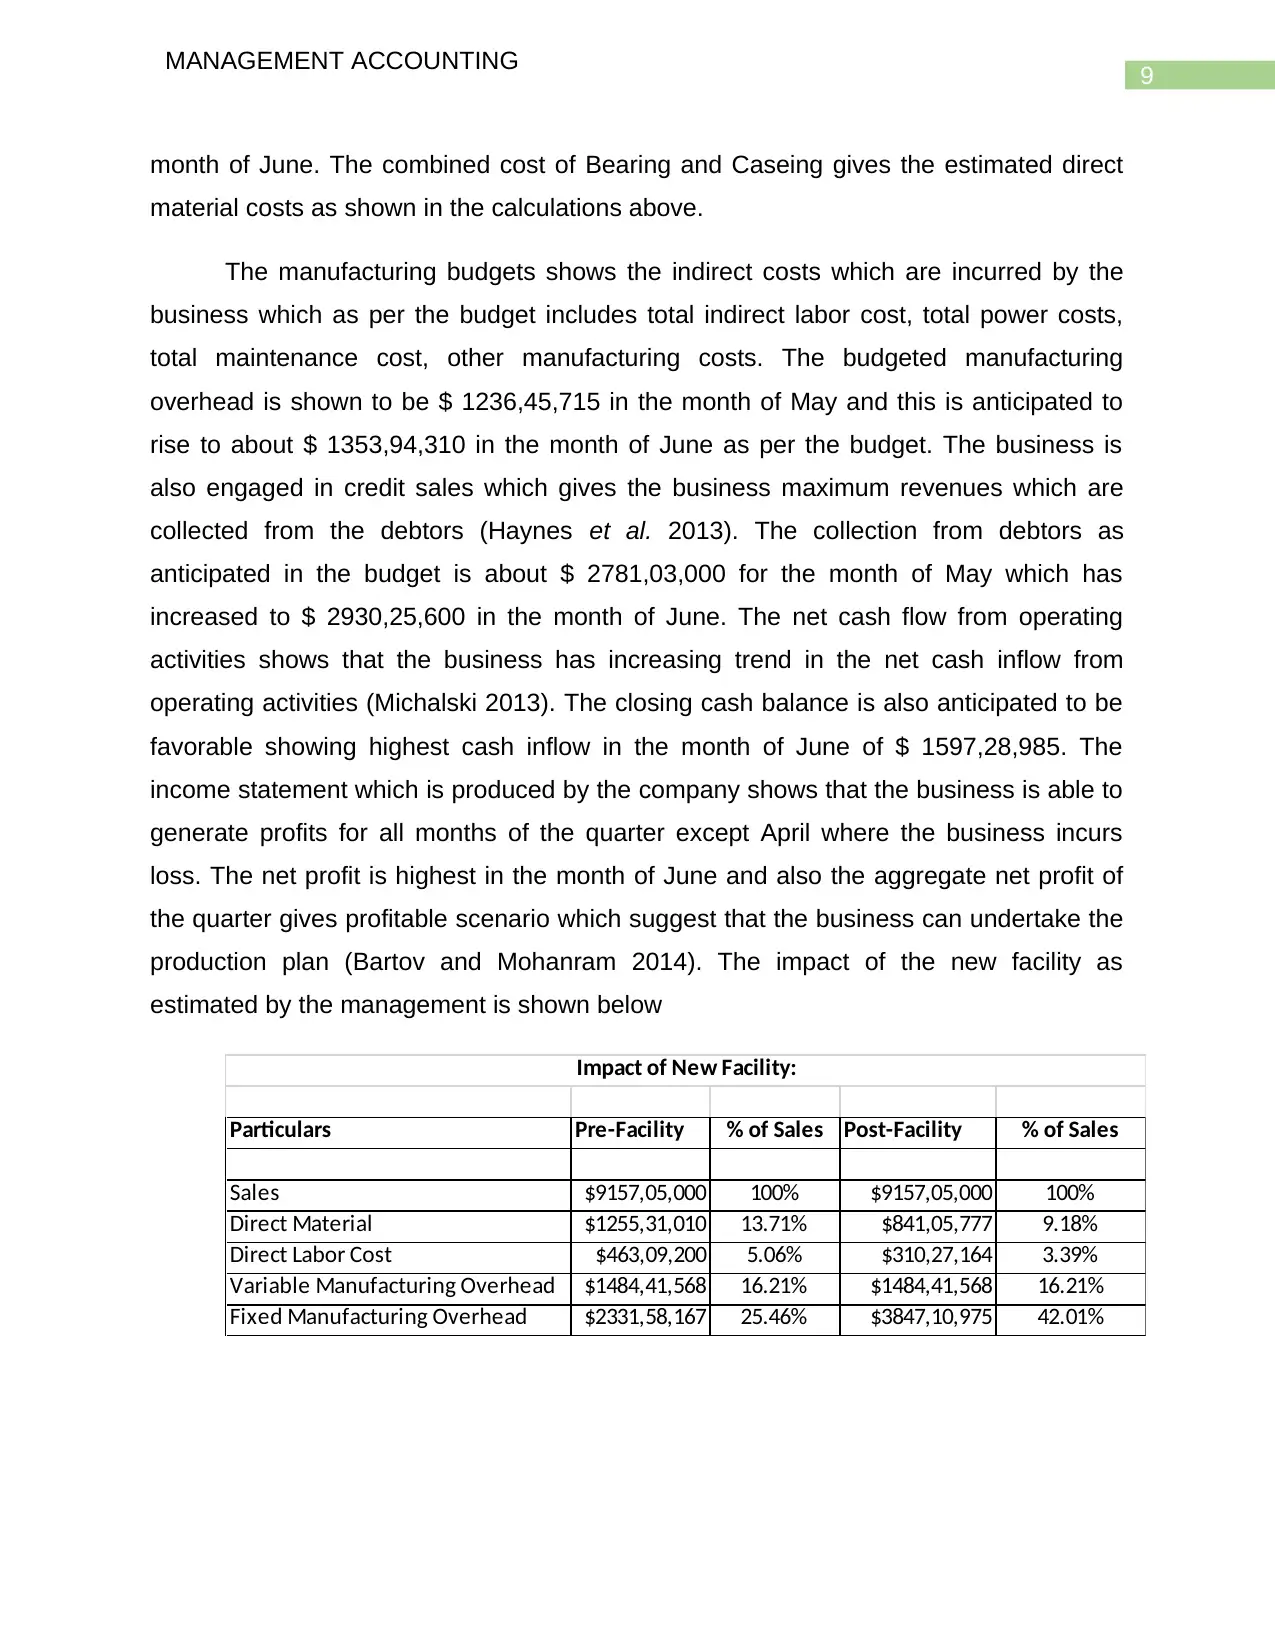
The manufacturing budgets shows the indirect costs which are incurred by the
business which as per the budget includes total indirect labor cost, total power costs,
total maintenance cost, other manufacturing costs. The budgeted manufacturing
overhead is shown to be $ 1236,45,715 in the month of May and this is anticipated to
rise to about $ 1353,94,310 in the month of June as per the budget. The business is
also engaged in credit sales which gives the business maximum revenues which are
collected from the debtors (Haynes et al. 2013). The collection from debtors as
anticipated in the budget is about $ 2781,03,000 for the month of May which has
increased to $ 2930,25,600 in the month of June. The net cash flow from operating
activities shows that the business has increasing trend in the net cash inflow from
operating activities (Michalski 2013). The closing cash balance is also anticipated to be
favorable showing highest cash inflow in the month of June of $ 1597,28,985. The
income statement which is produced by the company shows that the business is able to
generate profits for all months of the quarter except April where the business incurs
loss. The net profit is highest in the month of June and also the aggregate net profit of
the quarter gives profitable scenario which suggest that the business can undertake the
production plan (Bartov and Mohanram 2014). The impact of the new facility as
estimated by the management is shown below
Particulars Pre-Facility % of Sales Post-Facility % of Sales
Sales $9157,05,000 100% $9157,05,000 100%
Direct Material $1255,31,010 13.71% $841,05,777 9.18%
Direct Labor Cost $463,09,200 5.06% $310,27,164 3.39%
Variable Manufacturing Overhead $1484,41,568 16.21% $1484,41,568 16.21%
Fixed Manufacturing Overhead $2331,58,167 25.46% $3847,10,975 42.01%
Impact of New Facility:
MANAGEMENT ACCOUNTING
month of June. The combined cost of Bearing and Caseing gives the estimated direct
material costs as shown in the calculations above.
The manufacturing budgets shows the indirect costs which are incurred by the
business which as per the budget includes total indirect labor cost, total power costs,
total maintenance cost, other manufacturing costs. The budgeted manufacturing
overhead is shown to be $ 1236,45,715 in the month of May and this is anticipated to
rise to about $ 1353,94,310 in the month of June as per the budget. The business is
also engaged in credit sales which gives the business maximum revenues which are
collected from the debtors (Haynes et al. 2013). The collection from debtors as
anticipated in the budget is about $ 2781,03,000 for the month of May which has
increased to $ 2930,25,600 in the month of June. The net cash flow from operating
activities shows that the business has increasing trend in the net cash inflow from
operating activities (Michalski 2013). The closing cash balance is also anticipated to be
favorable showing highest cash inflow in the month of June of $ 1597,28,985. The
income statement which is produced by the company shows that the business is able to
generate profits for all months of the quarter except April where the business incurs
loss. The net profit is highest in the month of June and also the aggregate net profit of
the quarter gives profitable scenario which suggest that the business can undertake the
production plan (Bartov and Mohanram 2014). The impact of the new facility as
estimated by the management is shown below
Particulars Pre-Facility % of Sales Post-Facility % of Sales
Sales $9157,05,000 100% $9157,05,000 100%
Direct Material $1255,31,010 13.71% $841,05,777 9.18%
Direct Labor Cost $463,09,200 5.06% $310,27,164 3.39%
Variable Manufacturing Overhead $1484,41,568 16.21% $1484,41,568 16.21%
Fixed Manufacturing Overhead $2331,58,167 25.46% $3847,10,975 42.01%
Impact of New Facility:
Paraphrase This Document
Need a fresh take? Get an instant paraphrase of this document with our AI Paraphraser
10
MANAGEMENT ACCOUNTING
Part C
Participative Budget and Imposed Budget
A Participative Budget refers to a budget which is prepared with the collaboration
of the all the people who are affected by the implementation of the budget. In case of a
participative budget the employees are involved in the preparation of the budget and
participative approach towards budget preparation is also known as down to top budget
(Heinle, Ross and Saouma 2013). A participative budget is also favorable for the
business as it boasts the morale of the employees and also the employee are motivated
for achieving the goals or standards of the company as specified in the budget. Due to a
large number of employees are involved in a participative budget, therefore it takes
more time to be prepared than in the case of normal budget. The cost of labor for
preparing such a budget is also comparatively higher. In case of a participative budget
effective communication can flow between departments while preparation of the budget.
The basic idea which is behind the budget is that the subordinate should be assigned
responsibility regarding aspects of budget (Derfuss 2016). Such types of budget also
facilitate transferal of information from the subordinates to superior of the business. The
subordinates can discuss their problems with the superiors and this kind of a budget
involves every individual which is present in the organization who is affected or likely to
be affected by the activities of the budget.
In case of an imposed budget, the budgets are prepared by the top-level
managers and then imposed down on the lower level management of the company. In
preparation of such a budget, there is not input taken from the lower level employee of
the organization and the objectives and decisions are imposed on such employees
(Allard et al. 2013). These types of budgets are also known as top to bottom budgets as
they are prepared by the top-level management and imposed on the lower level
management. This type of approach for preparation of budget is less costly and more
direct but it lacks the participation and thus the human touch and it does not facilitate
communication between the top-level management and the lower-level management.
11
MANAGEMENT ACCOUNTING
In case of participatory budget, the company which has been analyzed in Part B
of the assignment would be preparing budgets with the collective collaboration of all
departments which are present in the business. The budget would be prepared with the
collective effort of all the employees of the business. On the other hand, if the
management uses imposed budget than all the vital decision is taken by the
management and there is little or no participation of the staff and lower level
management. It can be said that a participative budget is more effective for
implementing the strategies and objectives of the business.
⊘ This is a preview!⊘
Do you want full access?
Subscribe today to unlock all pages.
Trusted by 1+ million students worldwide
1 out of 14
Related Documents


Your All-in-One AI-Powered Toolkit for Academic Success.
+13062052269
info@desklib.com
Available 24*7 on WhatsApp / Email
![[object Object]](/_next/static/media/star-bottom.7253800d.svg)
Unlock your academic potential
Copyright © 2020–2026 A2Z Services. All Rights Reserved. Developed and managed by ZUCOL.