Management Accounting Report: Production Plan and Budgeting

Verified

Added on  2021/05/31

|16
|2187
|19
Report
AI Summary
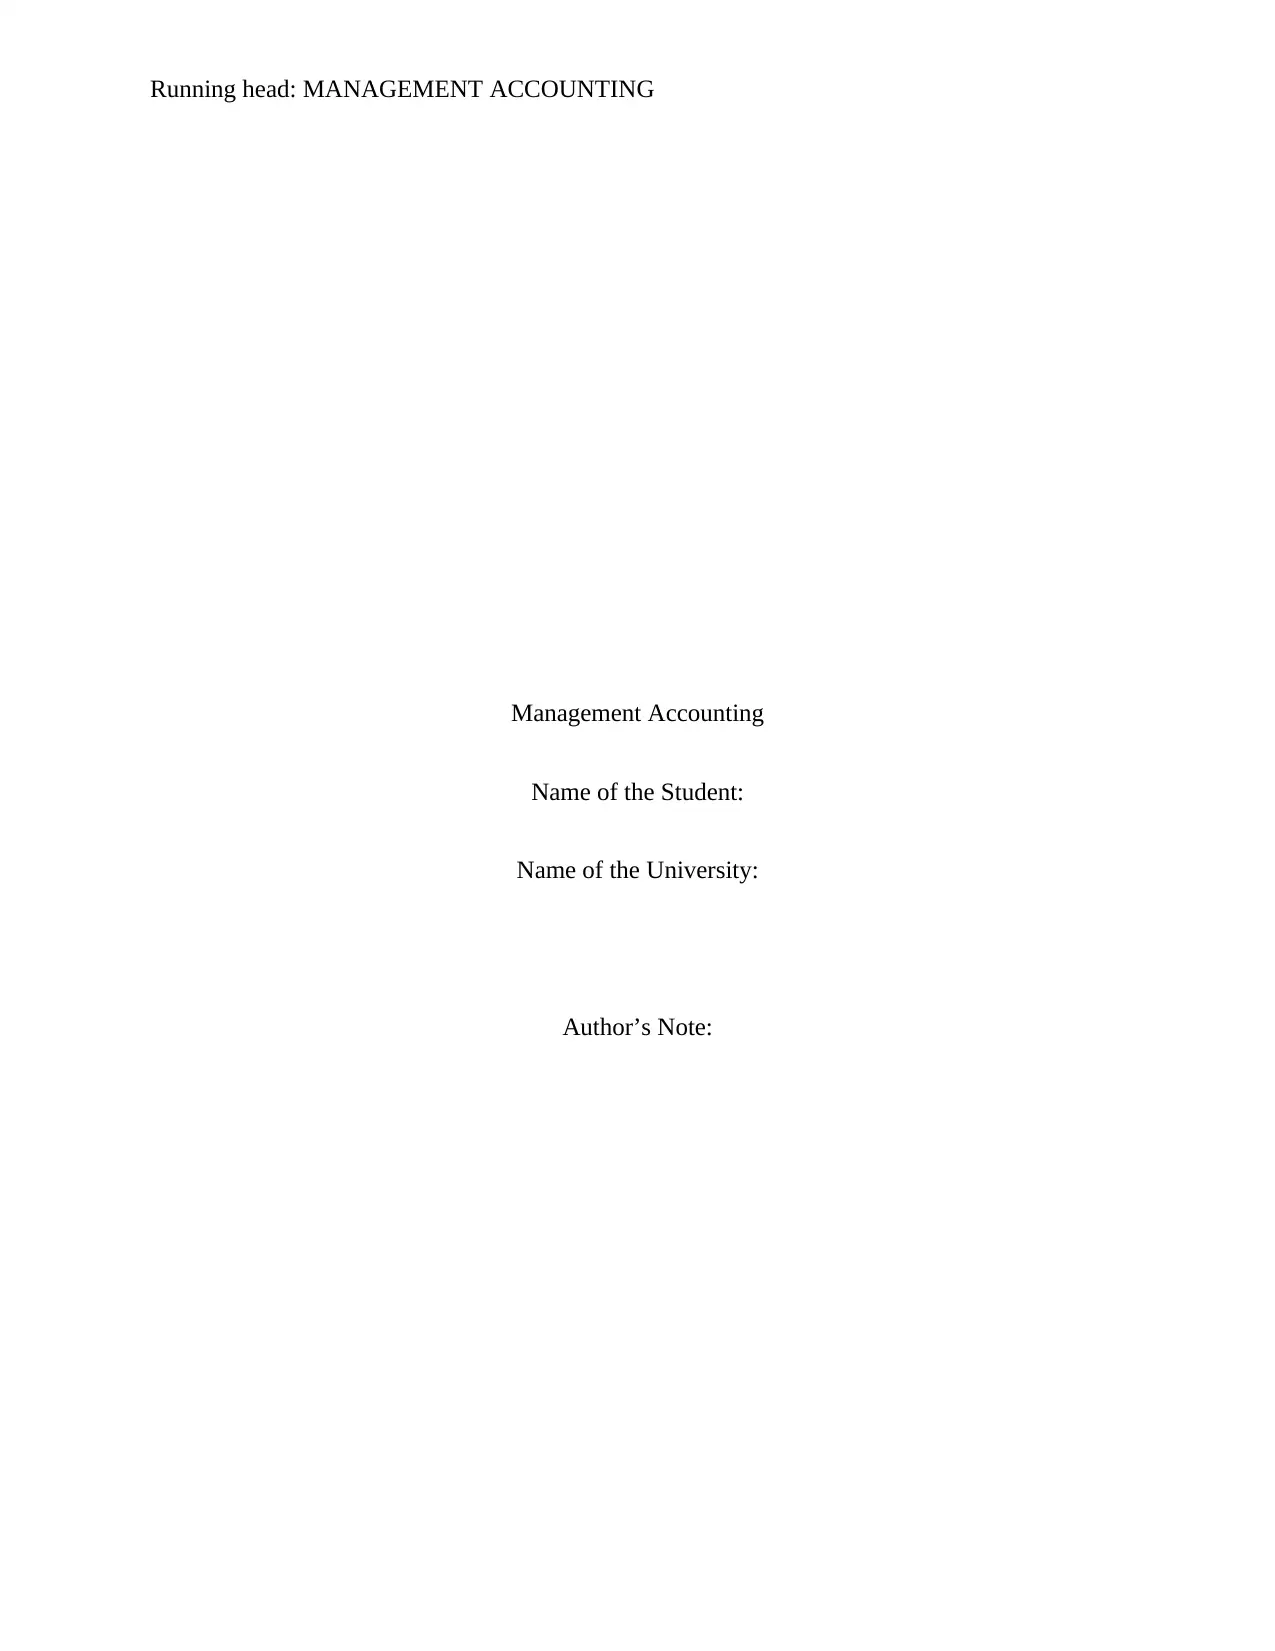
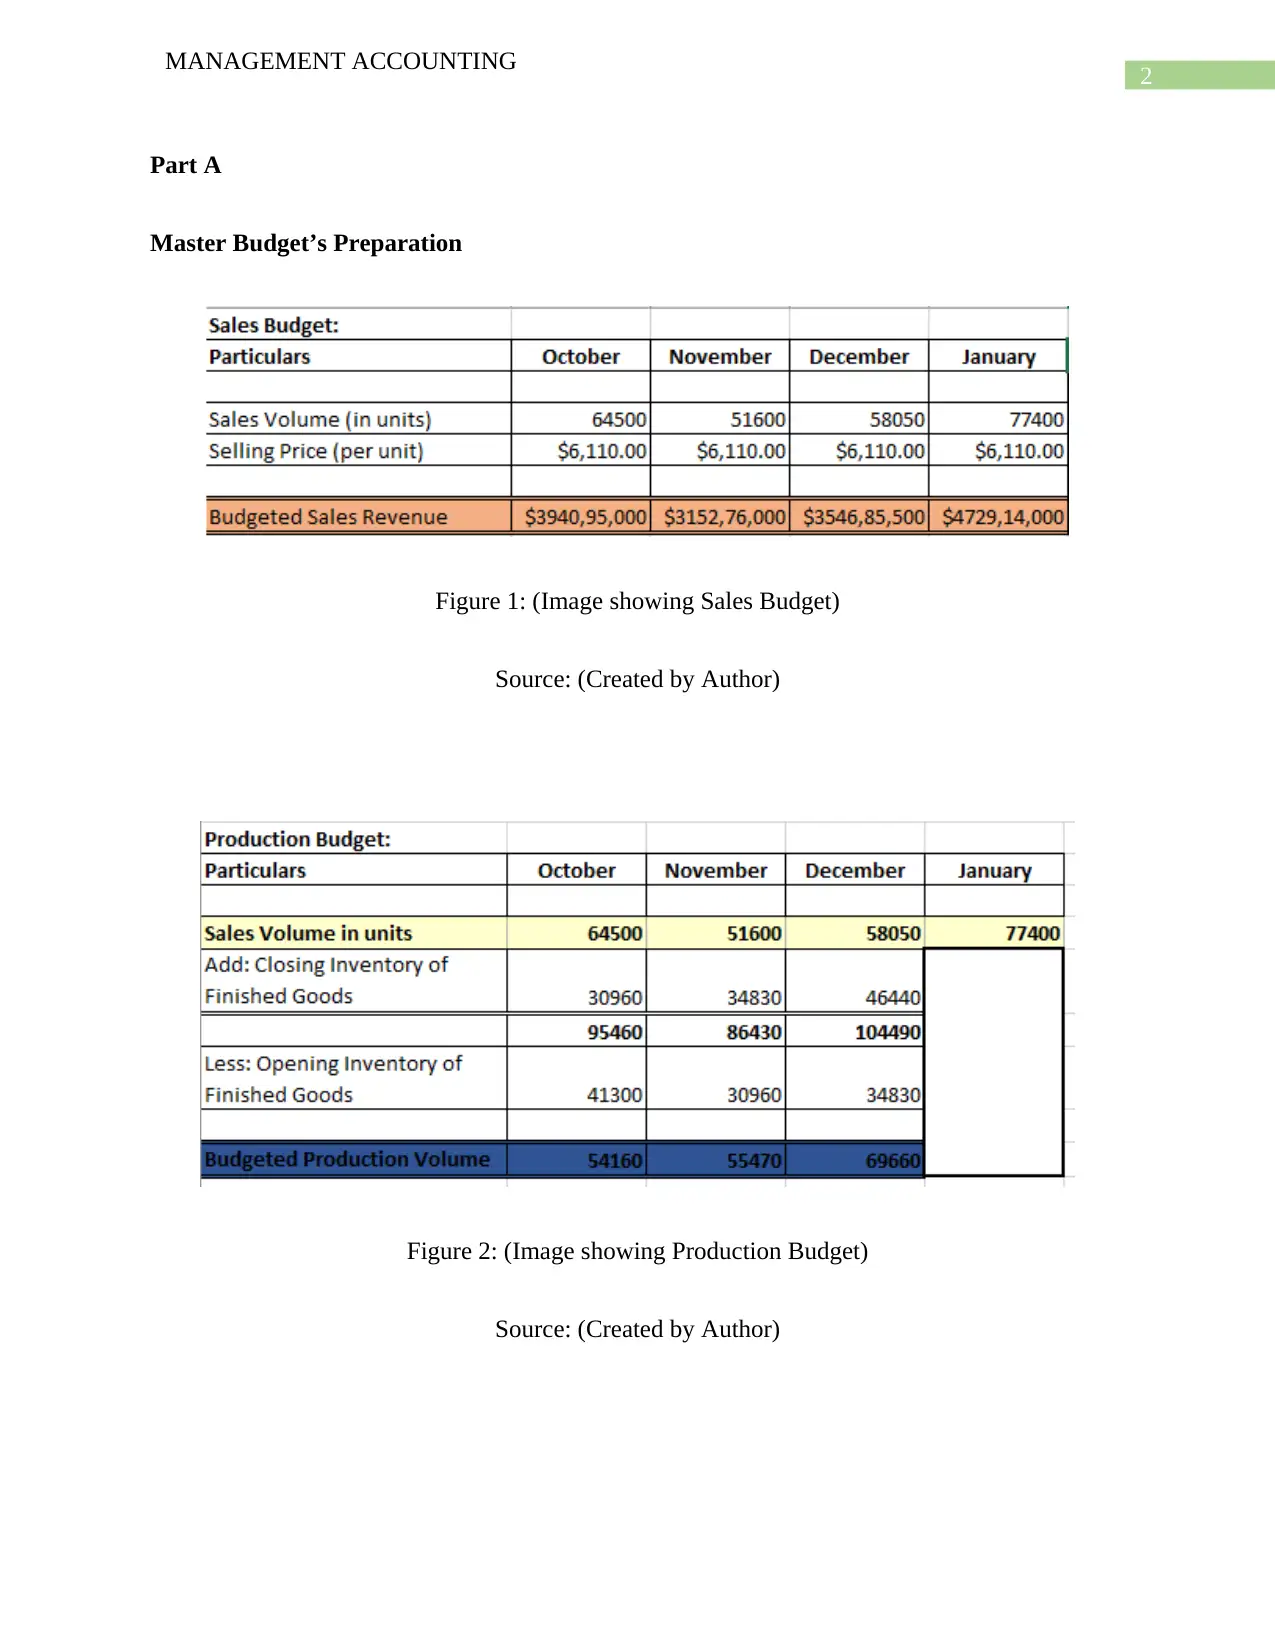
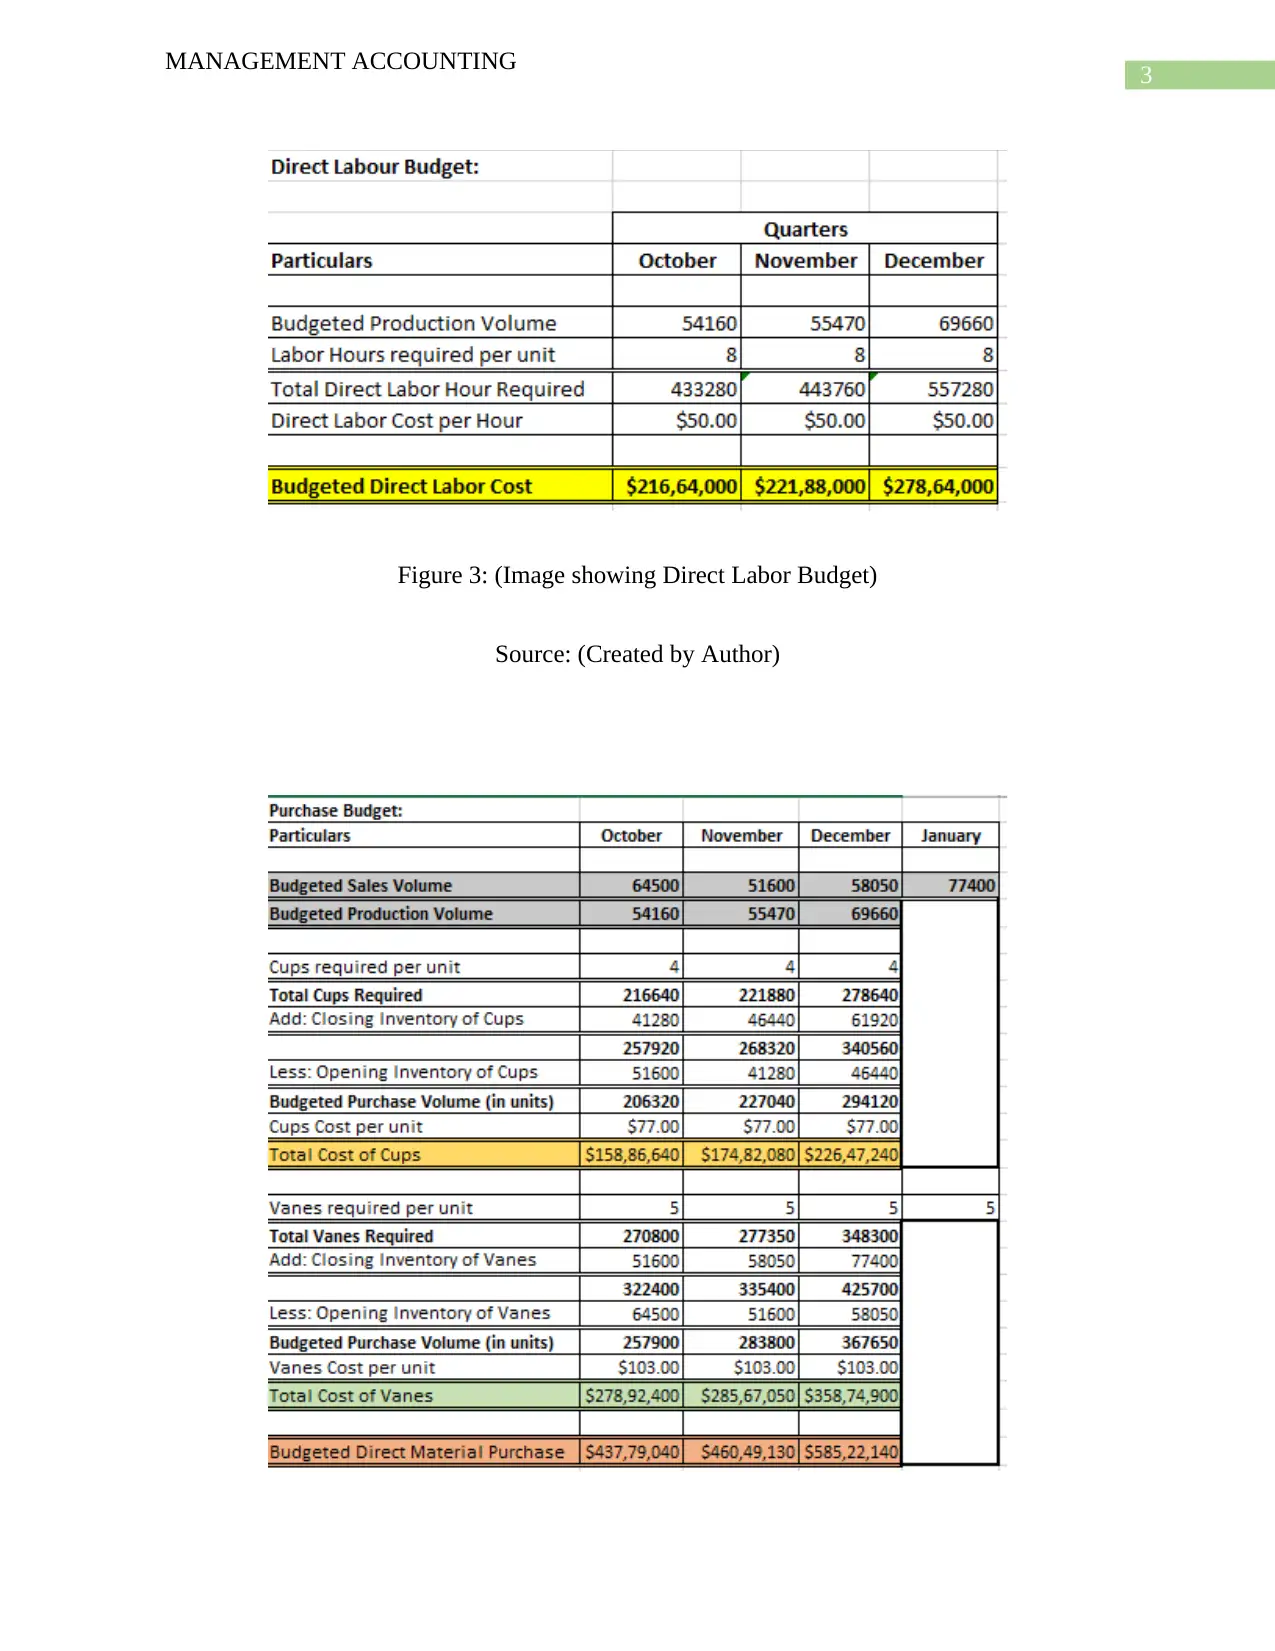
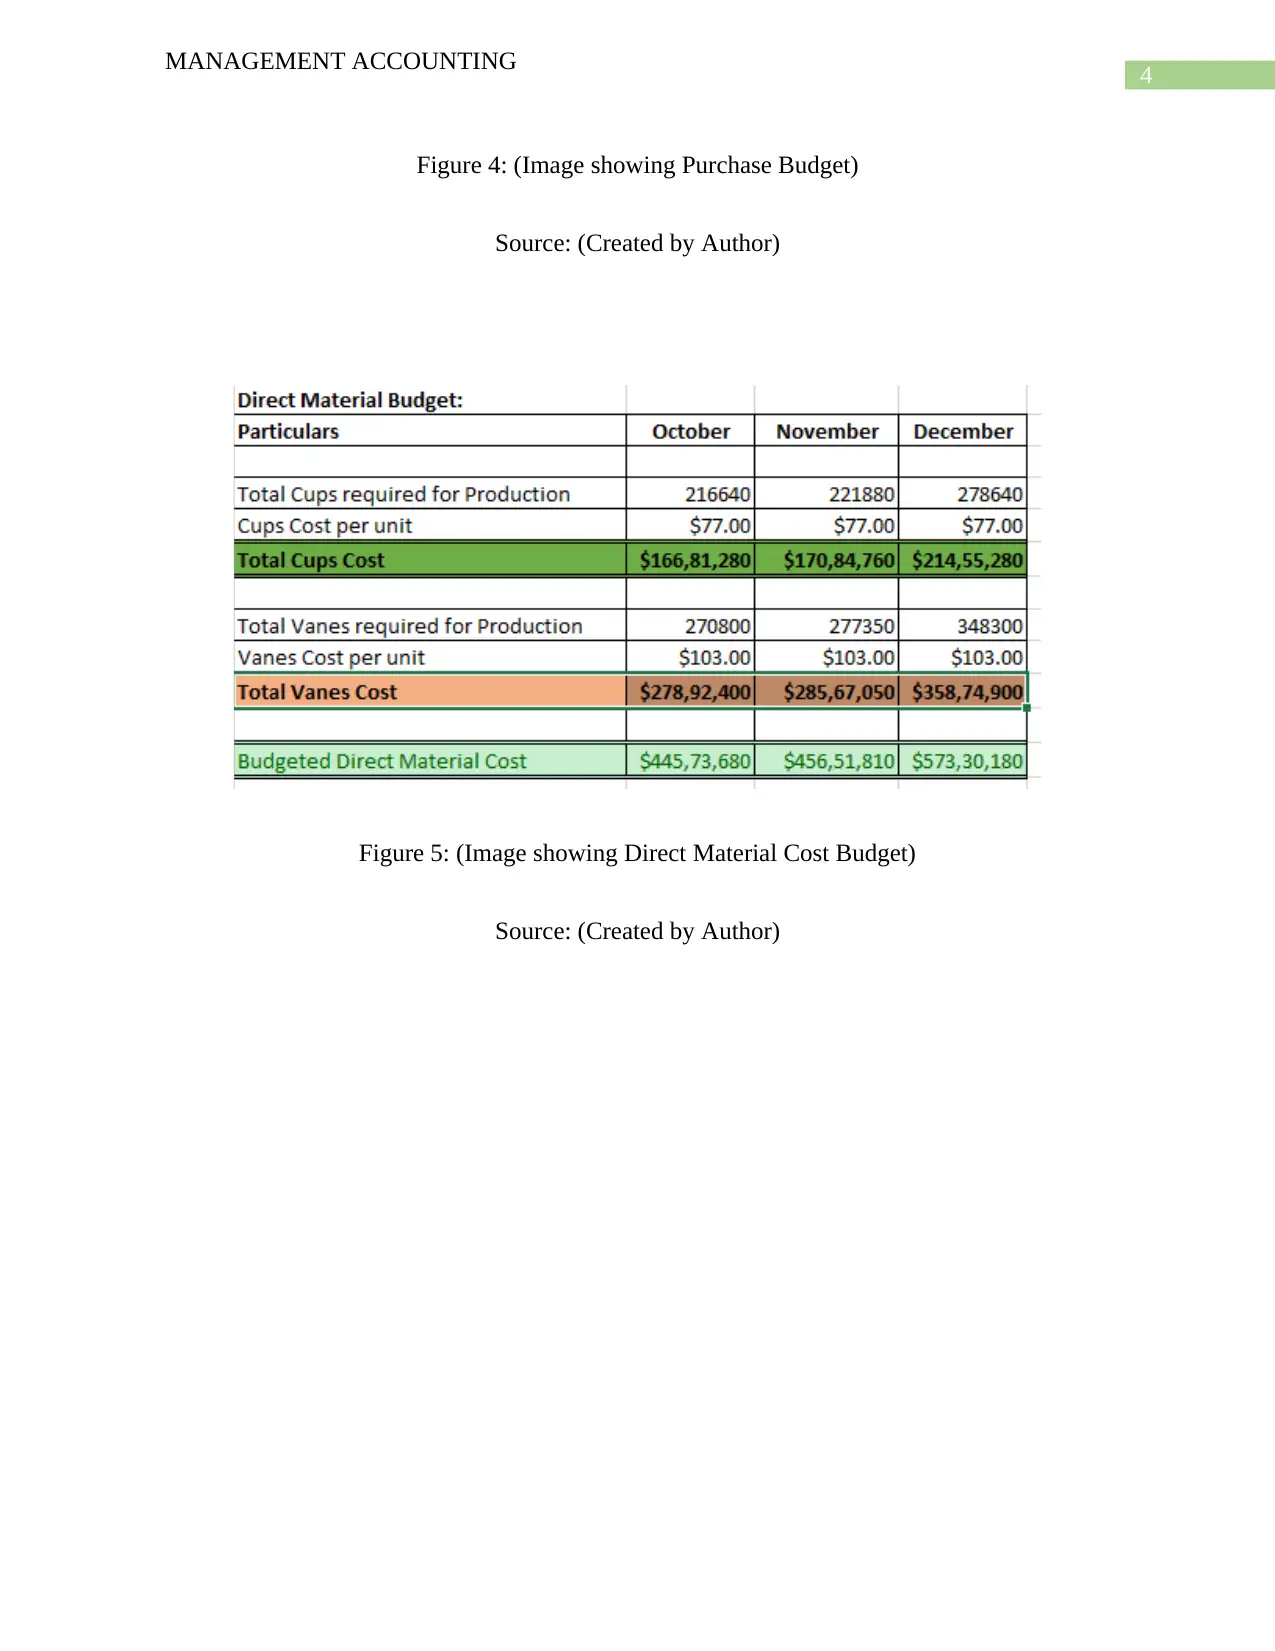
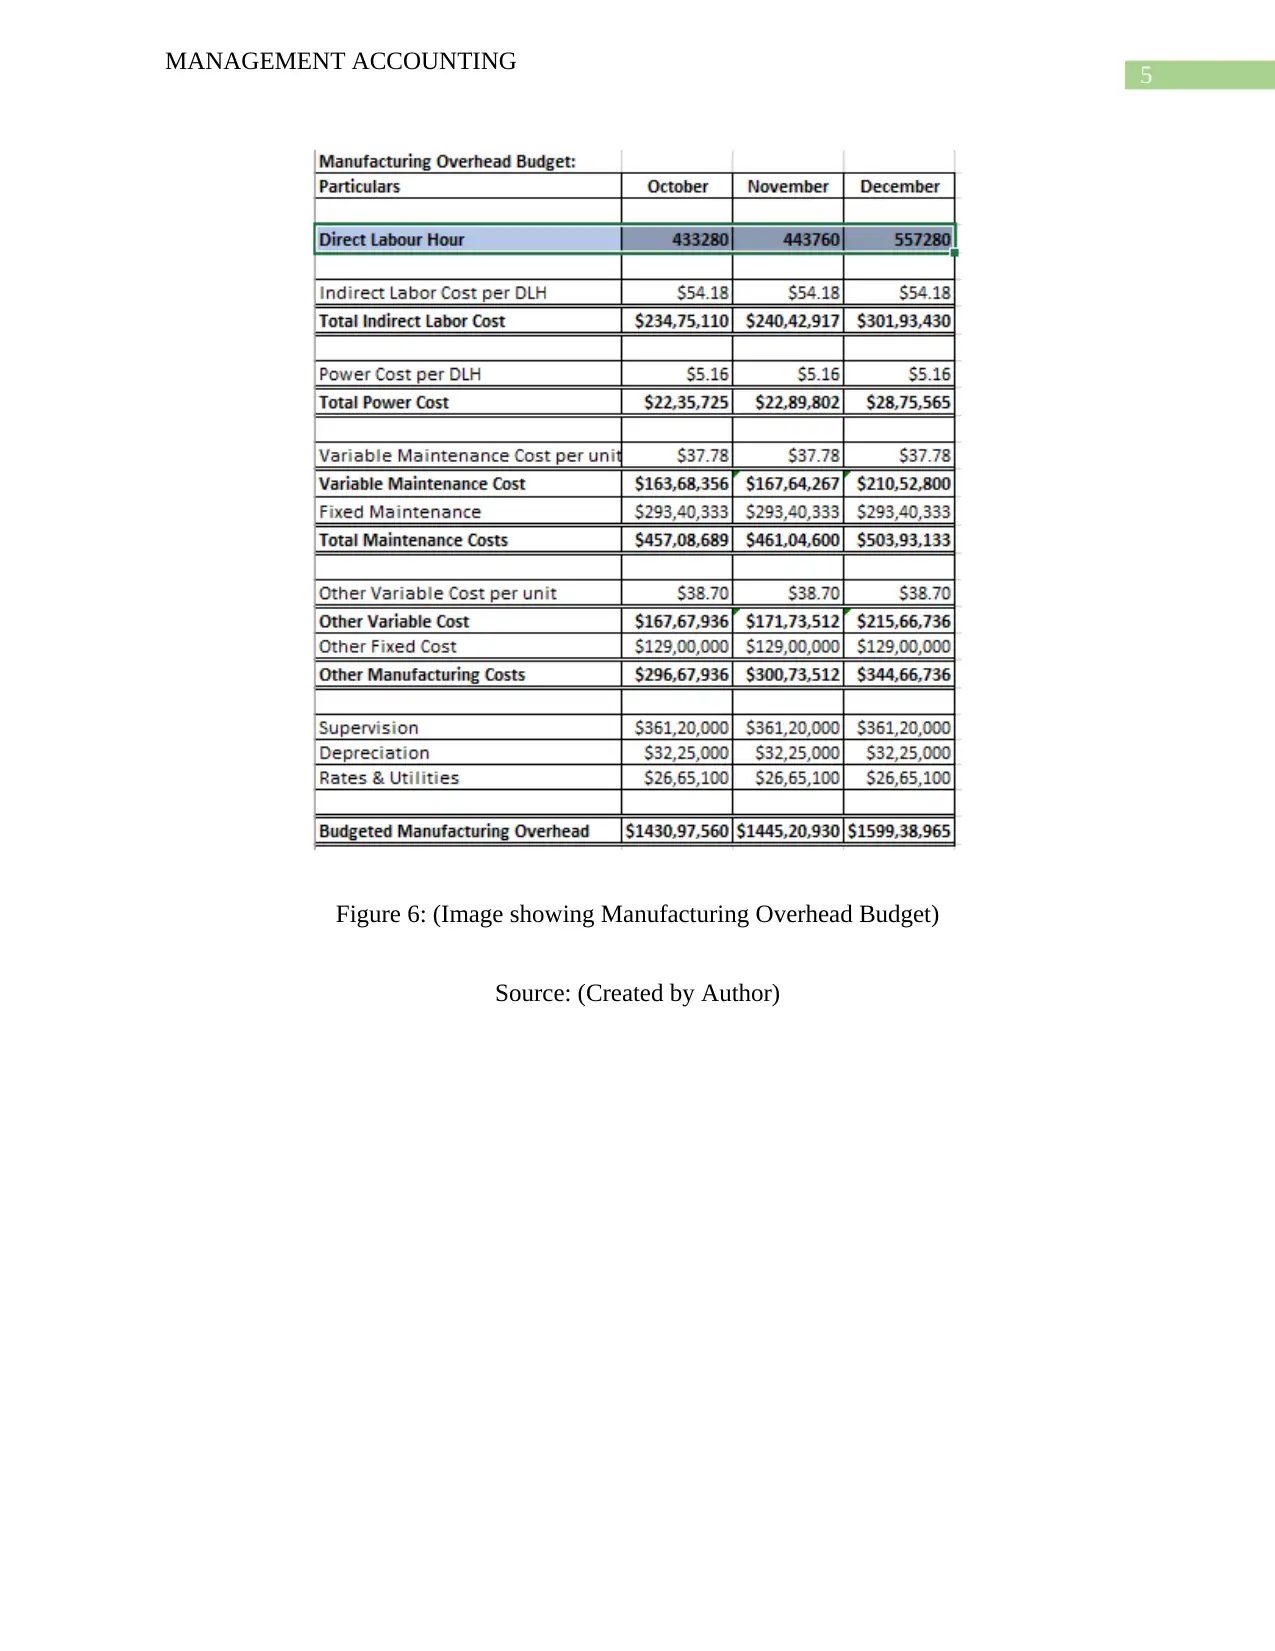
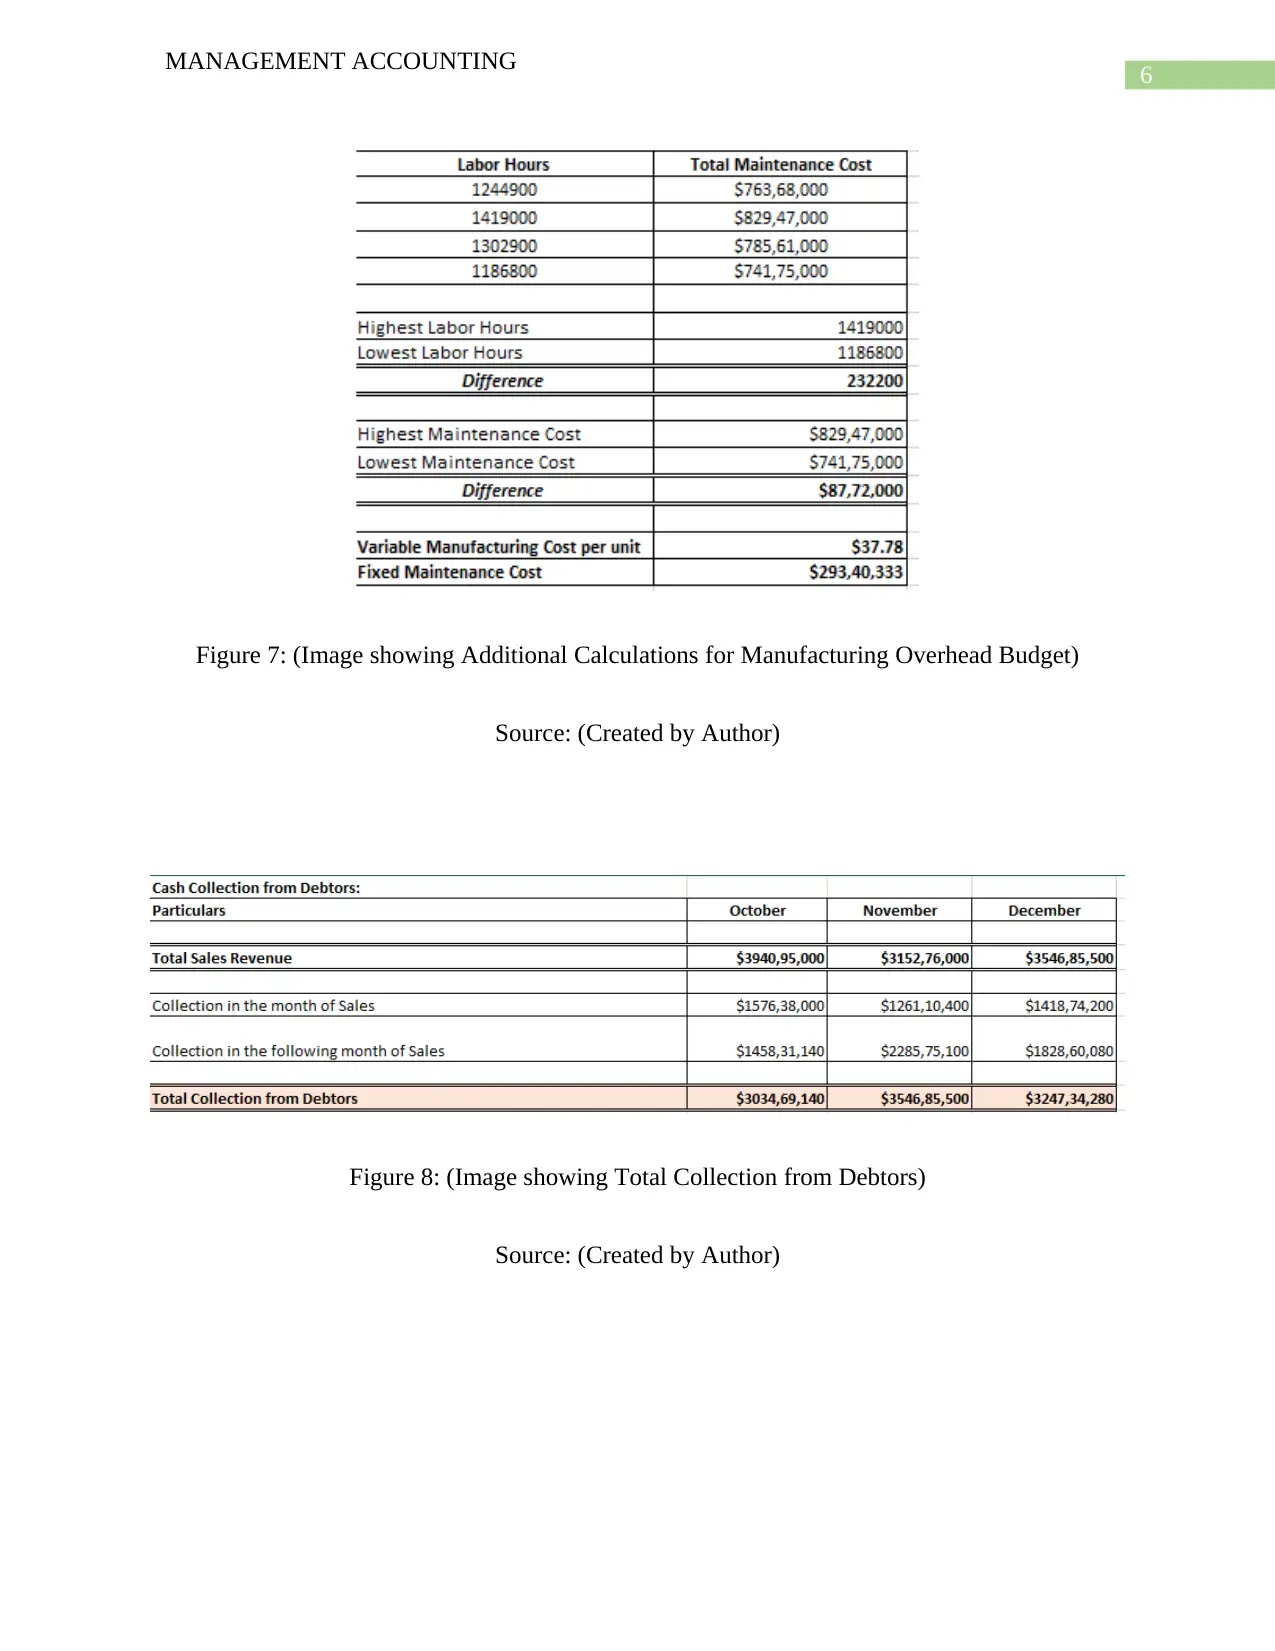
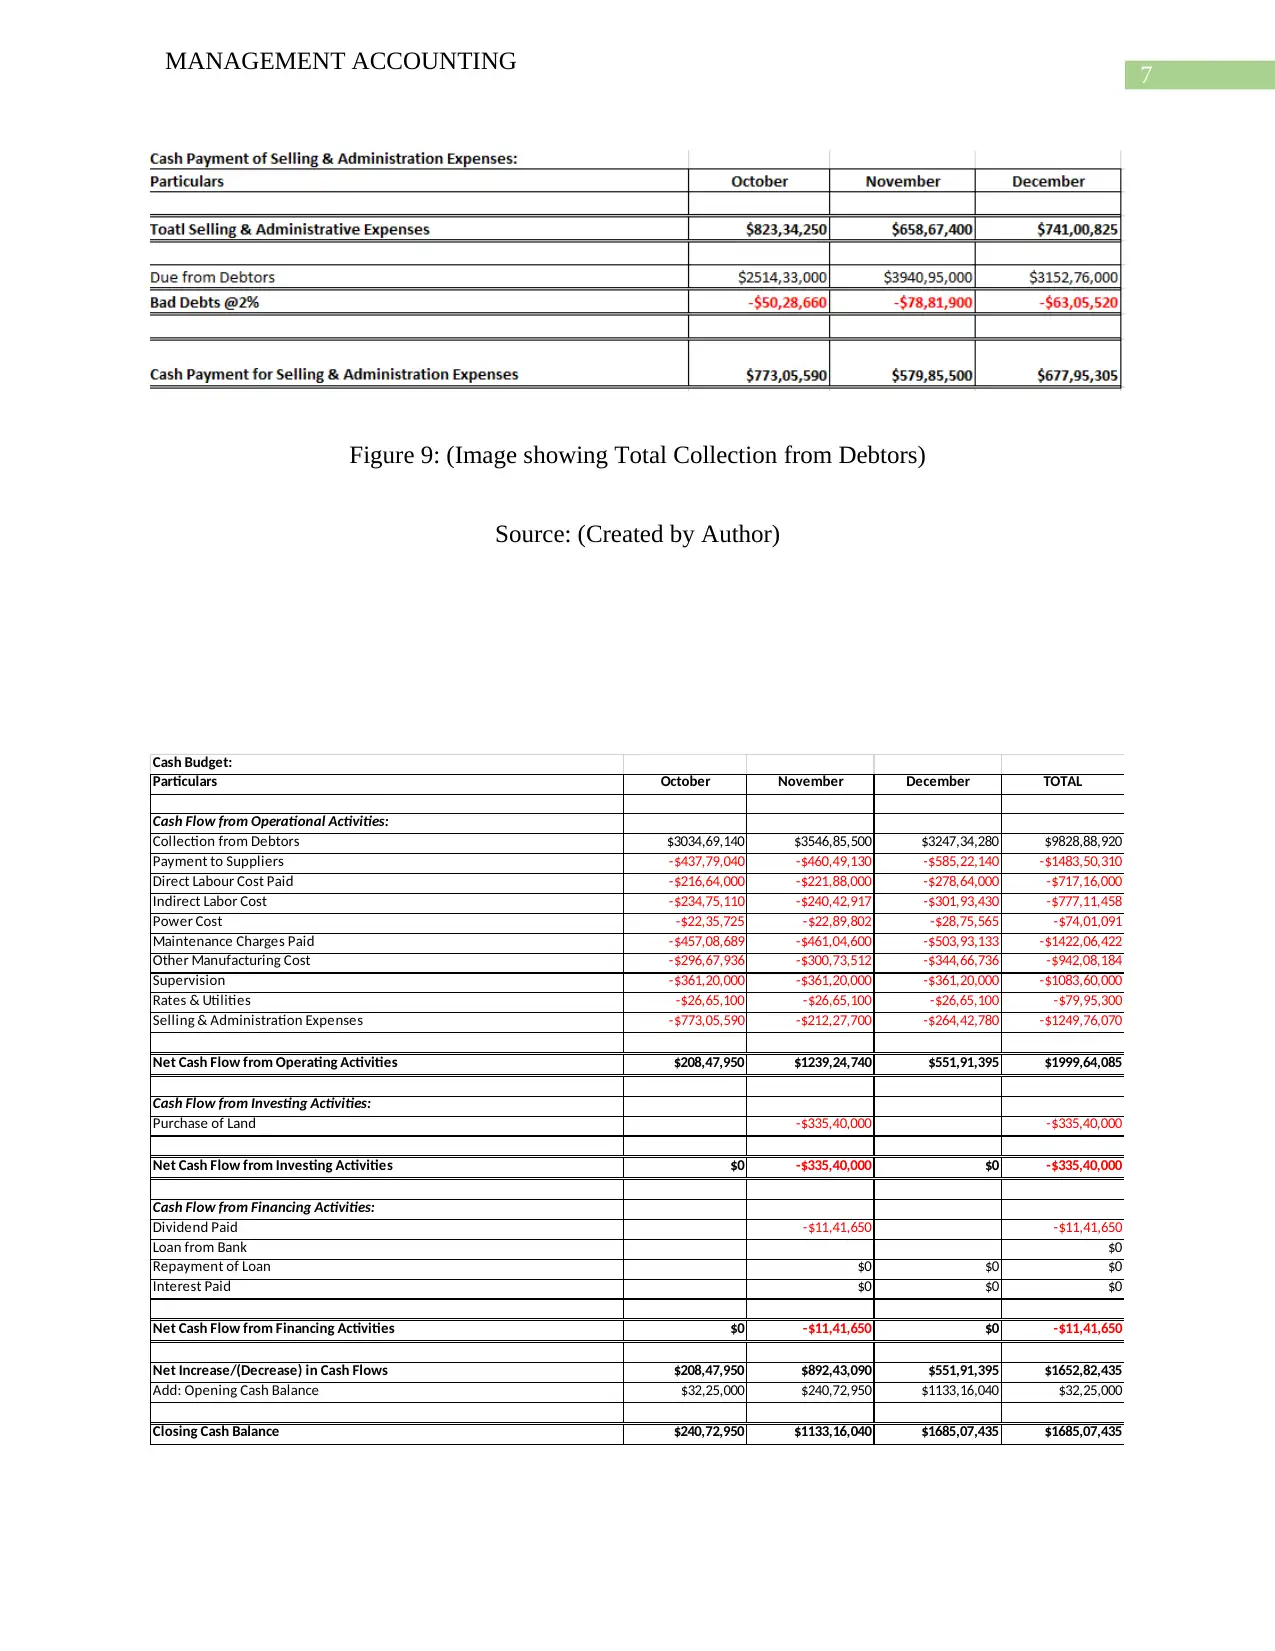
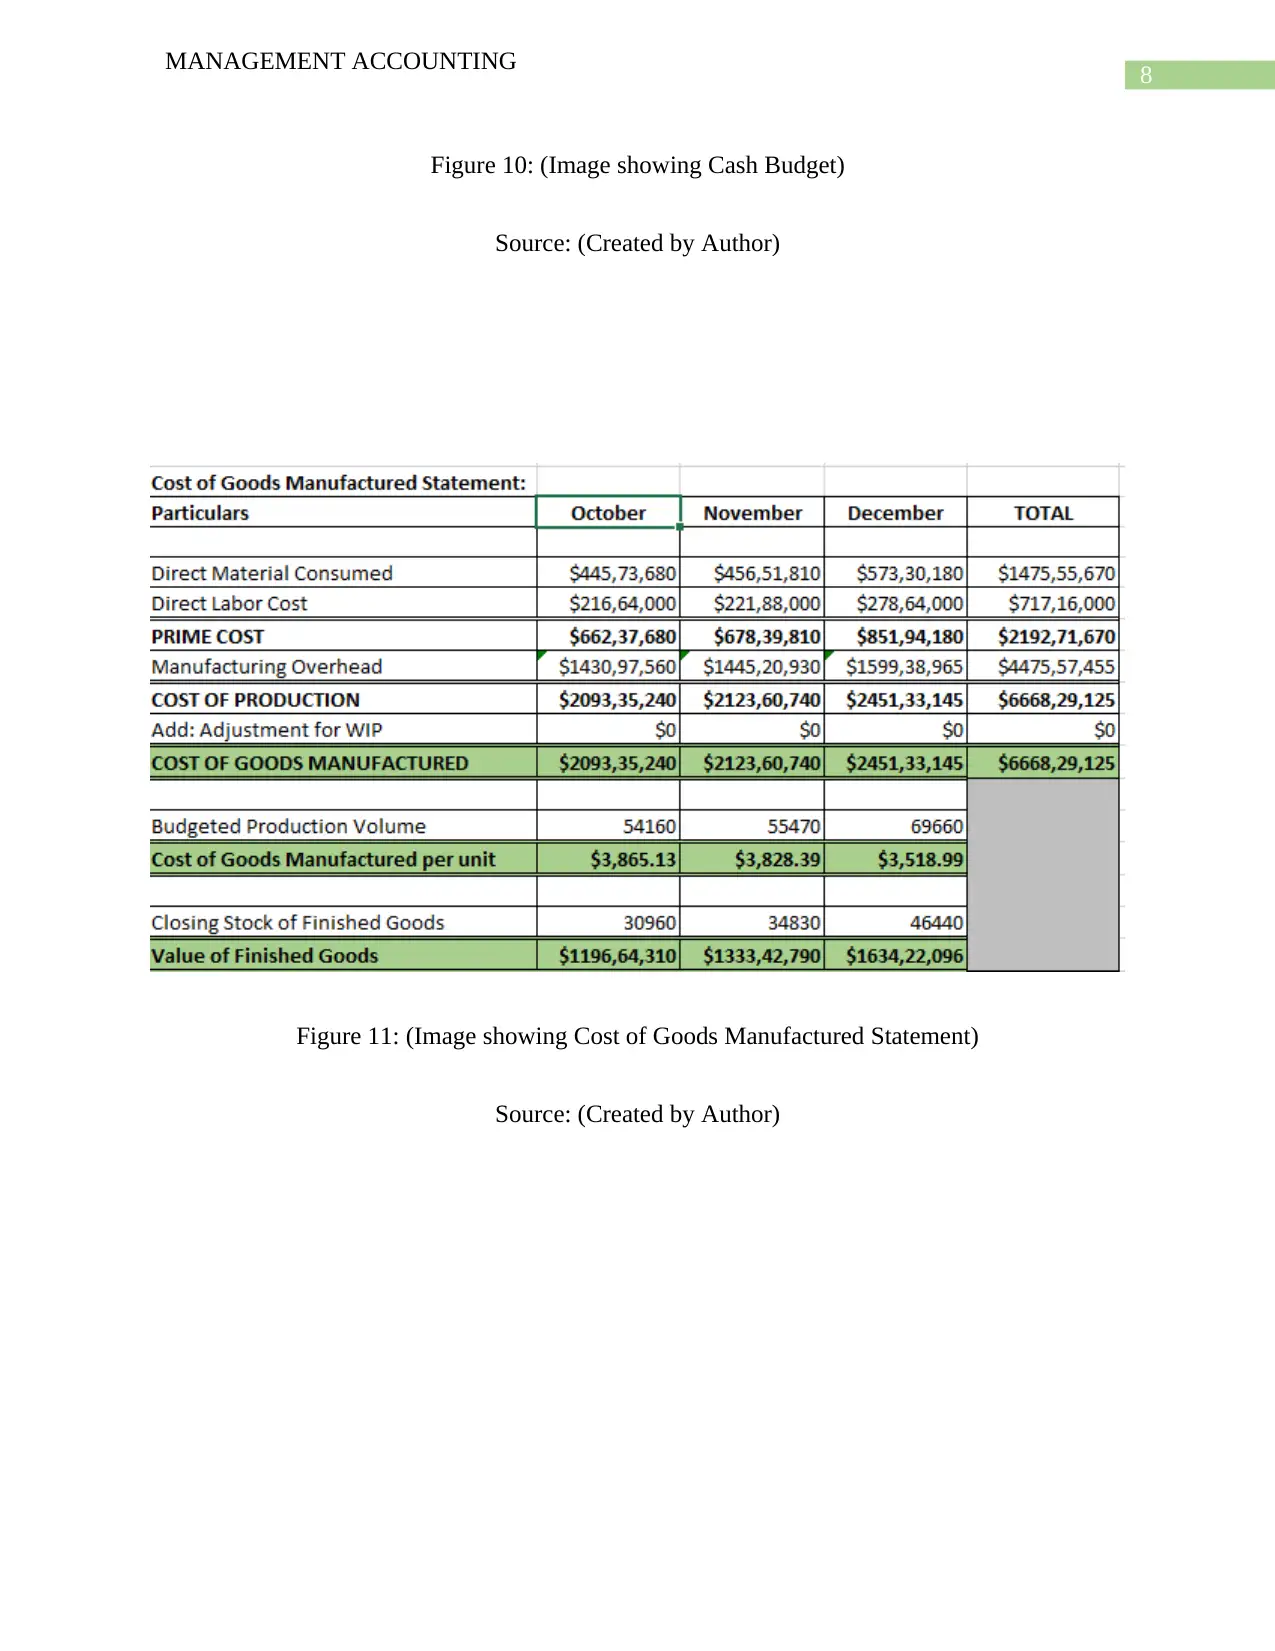
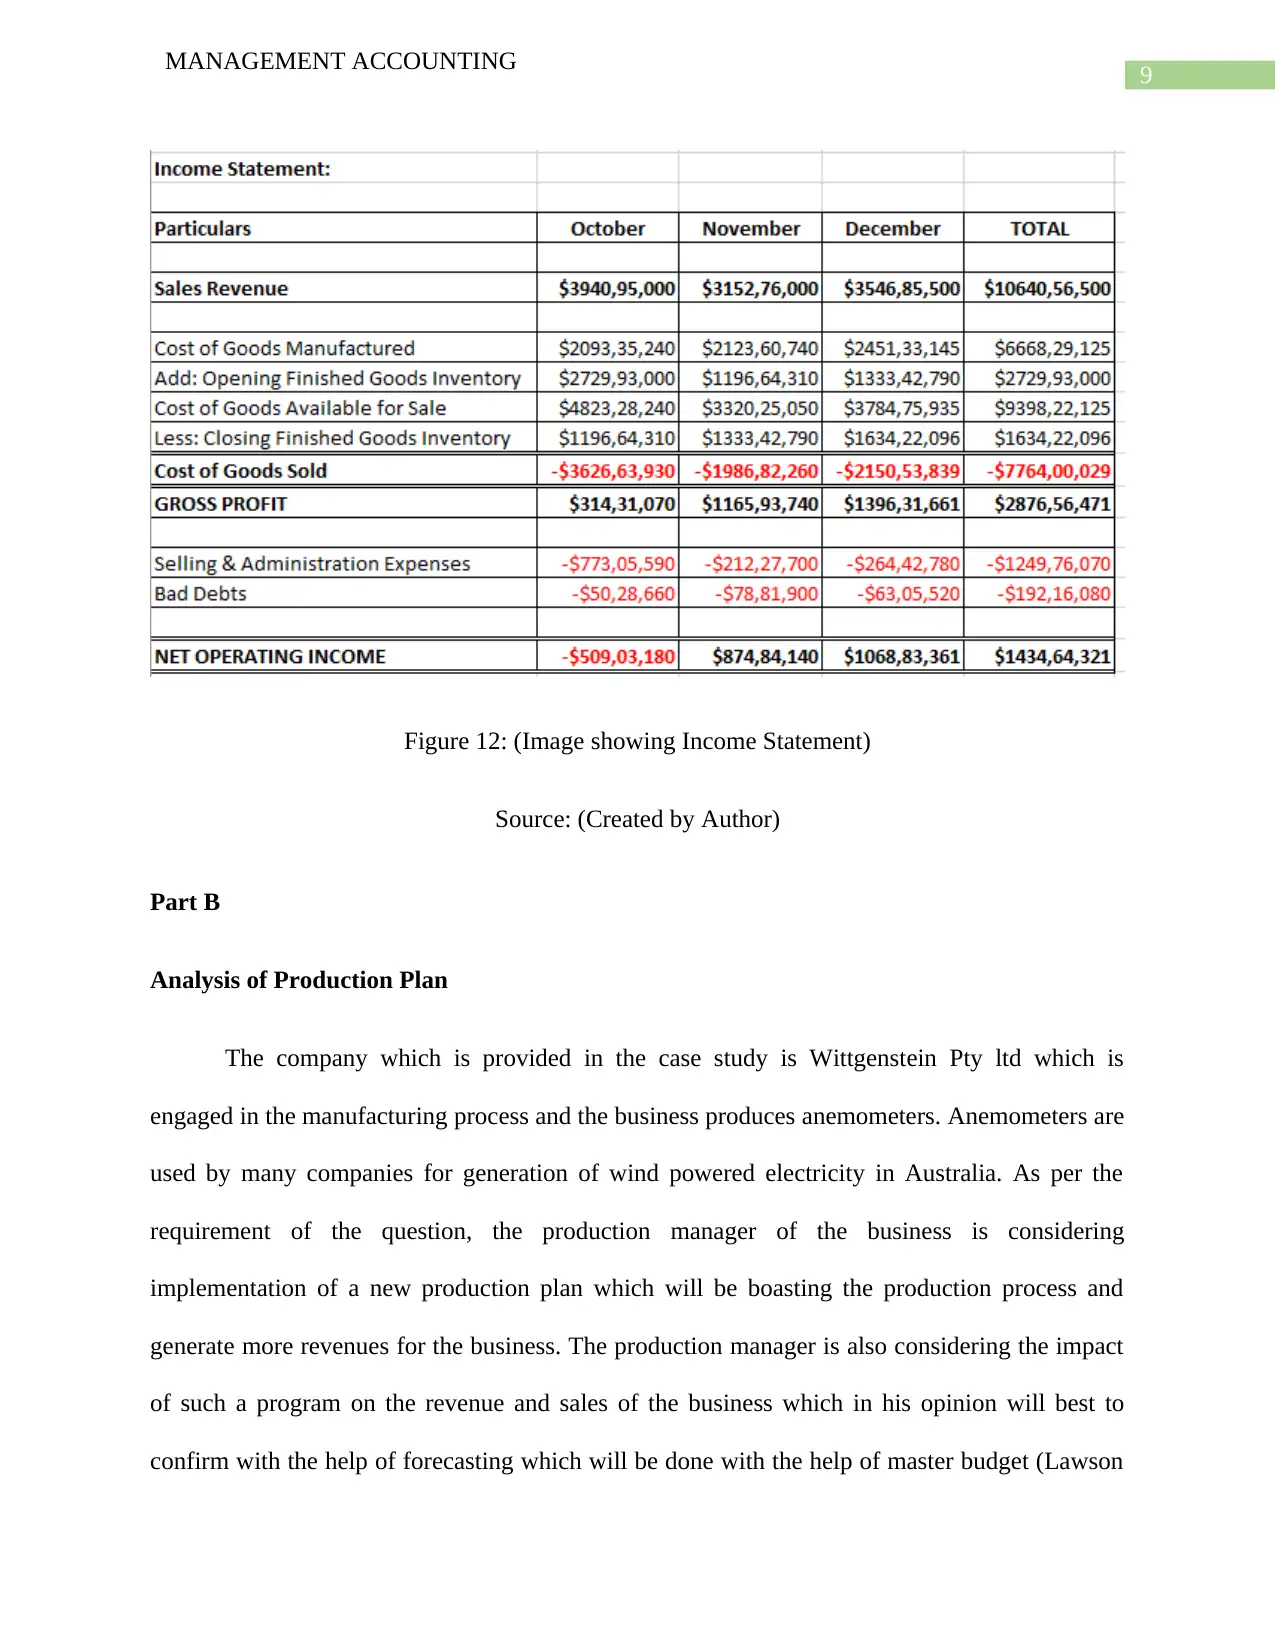
This report provides a comprehensive analysis of a management accounting assignment. It begins with the preparation of a master budget, including sales, production, direct labor, purchase, direct material, manufacturing overhead, and cash budgets, along with the cost of goods manufactured statement and income statement. The report then delves into an analysis of a production plan for Wittgenstein Pty Ltd, a company manufacturing anemometers, evaluating the impact of a new production program on revenue and sales through forecasting. The analysis includes detailed figures for sales volume, direct labor hours and costs, material costs, manufacturing overhead, and cash flow. Finally, the report contrasts participative and imposed budgeting approaches, recommending a participative approach for the company. The report utilizes figures and tables to support the analysis and includes references to relevant literature.
Document Page
Running head: MANAGEMENT ACCOUNTING
Management Accounting
Name of the Student:
Name of the University:
Author’s Note:
tabler-icon-diamond-filled.svg

Paraphrase This Document

Need a fresh take? Get an instant paraphrase of this document with our AI Paraphraser
Document Page
1
MANAGEMENT ACCOUNTING
Table of Contents
Part A...............................................................................................................................................2
Master Budget’s Preparation.......................................................................................................2
Part B.............................................................................................................................................10
Analysis of Production Plan......................................................................................................10
Part C.........................................................................................................................................13
Participative and Imposed Budget.............................................................................................13
Reference.......................................................................................................................................15
Document Page
2
MANAGEMENT ACCOUNTING
Part A
Master Budget’s Preparation
Figure 1: (Image showing Sales Budget)
Source: (Created by Author)
Figure 2: (Image showing Production Budget)
Source: (Created by Author)
Document Page
3
MANAGEMENT ACCOUNTING
Figure 3: (Image showing Direct Labor Budget)
Source: (Created by Author)
tabler-icon-diamond-filled.svg

Paraphrase This Document

Need a fresh take? Get an instant paraphrase of this document with our AI Paraphraser
Document Page
4
MANAGEMENT ACCOUNTING
Figure 4: (Image showing Purchase Budget)
Source: (Created by Author)
Figure 5: (Image showing Direct Material Cost Budget)
Source: (Created by Author)
Document Page
5
MANAGEMENT ACCOUNTING
Figure 6: (Image showing Manufacturing Overhead Budget)
Source: (Created by Author)
Document Page
6
MANAGEMENT ACCOUNTING
Figure 7: (Image showing Additional Calculations for Manufacturing Overhead Budget)
Source: (Created by Author)
Figure 8: (Image showing Total Collection from Debtors)
Source: (Created by Author)
tabler-icon-diamond-filled.svg

Paraphrase This Document

Need a fresh take? Get an instant paraphrase of this document with our AI Paraphraser
Document Page
7
MANAGEMENT ACCOUNTING
Figure 9: (Image showing Total Collection from Debtors)
Source: (Created by Author)
Cash Budget:
Particulars October November December TOTAL
Cash Flow from Operational Activities:
Collection from Debtors $3034,69,140 $3546,85,500 $3247,34,280 $9828,88,920
Payment to Suppliers -$437,79,040 -$460,49,130 -$585,22,140 -$1483,50,310
Direct Labour Cost Paid -$216,64,000 -$221,88,000 -$278,64,000 -$717,16,000
Indirect Labor Cost -$234,75,110 -$240,42,917 -$301,93,430 -$777,11,458
Power Cost -$22,35,725 -$22,89,802 -$28,75,565 -$74,01,091
Maintenance Charges Paid -$457,08,689 -$461,04,600 -$503,93,133 -$1422,06,422
Other Manufacturing Cost -$296,67,936 -$300,73,512 -$344,66,736 -$942,08,184
Supervision -$361,20,000 -$361,20,000 -$361,20,000 -$1083,60,000
Rates & Utilities -$26,65,100 -$26,65,100 -$26,65,100 -$79,95,300
Selling & Administration Expenses -$773,05,590 -$212,27,700 -$264,42,780 -$1249,76,070
Net Cash Flow from Operating Activities $208,47,950 $1239,24,740 $551,91,395 $1999,64,085
Cash Flow from Investing Activities:
Purchase of Land -$335,40,000 -$335,40,000
Net Cash Flow from Investing Activities $0 -$335,40,000 $0 -$335,40,000
Cash Flow from Financing Activities:
Dividend Paid -$11,41,650 -$11,41,650
Loan from Bank $0
Repayment of Loan $0 $0 $0
Interest Paid $0 $0 $0
Net Cash Flow from Financing Activities $0 -$11,41,650 $0 -$11,41,650
Net Increase/(Decrease) in Cash Flows $208,47,950 $892,43,090 $551,91,395 $1652,82,435
Add: Opening Cash Balance $32,25,000 $240,72,950 $1133,16,040 $32,25,000
Closing Cash Balance $240,72,950 $1133,16,040 $1685,07,435 $1685,07,435
Document Page
8
MANAGEMENT ACCOUNTING
Figure 10: (Image showing Cash Budget)
Source: (Created by Author)
Figure 11: (Image showing Cost of Goods Manufactured Statement)
Source: (Created by Author)
Document Page
9
MANAGEMENT ACCOUNTING
Figure 12: (Image showing Income Statement)
Source: (Created by Author)
Part B
Analysis of Production Plan
The company which is provided in the case study is Wittgenstein Pty ltd which is
engaged in the manufacturing process and the business produces anemometers. Anemometers are
used by many companies for generation of wind powered electricity in Australia. As per the
requirement of the question, the production manager of the business is considering
implementation of a new production plan which will be boasting the production process and
generate more revenues for the business. The production manager is also considering the impact
of such a program on the revenue and sales of the business which in his opinion will best to
confirm with the help of forecasting which will be done with the help of master budget (Lawson
tabler-icon-diamond-filled.svg

Paraphrase This Document

Need a fresh take? Get an instant paraphrase of this document with our AI Paraphraser
Document Page
10
MANAGEMENT ACCOUNTING
et al. 2015). As per the management of the company, the plan of the management is to estimate
all expenses and revenues which the business is likely to earns during the quarter which begins
from October and ends on December. In order to analyze the estimated costs which are related to
the investment in the program of production, both direct and indirect costs will be included in the
budget of the business. In addition to this, the management of the company will be following
flexible budgeting system which will be including cash budget, direct material budget, sales
budget, production budget, direct labor budget, cost of goods manufactured expenses, income
statement and cash which are collected from debtors of the business (Cox 2014).
As per the sales budget of the business, the management anticipates that the volume of
sales will be slightly falling for the first quarter. The sales volume of the business for the month
of January is estimated to be highest but January does not fall in the quarter which is being
considered for the analysis (Ahmad 2013). The highest sales volume which the management
anticipates to get is in the month of October which is 64500 units. Due to the fall in the sales
volume of the business for the month of November and December will result in low sales
revenue as shown in figure 1 which is shown to be $ 3546,85,500 for the month of December.
The sales revenue for the month of October is shown to be $ 3152,76,000. The budgeted revenue
which is earned during the quarter fall can also be attributed to the constant selling price. As per
the production budget, the volume of production is also anticipated to increase as to increase due
to the production plan of the business. The business anticipates that the production plan will be
promoting the efficiency of the business in terms of production volume (Andersen 2013). The
direct labour budget shows that as the production volume of the business increases the total
direct labour hour which is anticipated by the business is also expected to increase (Kamp,
Morandi and Østergård 2016). The total direct labour hour required for the month of December
Document Page
11
MANAGEMENT ACCOUNTING
is expected to be the highest which is shown in the budget as 557280 hours which has
significantly increased from the previous month. The budgeted direct labour cost for the month
of December is anticipated to be highest which is shown as $ 278,64,000 which has increased
from previous month which was $ 221,88,000. The purchase budget of the company shows that
the main materials which are used in the production of anemometer is cups and vanes
(Pazarceviren and Celayir 2014). The budgeted direct material which are expected to be required
by the business for the month of December is shown to be $ 585,22,140. The same has increased
from the previous year’s estimate which is shown to be $ 460,49,130. The direct material budget
shows that the total numbers of cup which are required for the month of December is 278640.
The total number of vanes which are required for the month of December is shown to be 348300.
The budgeted direct material cost for the month of December is shown to be $ 573,30,180 which
is highest during the quarter. The Manufacturing overhead of the business shows that the
business has certain indirect costs which are power costs, maintenance costs, other
manufacturing and variable costs and indirect labour costs. The budgeted manufacturing
overhead which is shown in the master budget of the business is shown to be $ 1599,38,965
which is for the month of December and the same has increased from previous month which is
shown to be $ 1445,20,930. The increase in the indirect costs of the business can be related to the
increase in the production volume of the business. Therefore, it is quite natural for any business
to face a rise in the indirect cost of the business due to increase in the production volume of the
business.
The collection from debtors shows that the business has been involved in credit sales
which is fact as mentioned in the case study all sales of the business is on credit which makes the
collection from debtors as the main source of revenue for the business (Vella 2016). The
chevron_up_icon
1 out of 16
circle_padding
hide_on_mobile
zoom_out_icon
[object Object]