Management Accounting Report: Financial Problem Solving and Success
VerifiedAdded on  2023/01/13
|22
|4158
|72
Report
AI Summary
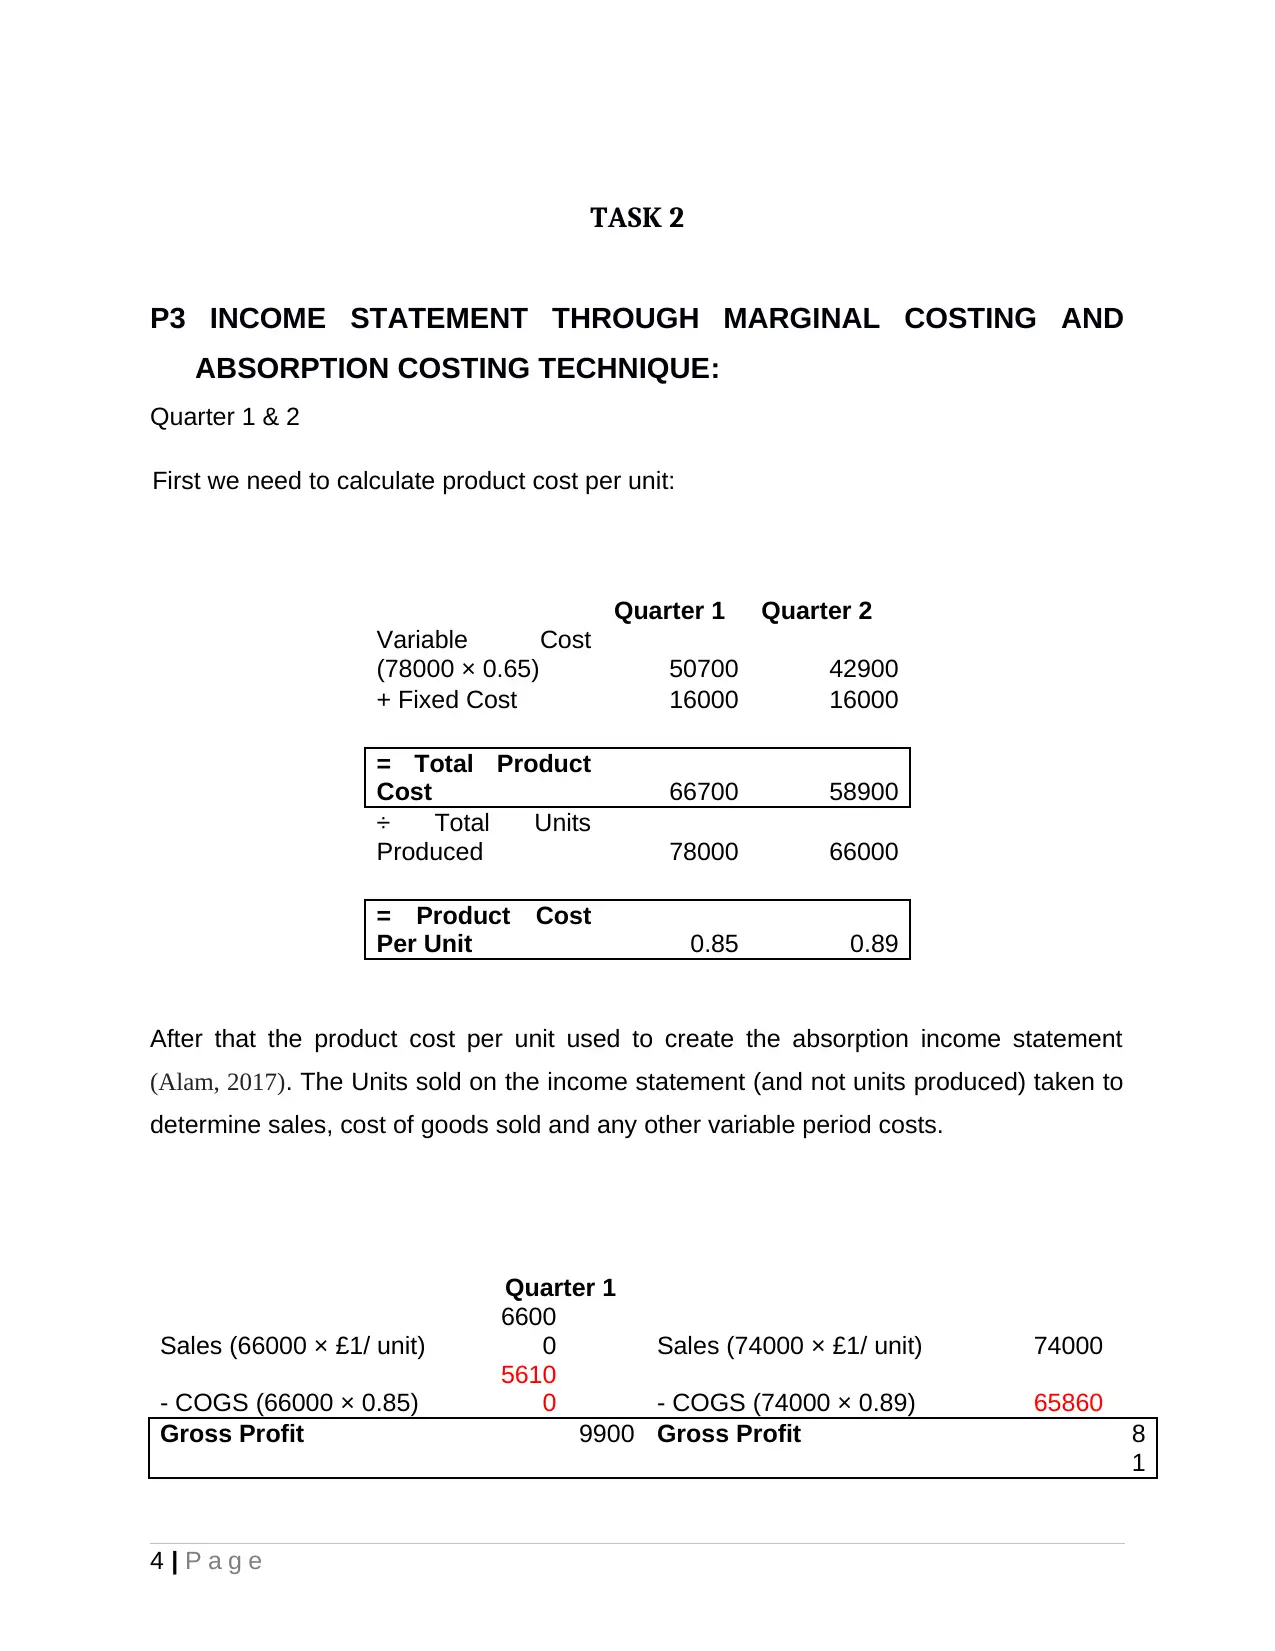
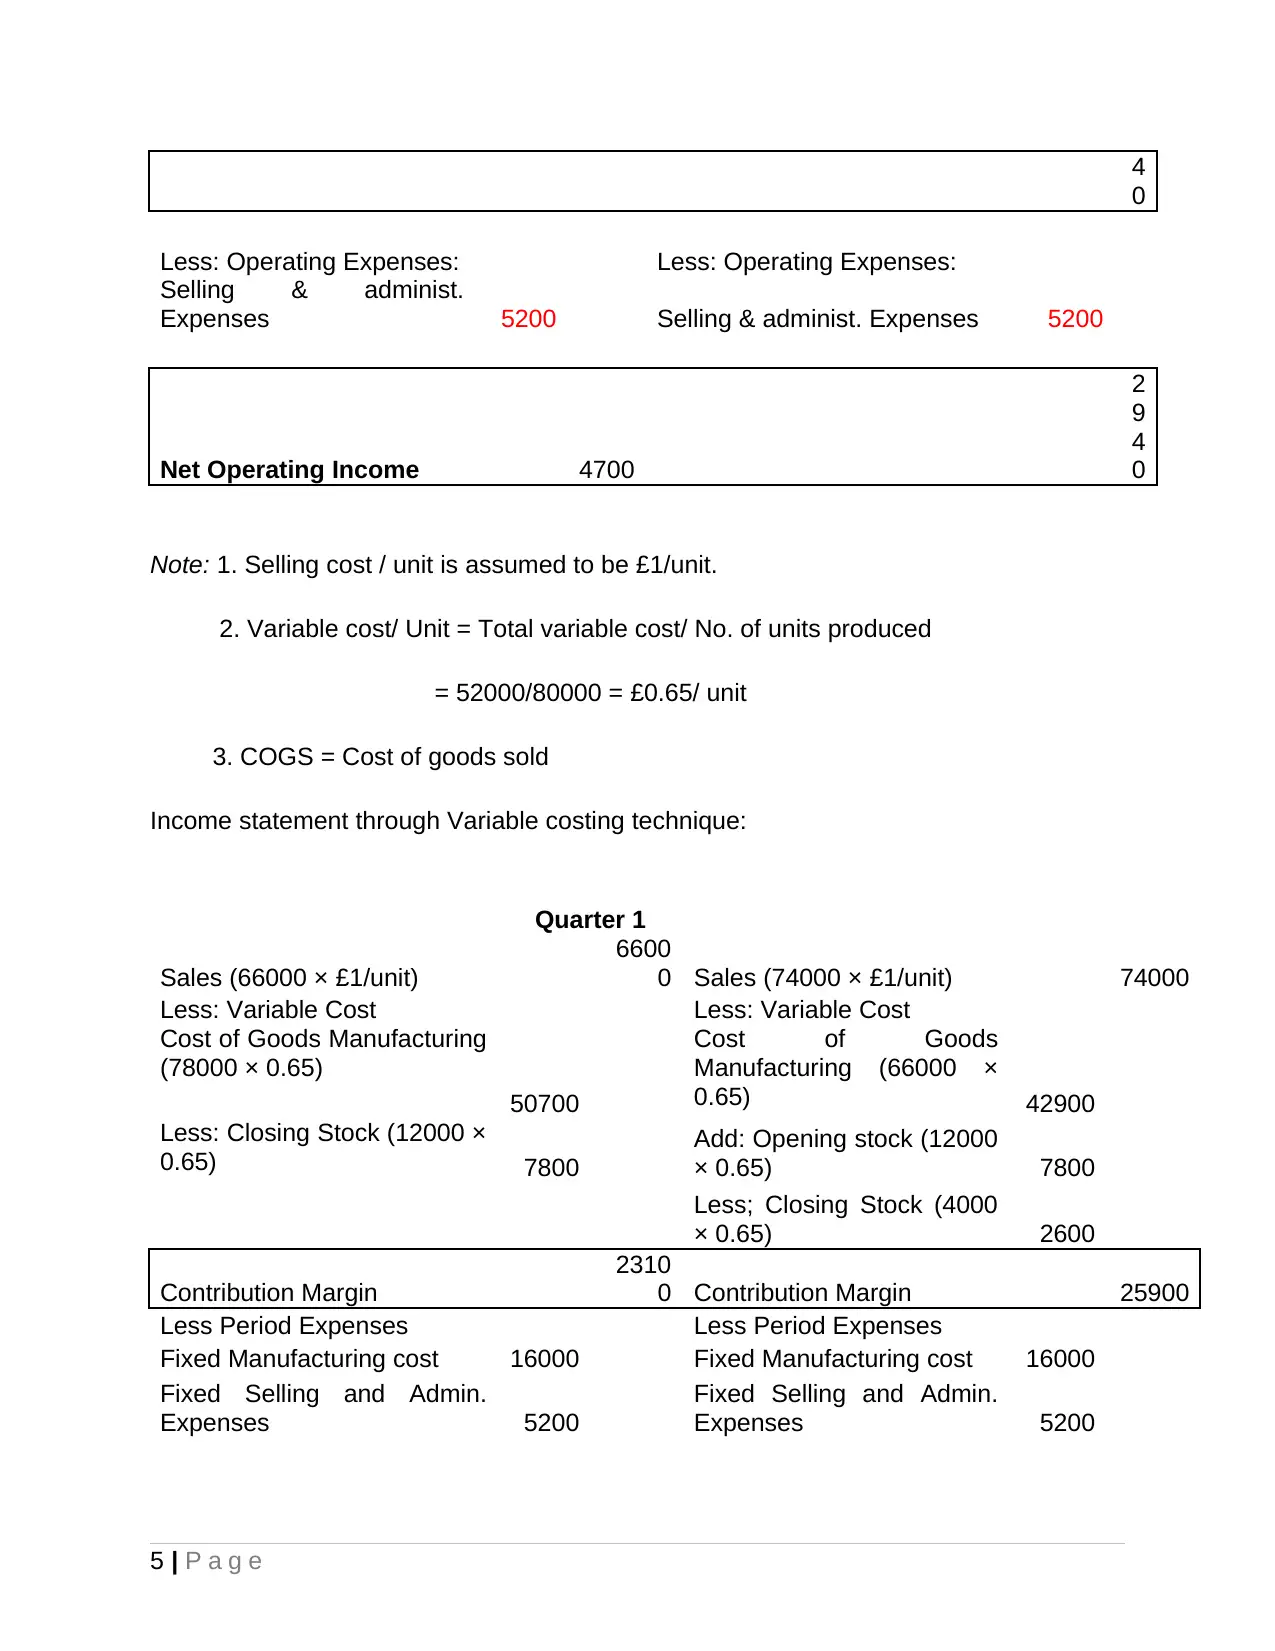
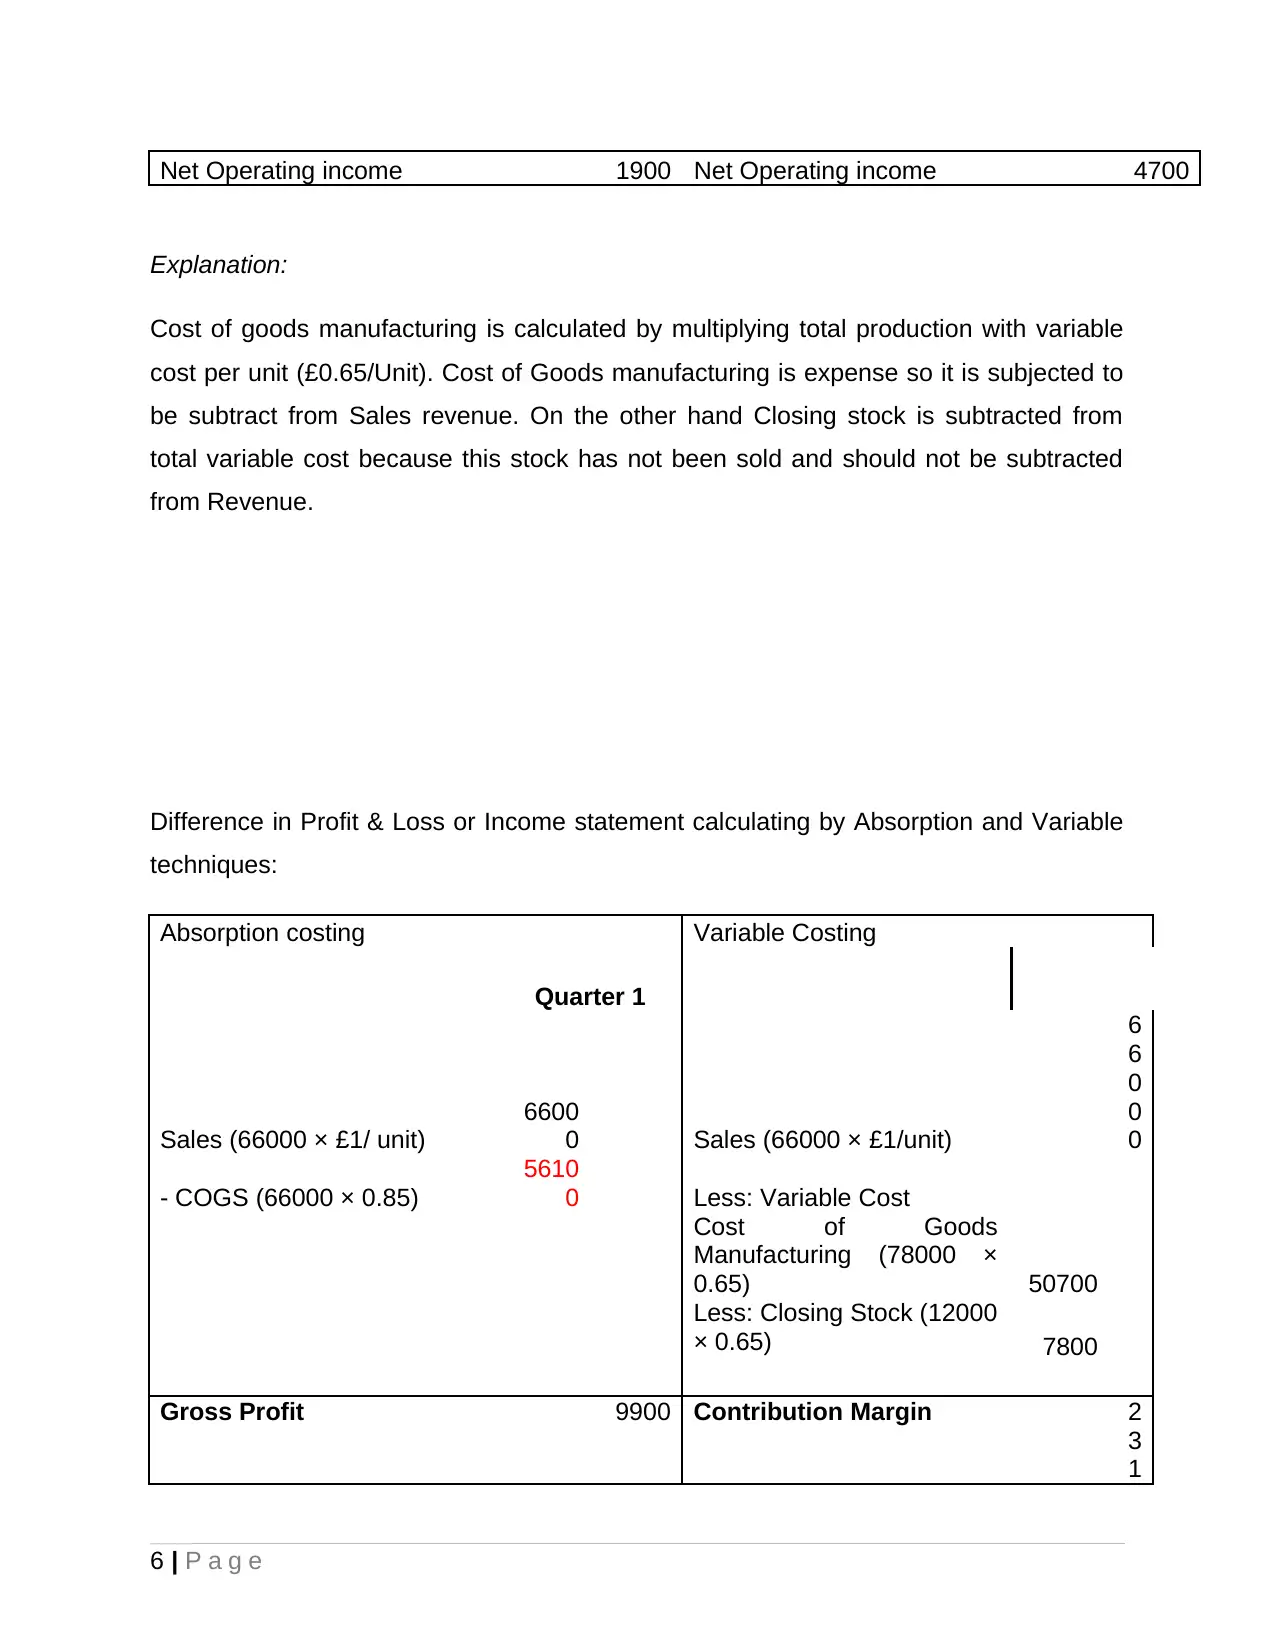
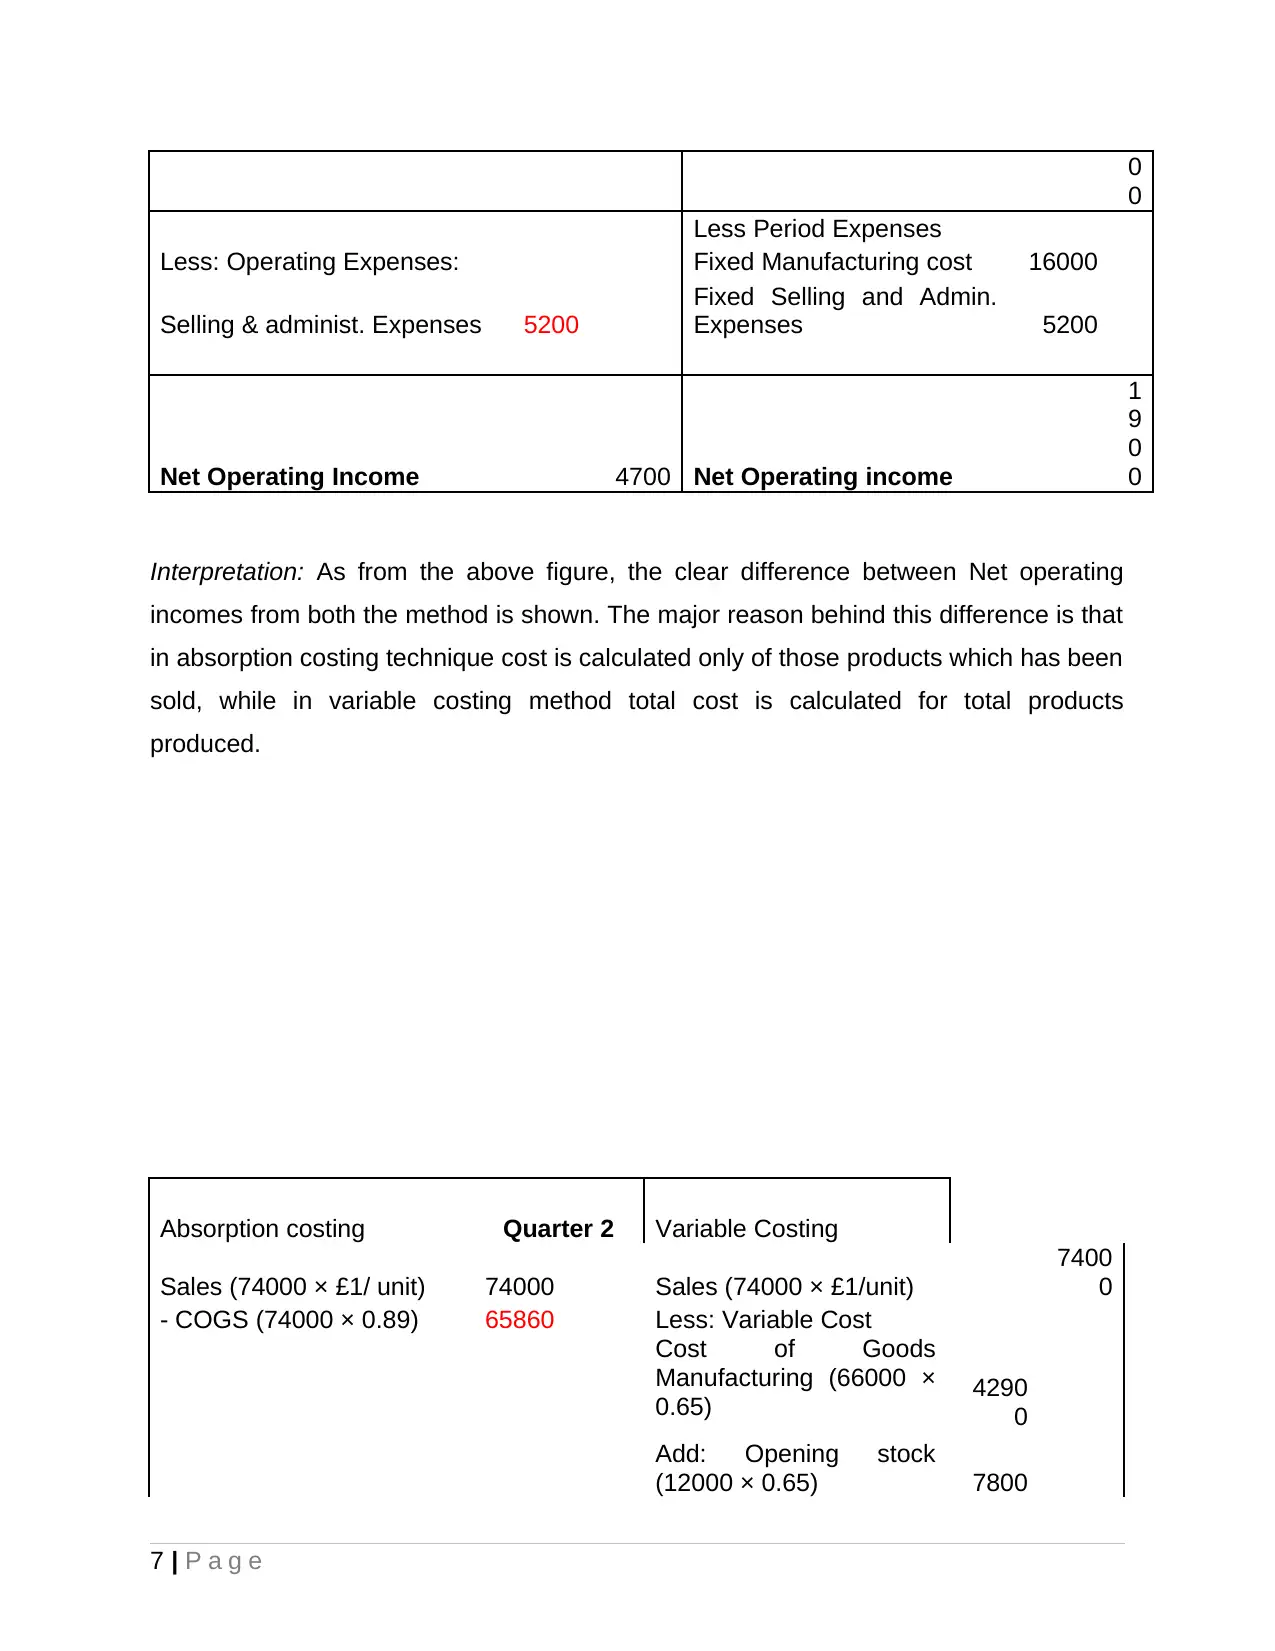
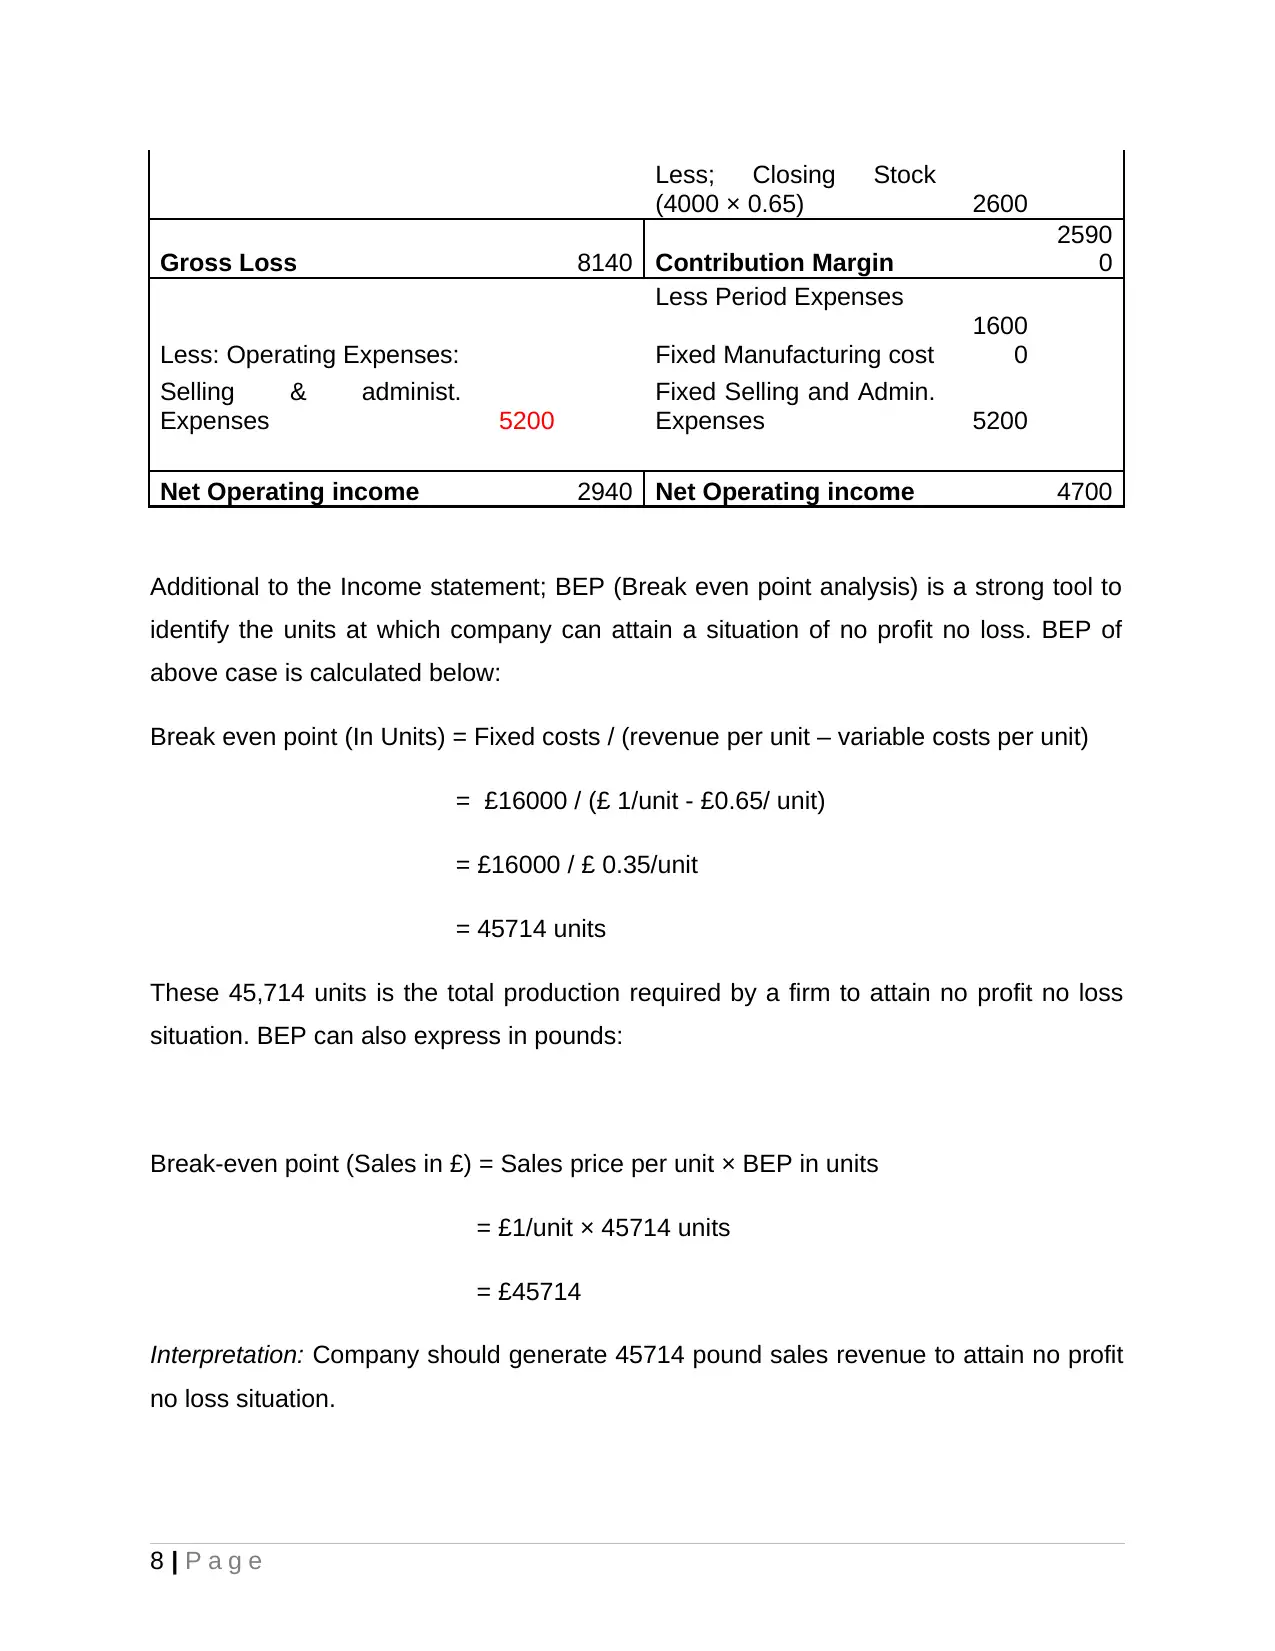
This report delves into the core principles of management accounting, providing a comprehensive overview of its application in a business environment. It begins by introducing the fundamentals and explores the use of financial data for planning, monitoring, and controlling finances. The report analyzes two types of income statements: marginal costing and absorption costing, demonstrating how direct and indirect costs are treated. It also examines various financial problems, such as low revenue and high debt, and presents management accounting tools and techniques to overcome these challenges, including margin analysis, capital budgeting, and demand forecasting. The report further discusses the advantages and disadvantages of budgetary control and pricing strategies. Finally, it addresses the concept of sustainable success within the context of management accounting systems, emphasizing the importance of adapting these systems to solve financial problems and achieve long-term goals. The report includes calculations and interpretations to illustrate the practical application of these concepts.

Management
Accounting
Accounting
Paraphrase This Document
Need a fresh take? Get an instant paraphrase of this document with our AI Paraphraser

INTRODUCTION...............................................................................................................3
TASK 2...............................................................................................................................4
P3 INCOME STATEMENT THROUGH MARGINAL COSTING AND ABSORPTION
COSTING TECHNIQUE:...................................................................................................4
M2 Range of management accounting techniques:..........................................................8
P4 Advantages and disadvantages of different types of planning tools used for
budgetary control:............................................................................................................10
M3. Different planning tools and their application for forecasting budgets.....................12
P5. Adaption of management accounting systems to respond to financial problems and
sustainable success:........................................................................................................13
M4. Sustainable success through solving financial problems by Management
Accounting:......................................................................................................................18
CONCLUSION:................................................................................................................19
REFERENCES................................................................................................................20

INTRODUCTION
The objective of this report is introducing the management accounting fundamentals
which can be practice in the wider business environment (Agrawal and Cooper, 2017).
This project report will investigate about uses of management accounting financial data
to get planning decisions and the monitoring and control of finance within organizations.
This project report consists of two types of Income statement; Income statement
through marginal costing and Income statement through absorption costing methods.
How to solve financial problems of the business is discussed in this report. To
understand how marginal and absorption costing methods work, calculations has been
done which shows treatment of direct and indirect costs. There are many financial
problems and issues like low credibility, less revenue, poor cost estimation,
mismatching of data’s in financial statement and high debts taken from the market.
These threats can weak Company’s wealth. To handle such threat there are some tools
and techniques of management accounting systems which help business to overcome
from these financial issues. How these tools solve firms problems are shown in the
project. Additional to solving threats, the concept of sustainable success also discussed
in respect with management accounting systems.
3 | P a g e
⊘ This is a preview!⊘
Do you want full access?
Subscribe today to unlock all pages.

Trusted by 1+ million students worldwide

TASK 2
P3 INCOME STATEMENT THROUGH MARGINAL COSTING AND
ABSORPTION COSTING TECHNIQUE:
Quarter 1 & 2
First we need to calculate product cost per unit:
Quarter 1 Quarter 2
Variable Cost
(78000 × 0.65) 50700 42900
+ Fixed Cost 16000 16000
= Total Product
Cost 66700 58900
÷ Total Units
Produced 78000 66000
= Product Cost
Per Unit 0.85 0.89
After that the product cost per unit used to create the absorption income statement
(Alam, 2017). The Units sold on the income statement (and not units produced) taken to
determine sales, cost of goods sold and any other variable period costs.
Quarter 1
Sales (66000 × £1/ unit)
6600
0 Sales (74000 × £1/ unit) 74000
- COGS (66000 × 0.85)
5610
0 - COGS (74000 × 0.89) 65860
Gross Profit 9900 Gross Profit 8
1
4 | P a g e
Paraphrase This Document
Need a fresh take? Get an instant paraphrase of this document with our AI Paraphraser

4
0
Less: Operating Expenses: Less: Operating Expenses:
Selling & administ.
Expenses 5200 Selling & administ. Expenses 5200
Net Operating Income 4700
2
9
4
0
Note: 1. Selling cost / unit is assumed to be £1/unit.
2. Variable cost/ Unit = Total variable cost/ No. of units produced
= 52000/80000 = £0.65/ unit
3. COGS = Cost of goods sold
Income statement through Variable costing technique:
Quarter 1
Sales (66000 × £1/unit)
6600
0 Sales (74000 × £1/unit) 74000
Less: Variable Cost Less: Variable Cost
Cost of Goods Manufacturing
(78000 × 0.65)
50700
Cost of Goods
Manufacturing (66000 ×
0.65) 42900
Less: Closing Stock (12000 ×
0.65) 7800
Add: Opening stock (12000
× 0.65) 7800
Less; Closing Stock (4000
× 0.65) 2600
Contribution Margin
2310
0 Contribution Margin 25900
Less Period Expenses Less Period Expenses
Fixed Manufacturing cost 16000 Fixed Manufacturing cost 16000
Fixed Selling and Admin.
Expenses 5200
Fixed Selling and Admin.
Expenses 5200
5 | P a g e
0
Less: Operating Expenses: Less: Operating Expenses:
Selling & administ.
Expenses 5200 Selling & administ. Expenses 5200
Net Operating Income 4700
2
9
4
0
Note: 1. Selling cost / unit is assumed to be £1/unit.
2. Variable cost/ Unit = Total variable cost/ No. of units produced
= 52000/80000 = £0.65/ unit
3. COGS = Cost of goods sold
Income statement through Variable costing technique:
Quarter 1
Sales (66000 × £1/unit)
6600
0 Sales (74000 × £1/unit) 74000
Less: Variable Cost Less: Variable Cost
Cost of Goods Manufacturing
(78000 × 0.65)
50700
Cost of Goods
Manufacturing (66000 ×
0.65) 42900
Less: Closing Stock (12000 ×
0.65) 7800
Add: Opening stock (12000
× 0.65) 7800
Less; Closing Stock (4000
× 0.65) 2600
Contribution Margin
2310
0 Contribution Margin 25900
Less Period Expenses Less Period Expenses
Fixed Manufacturing cost 16000 Fixed Manufacturing cost 16000
Fixed Selling and Admin.
Expenses 5200
Fixed Selling and Admin.
Expenses 5200
5 | P a g e

Net Operating income 1900 Net Operating income 4700
Explanation:
Cost of goods manufacturing is calculated by multiplying total production with variable
cost per unit (£0.65/Unit). Cost of Goods manufacturing is expense so it is subjected to
be subtract from Sales revenue. On the other hand Closing stock is subtracted from
total variable cost because this stock has not been sold and should not be subtracted
from Revenue.
Difference in Profit & Loss or Income statement calculating by Absorption and Variable
techniques:
Absorption costing Variable Costing
Quarter 1
Sales (66000 × £1/ unit)
6600
0 Sales (66000 × £1/unit)
6
6
0
0
0
- COGS (66000 × 0.85)
5610
0 Less: Variable Cost
Cost of Goods
Manufacturing (78000 ×
0.65) 50700
Less: Closing Stock (12000
× 0.65) 7800
Gross Profit 9900 Contribution Margin 2
3
1
6 | P a g e
⊘ This is a preview!⊘
Do you want full access?
Subscribe today to unlock all pages.

Trusted by 1+ million students worldwide

0
0
Less Period Expenses
Less: Operating Expenses: Fixed Manufacturing cost 16000
Selling & administ. Expenses 5200
Fixed Selling and Admin.
Expenses 5200
Net Operating Income 4700 Net Operating income
1
9
0
0
Interpretation: As from the above figure, the clear difference between Net operating
incomes from both the method is shown. The major reason behind this difference is that
in absorption costing technique cost is calculated only of those products which has been
sold, while in variable costing method total cost is calculated for total products
produced.
Absorption costing Quarter 2 Variable Costing
Sales (74000 × £1/ unit) 74000 Sales (74000 × £1/unit)
7400
0
- COGS (74000 × 0.89) 65860 Less: Variable Cost
Cost of Goods
Manufacturing (66000 ×
0.65) 4290
0
Add: Opening stock
(12000 × 0.65) 7800
7 | P a g e
0
Less Period Expenses
Less: Operating Expenses: Fixed Manufacturing cost 16000
Selling & administ. Expenses 5200
Fixed Selling and Admin.
Expenses 5200
Net Operating Income 4700 Net Operating income
1
9
0
0
Interpretation: As from the above figure, the clear difference between Net operating
incomes from both the method is shown. The major reason behind this difference is that
in absorption costing technique cost is calculated only of those products which has been
sold, while in variable costing method total cost is calculated for total products
produced.
Absorption costing Quarter 2 Variable Costing
Sales (74000 × £1/ unit) 74000 Sales (74000 × £1/unit)
7400
0
- COGS (74000 × 0.89) 65860 Less: Variable Cost
Cost of Goods
Manufacturing (66000 ×
0.65) 4290
0
Add: Opening stock
(12000 × 0.65) 7800
7 | P a g e
Paraphrase This Document
Need a fresh take? Get an instant paraphrase of this document with our AI Paraphraser

Less; Closing Stock
(4000 × 0.65) 2600
Gross Loss 8140 Contribution Margin
2590
0
Less Period Expenses
Less: Operating Expenses: Fixed Manufacturing cost
1600
0
Selling & administ.
Expenses 5200
Fixed Selling and Admin.
Expenses 5200
Net Operating income 2940 Net Operating income 4700
Additional to the Income statement; BEP (Break even point analysis) is a strong tool to
identify the units at which company can attain a situation of no profit no loss. BEP of
above case is calculated below:
Break even point (In Units) = Fixed costs / (revenue per unit – variable costs per unit)
= £16000 / (£ 1/unit - £0.65/ unit)
= £16000 / £ 0.35/unit
= 45714 units
These 45,714 units is the total production required by a firm to attain no profit no loss
situation. BEP can also express in pounds:
Break-even point (Sales in £) = Sales price per unit × BEP in units
= £1/unit × 45714 units
= £45714
Interpretation: Company should generate 45714 pound sales revenue to attain no profit
no loss situation.
8 | P a g e

M2 Range of management accounting techniques:
There are various management accounting techniques which helps company in
achieving its objectives, these are discussed below:
9 | P a g e
There are various management accounting techniques which helps company in
achieving its objectives, these are discussed below:
9 | P a g e
⊘ This is a preview!⊘
Do you want full access?
Subscribe today to unlock all pages.

Trusted by 1+ million students worldwide

1. Margin Analysis: This technique helps company in avoiding overproduction
situations (Appelbaum and et.al., 2017). It helps company in knowing the unit
to be produced to attain no profit no loss situation through breakeven point
analysis.
2. Constraint analysis: This technique helps company in evaluating the hurdles
which stops company in achieving optimum production and increased
revenue. It also states the reason behind this hurdle and provides suitable
solution.
3. Capital budgeting: This is very helpful tool or techniques which helps
company in taking strategic decisions related to capital expenditures
(Francioli and Quagli, 2016). In this method NPV (net present value) of all
investments is calculated to know which expenditure can give more returns.
4. Inventory valuation: This technique helps operation managers to know what
the actual cost is related with inventory. In this method direct and indirect
cost of production is separated to get the amount which directly impact
inventory production.
5. Trend Analysis: In this technique future estimation about revenue and
expenses is done to know how much fund is required to achieve desired
sales.
P4 Advantages and disadvantages of different types of planning tools
used for budgetary control:
1. Budget control:
Advantages and Disadvantages of Budgets:
Budgetary control
Advantages Disadvantages
10 | P a g e
Paraphrase This Document
Need a fresh take? Get an instant paraphrase of this document with our AI Paraphraser

Coordinates important information
across staff managers.
It applies mechanically and rigidly
Interpret strategic plans and put
them into action.
Due to lack of participation,
employees can de-motivate.
Provides record of different
organizational activities.
Perception unfairness situation
arises.
Improves relations with employees
through sound communications.
Politics and resources competition
arises.
Improves resource reallocations A rigid structure decreases initiative
and advancement at lower levels,
making it impossible to get cash for
another new project (Planning Tools,
2020).
Provides corrective action tools.
2. Cost volume profit analysis:
Cost volume profit analysis
Advantages Disadvantages
Simplicity of figuring, utilizes a lot of
standard recipes, numbers can be
changed rapidly to decide changes in
factors.
Accuracy: it accept all expense are
fixed, anyway there are blended cost
that changes with creation.
Planning: the breakeven point assists
supervisors with assessing future
spending and entire creation influence
the targets of the business.
Accept deals stays steady yet interest
for an item can change after some
time.
3. Pricing strategy:
Pricing Strategy
Advantages Disadvantages
Client base valuing takes a look at the
objective whether client is happy to
pay for the item to decide the perfect
cost, this outcomes sets the price to
be charged from customer.
The executives valuing, the item is
estimated at what the organization
perceive not what actually customer
can pay. This creates a gap between
actual price and what price should be.
Cost based pricing accepts and deals
stays steady yet interest for an item
can change after some time.
Cost base pricing confuses managers
and they fixed the price more than
competitors.
11 | P a g e

M3. Different planning tools and their application for forecasting
budgets
There are various planning tools used by company:
1) Budget control: The budget is a quantitative as well as fiscal articulation
of approach for a characterized future period.
Application: It applied to forecast arranged incomes and costs for request
to accomplish the organization's objectives (Georgantopoulos, Poutos and
Eriotis, 2018). In this manner, it is related to the administrative and
bookkeeping capacity of the business.
2) Cost volume profit analysis: Cost volume benefit examination is utilized
by the executives as arranging instrument to assess income from deals,
cost and benefits, this is finished by utilizing a scientific assessment that
ascertains whole changes to deals volume and cost influence benefit in a
future period.
Application: Cost volume benefit investigation is applied by the executives
to forecast the equal initial investment purpose of an item this is the point
that benefits from pay rises to the expense to deliver an item along these
lines there is no misfortune no benefit now (Hyndman, 2016).
3) Pricing strategy: Deciding standard price is difficult task for every
business, because company requires experts who have perfect knowledge
of customer demands, latest trends of the market and can do cost analysis
at different level of operations. The basic steps involved in deciding price
is searching price charged by competitors for similar product.
12 | P a g e
⊘ This is a preview!⊘
Do you want full access?
Subscribe today to unlock all pages.

Trusted by 1+ million students worldwide
1 out of 22
Related Documents

Your All-in-One AI-Powered Toolkit for Academic Success.
 +13062052269
info@desklib.com
Available 24*7 on WhatsApp / Email
Unlock your academic potential
Copyright © 2020–2025 A2Z Services. All Rights Reserved. Developed and managed by ZUCOL.