BHP Billiton vs Rio Tinto: A Management Accounting Financial Report
VerifiedAdded on 2023/05/30
|32
|4468
|343
Report
AI Summary
This report provides a comprehensive analysis of the financial performance of BHP Billiton and Rio Tinto for the financial year ended 2017, utilizing financial ratio analysis. The introduction defines financial accounting and its role in business, emphasizing the use of financial statements for economic decision-making. The report offers company overviews of BHP Billiton and Rio Tinto, detailing their business operations and market positions. It then proceeds to a detailed financial ratio analysis, including Return on Assets, Return on Equity, Profit Margin, Current Ratio, Inventory Turnover, Debt Ratio and Equity Ratio, with calculations and interpretations for both companies. The analysis compares the companies' performance across these key metrics, providing insights into their profitability, efficiency, and financial health. The report concludes with a summary of the findings and references the sources used, along with financial statements in the appendix.
Running head: MANAGEMENT ACCOUNTING
Management Accounting
Name of the Student
Name of the University
Authors Note
Course ID
Management Accounting
Name of the Student
Name of the University
Authors Note
Course ID
Paraphrase This Document
Need a fresh take? Get an instant paraphrase of this document with our AI Paraphraser
1MANAGEMENT ACCOUNTING
Table of Contents
Introduction: 3
Company Overview 3
BHP Billiton 3
Rio Tinto: 4
Financial Ratio Analysis: 4
Return on Assets: 4
Return on Ordinary Equity: 6
Profit Margin: 7
Current Ratio: 9
Inventory Turnover: 10
Debt Ratio: 12
Equity Ratio 13
Debt and Equity Financing Structure: 14
BHP Billiton 14
Rio Tinto: 16
Conclusion: 17
References: 18
Appendix: 21
BHP Billiton Financial Statements: 21
Income Statement: 21
2MANAGEMENT ACCOUNTING
Comprehensive Income Statement: 22
Balance Sheet: 23
Cash Flow Statements: 24
Statement of Changes in Equity: 25
Rio Tinto Financial Statements: 26
Income Statements: 26
Comprehensive Income Statement: 27
Cash Flow Statement: 28
Balance Sheet: 29
Statement of Changes in Equity: 30
Comprehensive Income Statement: 22
Balance Sheet: 23
Cash Flow Statements: 24
Statement of Changes in Equity: 25
Rio Tinto Financial Statements: 26
Income Statements: 26
Comprehensive Income Statement: 27
Cash Flow Statement: 28
Balance Sheet: 29
Statement of Changes in Equity: 30
⊘ This is a preview!⊘
Do you want full access?
Subscribe today to unlock all pages.
Trusted by 1+ million students worldwide
3MANAGEMENT ACCOUNTING
Introduction:
Financial accounting is defined as the field in bookkeeping that is associated with the
summary, examination and reporting of the financial transaction relating to the business.
Financial accounting involves preparing the financial statement so that it is available for
public consumption (Henderson et al., 2015). Companies generally makes the use of
standardized guidelines, transactions to record, summarized and present the same in the
financial report or the financial statement particularly the income statement or the balance
sheet. The financial statement is helpful in offering the information that is needed for making
a sound economic decision.
The current business report is based on analysing the financial performance of two
businesses that are listed on the ASX stock exchange. The report would be providing a
comparative view of BHP Billiton and Rio Tinto for the financial year ended 2017. To
analyse the comparative performance of BHP Billiton and Rio Tinto financial ratios has been
considered here so that a detailed understanding of the financial performance for both the
companies is obtained.
Company Overview
BHP Billiton
BHP Billiton is the globally leading Resources Company. The company is involved in
extracting and processing the minerals, oil and gas with greater than 60,000 employees and
contractors that are mainly involved in Australia and Americas (Bhp.com, 2017). BHP
Billiton produces are sold across the world with the company sales and marketing expanding
across the Singapore and Houston, US. BHP Billiton worldwide headquarters is located in
Melbourne, Australia. BHP Billiton functions under the structure of Dual Listed Company
Paraphrase This Document
Need a fresh take? Get an instant paraphrase of this document with our AI Paraphraser
4MANAGEMENT ACCOUNTING
with the two parent companies namely the BHP Billiton Ltd and BHP Billiton Plc operating
as the single economic entity.
BHP Billiton was founded in 1885 in the mining town of Broken Hill in New South
Wales. During the year 2017, BHP is ranked as the world’s largest mining company in
respect of its market capitalization and third largest company of Melbourne in terms of
revenue that almost increased between 2004 and 2012.
Rio Tinto:
Rio Tinto Group is the Anglo-Australian international and one of the world’s largest
company engaged in mining. For over 145 years, Rio Tinto has been ground-breaking to the
production of materials necessary to the progress of humans (Riotinto.com, 2017). The
minerals and metals helps in making the modern life work. Rio Tinto Group is the dual listed
company trading on both the London stock exchange and the Australian stock exchange. The
company has created portfolio and it is constantly optimising which offers the company with
the competitive advantage.
Rio Tinto Group makes investment in the assets to develop the suit of high quality
expandable assets which is positioned for decades of premium production. With more than
47,000 workforces, Rio Tinto Group has the common code of conduct with the identical set
of morals, protection, collaboration, reliability and brilliance. Rio Tinto continues to pioneer
its progress for the better future. The company looks for ways so that it makes its trade robust
by driving more production and performance from the coalmine to market.
Financial Ratio Analysis:
Return on Assets:
The return on assets ratio is generally called as the return on total assets that are
profitability to measure the net profits that is produced by the total assets through the period
5MANAGEMENT ACCOUNTING
by associating the net income with the average total assets. Alternatively, the return on assets
evaluates how effectively a business manages its assets to generate incomes during a
particular period (Khan, 2015). As the assets of the company forms the sole purpose of
generating the revenues and producing profits, the ratio is helpful to administration and
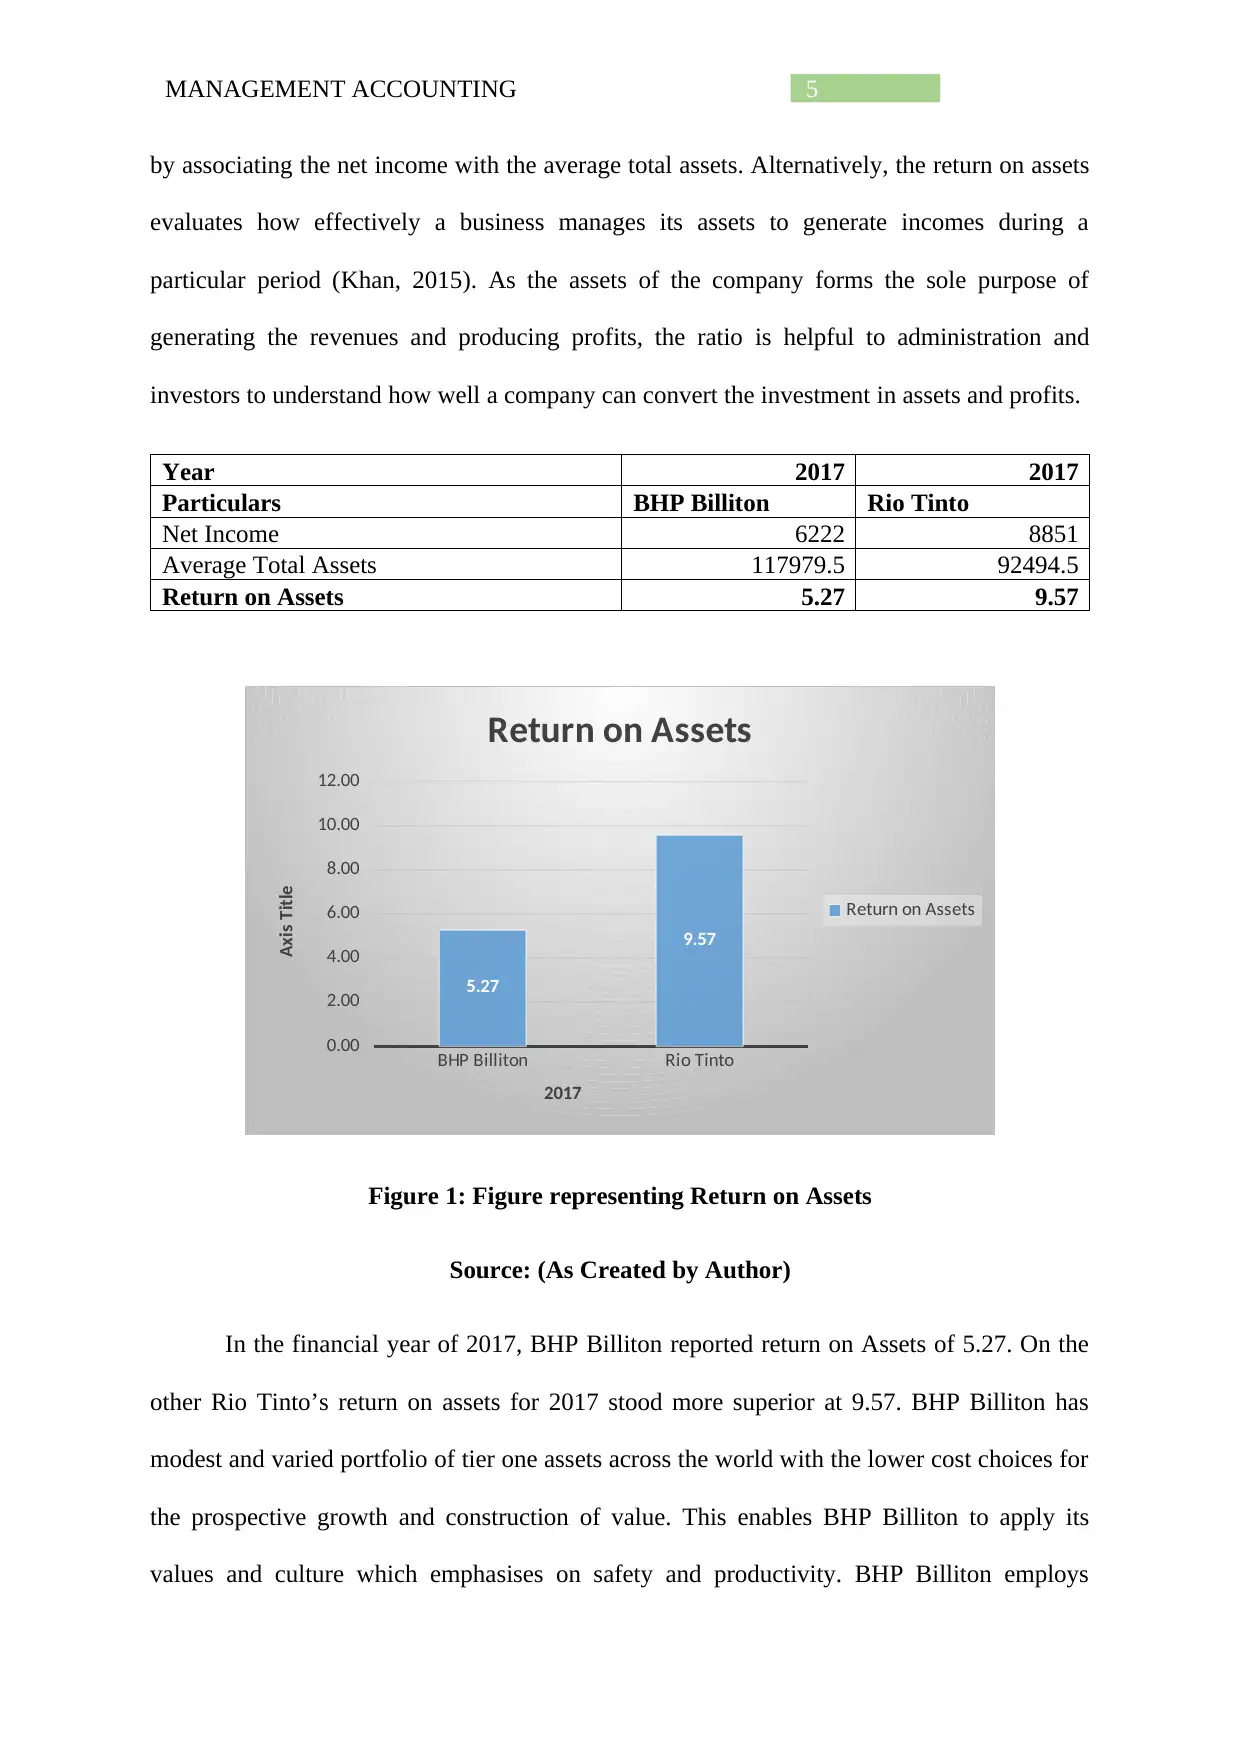
investors to understand how well a company can convert the investment in assets and profits.
Year 2017 2017
Particulars BHP Billiton Rio Tinto
Net Income 6222 8851
Average Total Assets 117979.5 92494.5
Return on Assets 5.27 9.57
BHP Billiton Rio Tinto
0.00
2.00
4.00
6.00
8.00
10.00
12.00
5.27
9.57
Return on Assets
Return on Assets
2017
Axis Title
Figure 1: Figure representing Return on Assets
Source: (As Created by Author)
In the financial year of 2017, BHP Billiton reported return on Assets of 5.27. On the
other Rio Tinto’s return on assets for 2017 stood more superior at 9.57. BHP Billiton has
modest and varied portfolio of tier one assets across the world with the lower cost choices for
the prospective growth and construction of value. This enables BHP Billiton to apply its
values and culture which emphasises on safety and productivity. BHP Billiton employs
by associating the net income with the average total assets. Alternatively, the return on assets
evaluates how effectively a business manages its assets to generate incomes during a
particular period (Khan, 2015). As the assets of the company forms the sole purpose of
generating the revenues and producing profits, the ratio is helpful to administration and
investors to understand how well a company can convert the investment in assets and profits.
Year 2017 2017
Particulars BHP Billiton Rio Tinto
Net Income 6222 8851
Average Total Assets 117979.5 92494.5
Return on Assets 5.27 9.57
BHP Billiton Rio Tinto
0.00
2.00
4.00
6.00
8.00
10.00
12.00
5.27
9.57
Return on Assets
Return on Assets
2017
Axis Title
Figure 1: Figure representing Return on Assets
Source: (As Created by Author)
In the financial year of 2017, BHP Billiton reported return on Assets of 5.27. On the
other Rio Tinto’s return on assets for 2017 stood more superior at 9.57. BHP Billiton has
modest and varied portfolio of tier one assets across the world with the lower cost choices for
the prospective growth and construction of value. This enables BHP Billiton to apply its
values and culture which emphasises on safety and productivity. BHP Billiton employs
⊘ This is a preview!⊘
Do you want full access?
Subscribe today to unlock all pages.
Trusted by 1+ million students worldwide
6MANAGEMENT ACCOUNTING
technology and uses disciplined investment to extract the most worth and maximum returns
from its assets.
Rio Tinto’s annualized return on assets for the year stood 9.57. Rio Tinto reported a
capitalized property plant and equipment of US $441 million. Additionally, the book value of
assets increasingly stood US $118 million. Understandably, Rio Tinto’s return on assets as
represents large investment in the capital assets with the ultimate objective of generating
greater revenue and producing higher profits (Barth, 2015). On a comparative note, the return
on assets of Rio Tinto’s stood stronger than BHP Billiton which implies that Rio Tinto has
the better ability of generating revenues and profits from its given assets.
Return on Ordinary Equity:
The return on ordinary equity or return on equity is the profitability ratio which
evaluates the capability of an organization to produce profits from the stakeholders’
investment in the company (Hoskin et al., 2014). Alternatively, the return on equity evaluates
the efficiency of the company to use its money from the shareholders to yield profits and
enlarge the business.
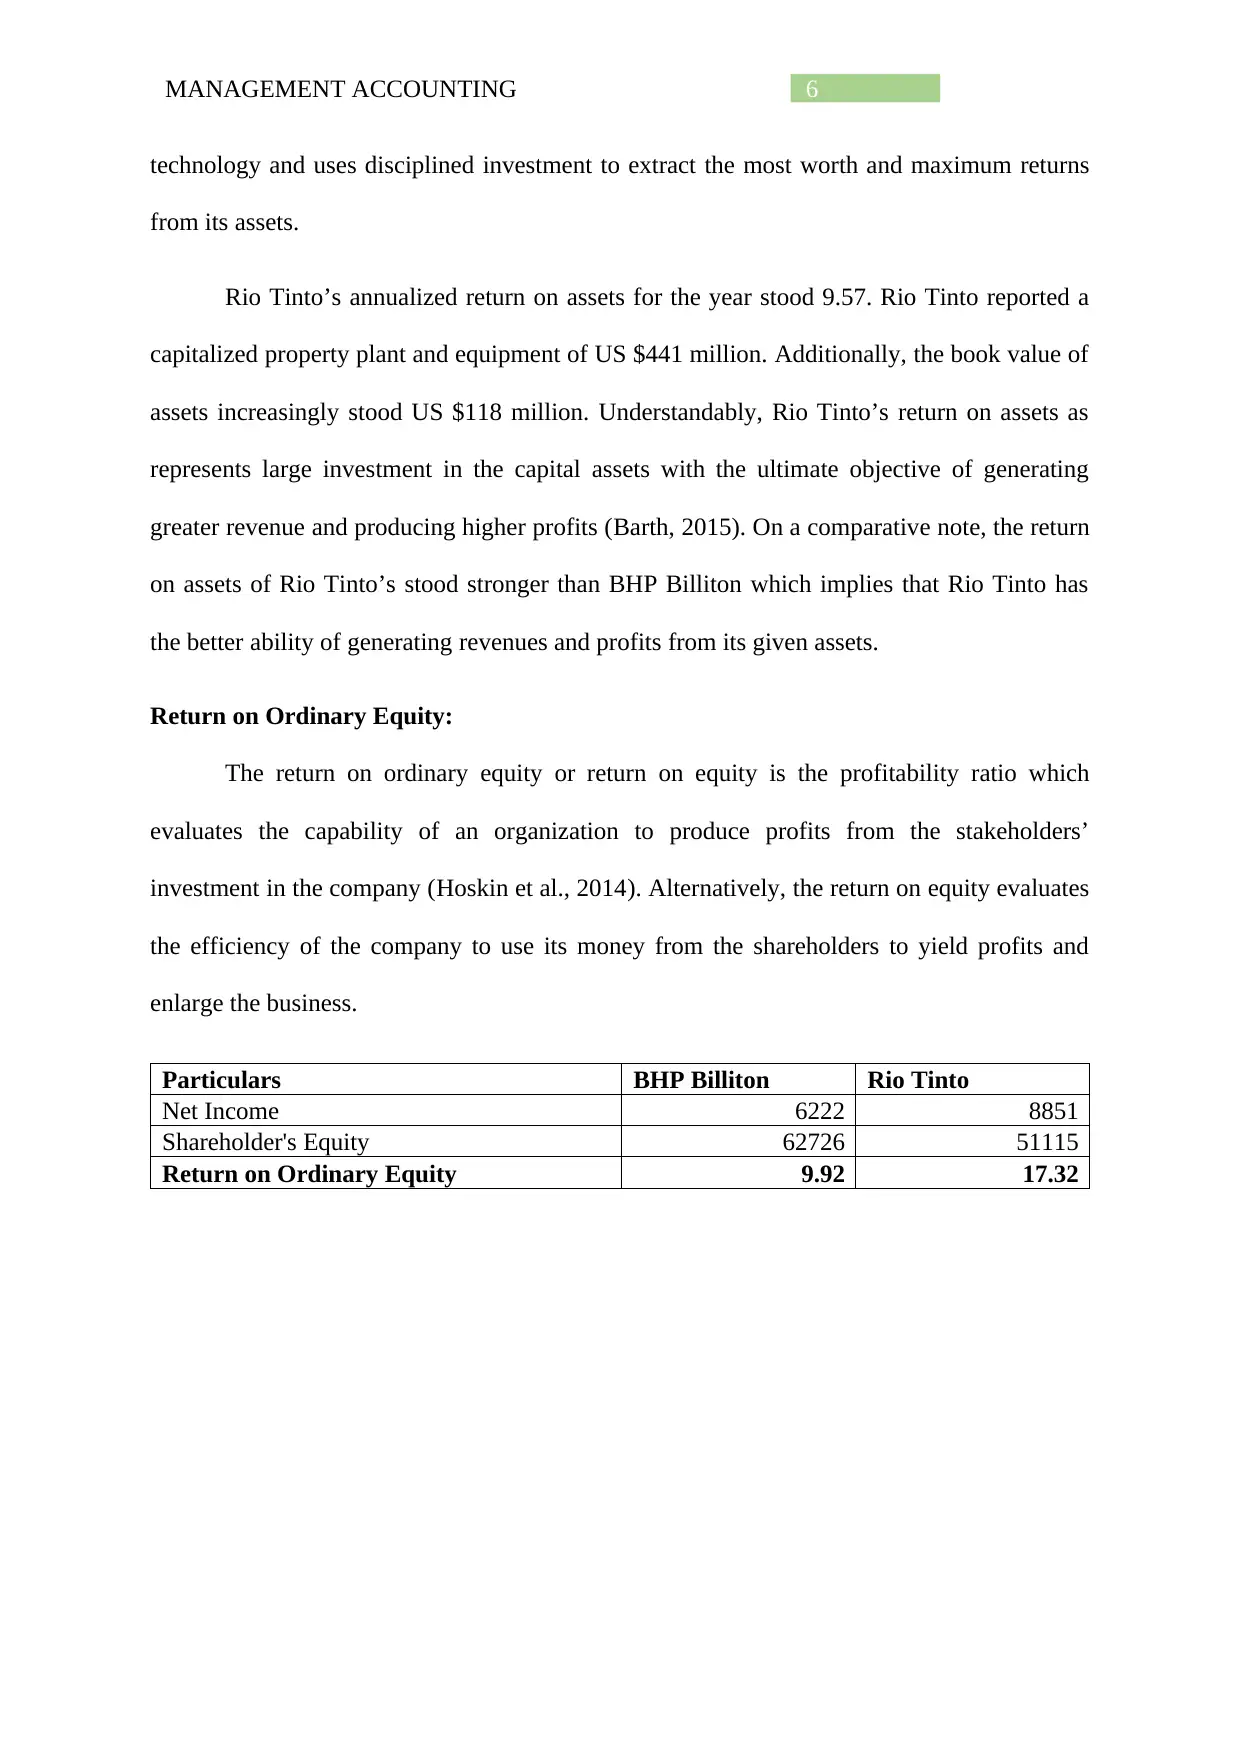
Particulars BHP Billiton Rio Tinto
Net Income 6222 8851
Shareholder's Equity 62726 51115
Return on Ordinary Equity 9.92 17.32
technology and uses disciplined investment to extract the most worth and maximum returns
from its assets.
Rio Tinto’s annualized return on assets for the year stood 9.57. Rio Tinto reported a
capitalized property plant and equipment of US $441 million. Additionally, the book value of
assets increasingly stood US $118 million. Understandably, Rio Tinto’s return on assets as
represents large investment in the capital assets with the ultimate objective of generating
greater revenue and producing higher profits (Barth, 2015). On a comparative note, the return
on assets of Rio Tinto’s stood stronger than BHP Billiton which implies that Rio Tinto has
the better ability of generating revenues and profits from its given assets.
Return on Ordinary Equity:
The return on ordinary equity or return on equity is the profitability ratio which
evaluates the capability of an organization to produce profits from the stakeholders’
investment in the company (Hoskin et al., 2014). Alternatively, the return on equity evaluates
the efficiency of the company to use its money from the shareholders to yield profits and
enlarge the business.
Particulars BHP Billiton Rio Tinto
Net Income 6222 8851
Shareholder's Equity 62726 51115
Return on Ordinary Equity 9.92 17.32
Paraphrase This Document
Need a fresh take? Get an instant paraphrase of this document with our AI Paraphraser
7MANAGEMENT ACCOUNTING
BHP Billiton Rio Tinto
0.00
2.00
4.00
6.00
8.00
10.00
12.00
14.00
16.00
18.00
20.00
9.92
17.32
Return on Ordinary Equity
Return on Ordinary Equity
2017
Axis Title
Figure 2: Figure representing Return on Ordinary Equity
Source: (As Created by Author)
The return on ordinary equity for BHP Billiton during the year 2017 stood 9.92 while
Rio Tinto reported a return on Equity of 17.32. The return on equity for BHP Billiton stood
comparatively low than Rio Tinto because of the Samarco dam failure in 2017. The company
however realised higher average prices from its equity accounting investments in 2017. The
company however reported an increase of US16.8 billion which reflects an increase from the
higher commodity prices from the equity accounted investments. Rio Tinto reported higher
return from its shareholder’s equity to include the equity dividends that are paid to the
shareholders. Rio Tinto has efficiently used its capital from the shareholders to produce
profits and expand the company (Pott, 2017). This designates that the business is using the
investors fund effectively compared to BHP Billiton.
Profit Margin:
The profit margin ratio is also known as the gross profit ratio that helps in measuring
the sum of net income that is produced with each dollar of sales derived by equating the net
income and the net sales of the business (Warren & Jones, 2018). The profit margin ratio
8MANAGEMENT ACCOUNTING
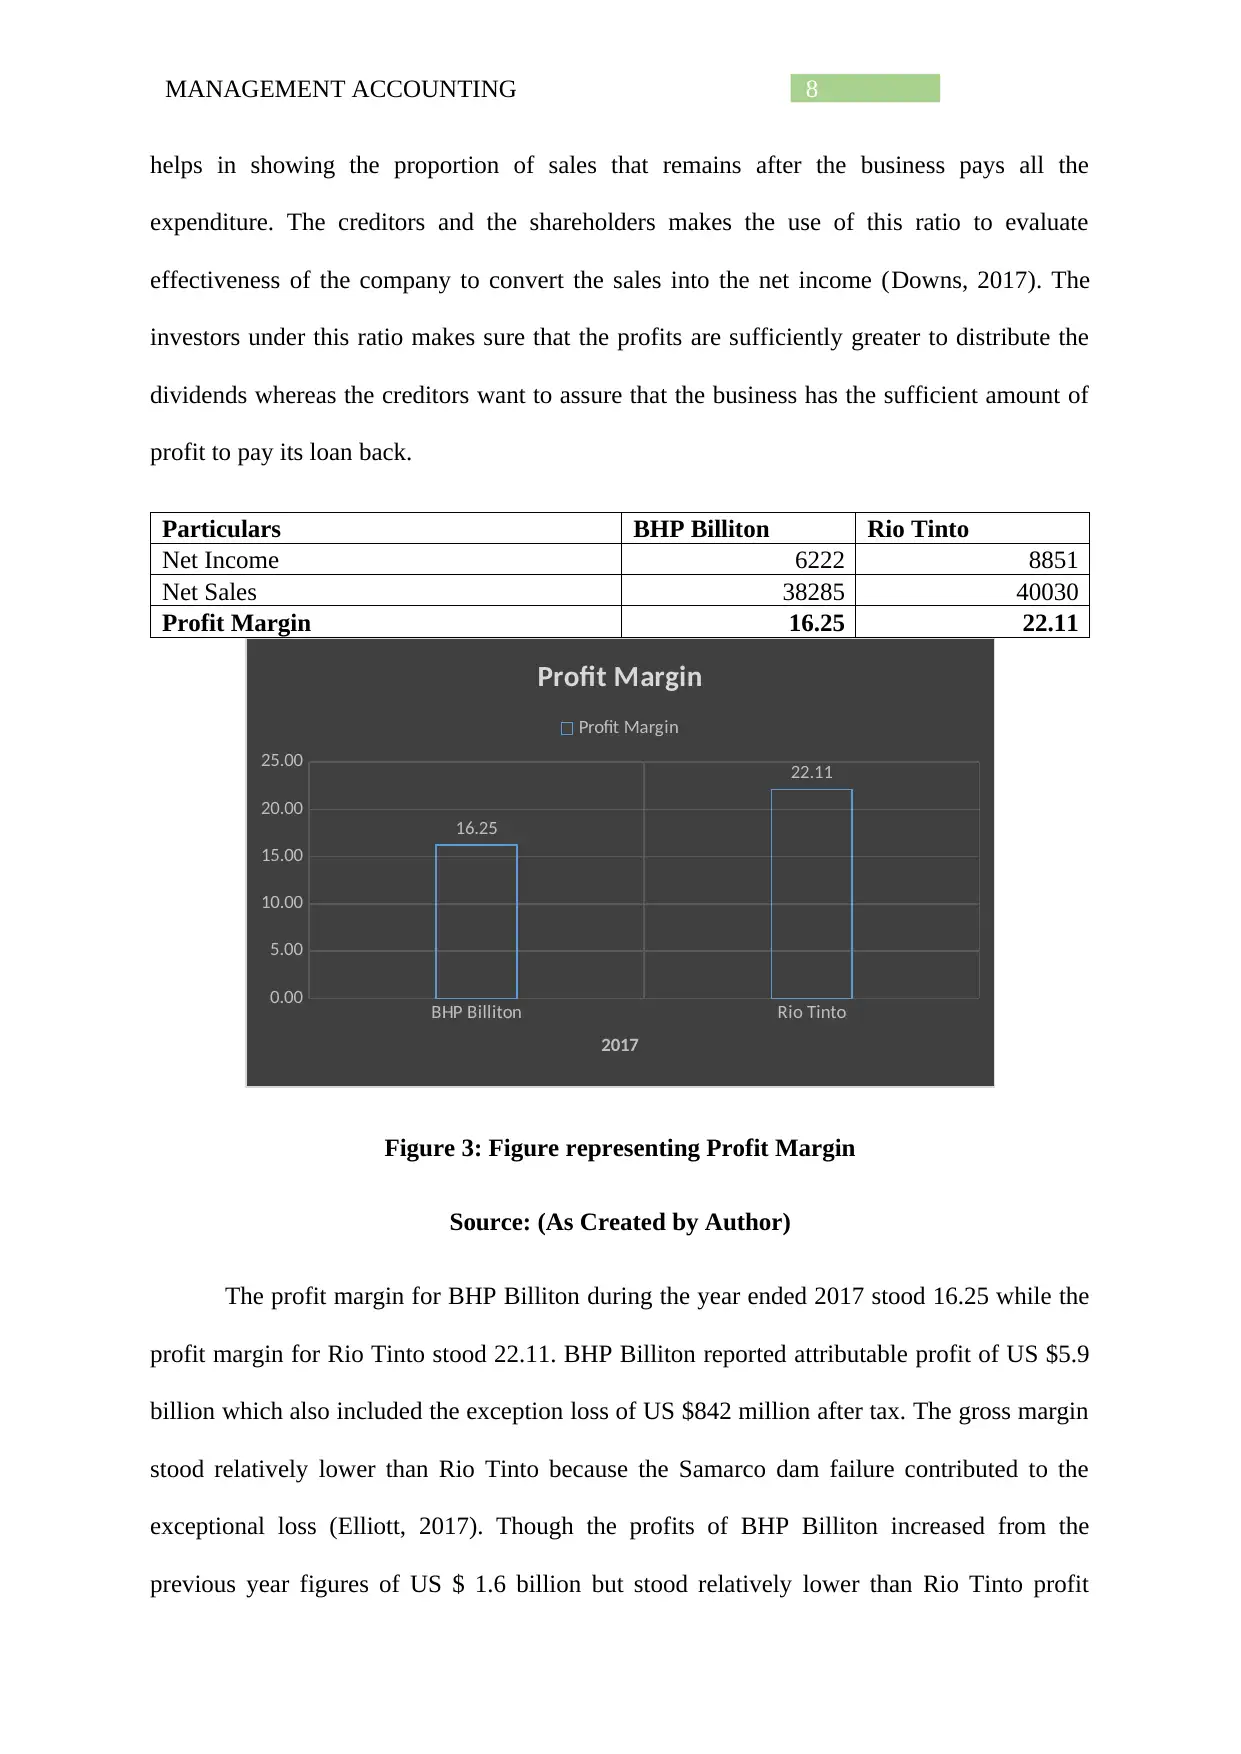
helps in showing the proportion of sales that remains after the business pays all the
expenditure. The creditors and the shareholders makes the use of this ratio to evaluate
effectiveness of the company to convert the sales into the net income (Downs, 2017). The
investors under this ratio makes sure that the profits are sufficiently greater to distribute the
dividends whereas the creditors want to assure that the business has the sufficient amount of
profit to pay its loan back.
Particulars BHP Billiton Rio Tinto
Net Income 6222 8851
Net Sales 38285 40030
Profit Margin 16.25 22.11
BHP Billiton Rio Tinto
0.00
5.00
10.00
15.00
20.00
25.00
16.25
22.11
Profit Margin
Profit Margin
2017
Figure 3: Figure representing Profit Margin
Source: (As Created by Author)
The profit margin for BHP Billiton during the year ended 2017 stood 16.25 while the
profit margin for Rio Tinto stood 22.11. BHP Billiton reported attributable profit of US $5.9
billion which also included the exception loss of US $842 million after tax. The gross margin
stood relatively lower than Rio Tinto because the Samarco dam failure contributed to the
exceptional loss (Elliott, 2017). Though the profits of BHP Billiton increased from the
previous year figures of US $ 1.6 billion but stood relatively lower than Rio Tinto profit
⊘ This is a preview!⊘
Do you want full access?
Subscribe today to unlock all pages.
Trusted by 1+ million students worldwide
9MANAGEMENT ACCOUNTING
margin of 22.11. It can be stated that Rio Tinto manages its expenditure relatively well in
proportion to its net sales.
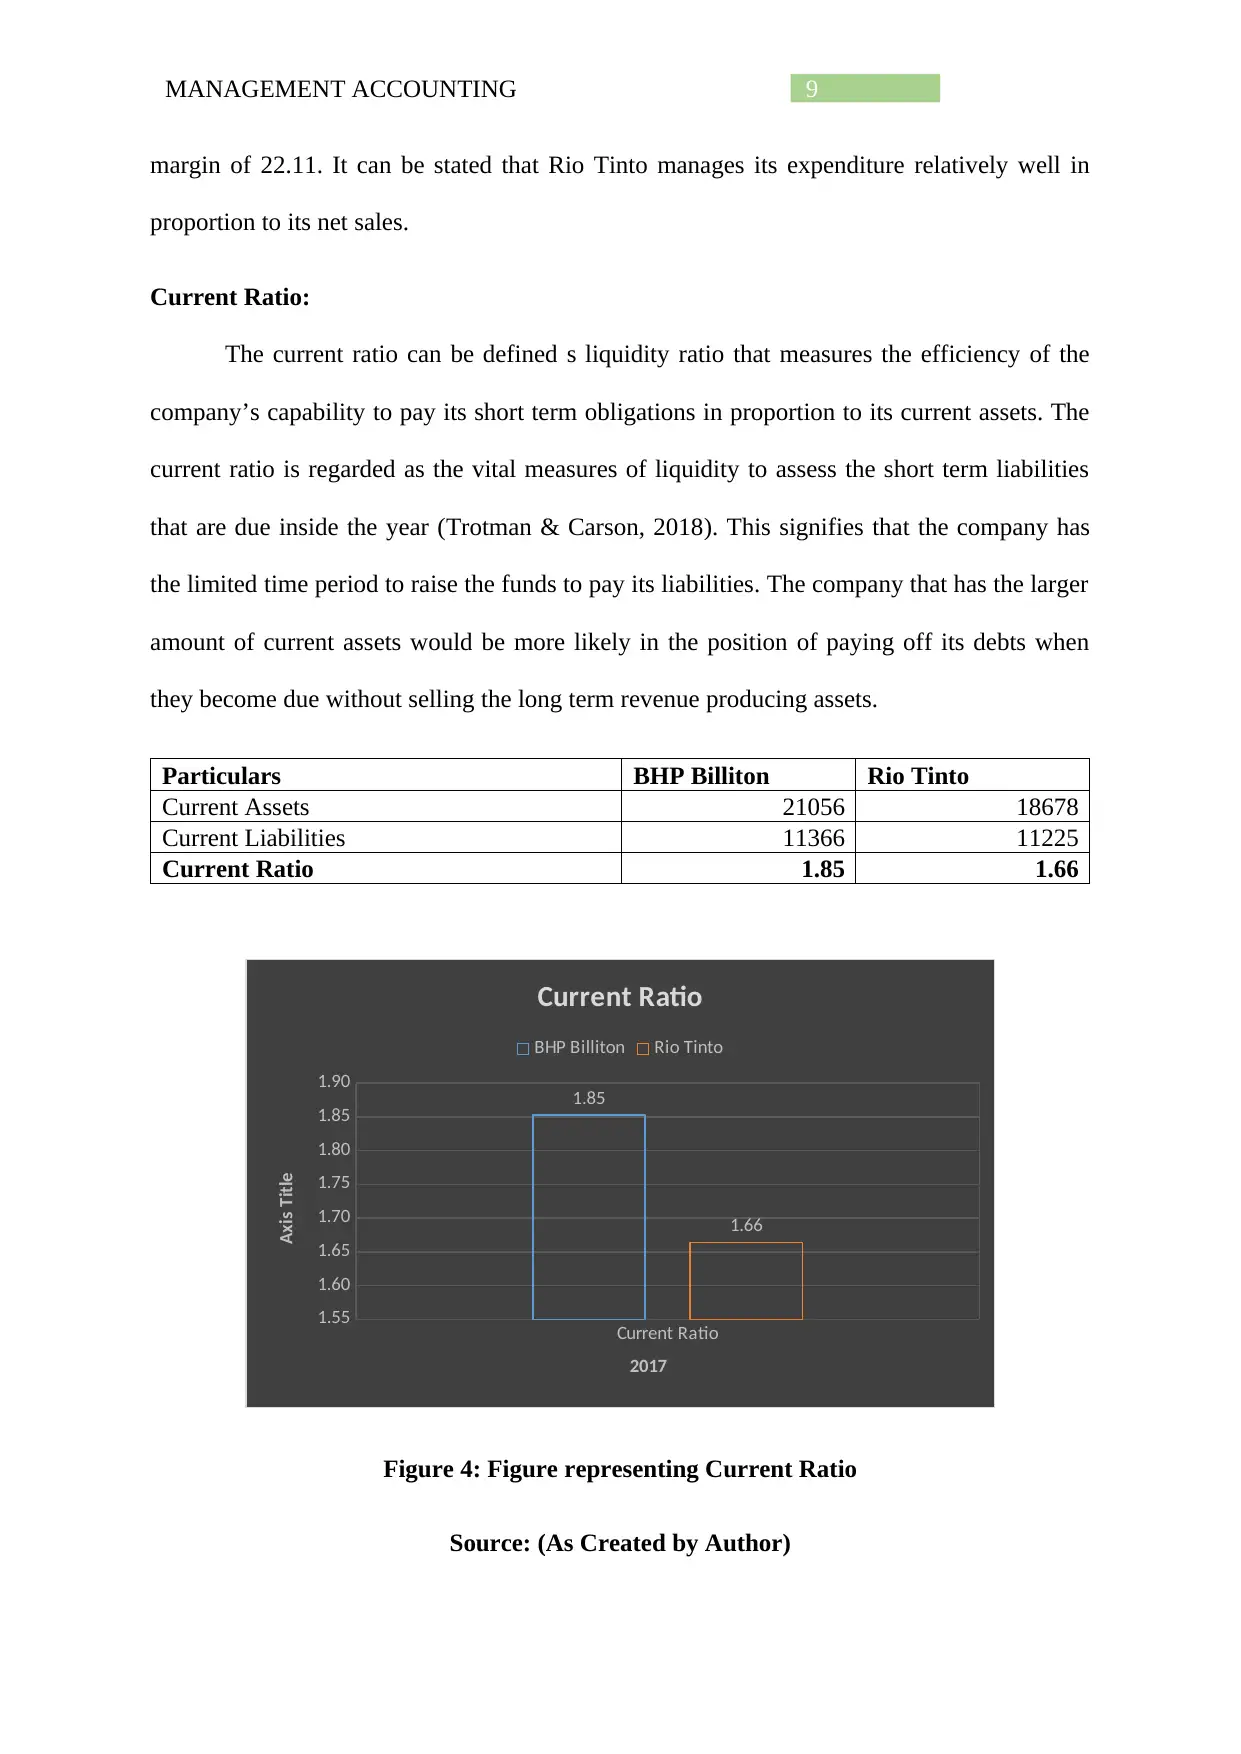
Current Ratio:
The current ratio can be defined s liquidity ratio that measures the efficiency of the
company’s capability to pay its short term obligations in proportion to its current assets. The
current ratio is regarded as the vital measures of liquidity to assess the short term liabilities
that are due inside the year (Trotman & Carson, 2018). This signifies that the company has
the limited time period to raise the funds to pay its liabilities. The company that has the larger
amount of current assets would be more likely in the position of paying off its debts when
they become due without selling the long term revenue producing assets.
Particulars BHP Billiton Rio Tinto
Current Assets 21056 18678
Current Liabilities 11366 11225
Current Ratio 1.85 1.66
Current Ratio
1.55
1.60
1.65
1.70
1.75
1.80
1.85
1.90 1.85
1.66
Current Ratio
BHP Billiton Rio Tinto
2017
Axis Title
Figure 4: Figure representing Current Ratio
Source: (As Created by Author)
margin of 22.11. It can be stated that Rio Tinto manages its expenditure relatively well in
proportion to its net sales.
Current Ratio:
The current ratio can be defined s liquidity ratio that measures the efficiency of the
company’s capability to pay its short term obligations in proportion to its current assets. The
current ratio is regarded as the vital measures of liquidity to assess the short term liabilities
that are due inside the year (Trotman & Carson, 2018). This signifies that the company has
the limited time period to raise the funds to pay its liabilities. The company that has the larger
amount of current assets would be more likely in the position of paying off its debts when
they become due without selling the long term revenue producing assets.
Particulars BHP Billiton Rio Tinto
Current Assets 21056 18678
Current Liabilities 11366 11225
Current Ratio 1.85 1.66
Current Ratio
1.55
1.60
1.65
1.70
1.75
1.80
1.85
1.90 1.85
1.66
Current Ratio
BHP Billiton Rio Tinto
2017
Axis Title
Figure 4: Figure representing Current Ratio
Source: (As Created by Author)
Paraphrase This Document
Need a fresh take? Get an instant paraphrase of this document with our AI Paraphraser
10MANAGEMENT ACCOUNTING
During the financial year of 2017 BHP Billiton reported the current ratio stood 1.85.
On the other hand, Rio Tinto reported the current ratio of 1.66. The current ratio for Rio Tinto
stood comparatively lower than the BHP Billiton (Arnold & Kyle, 2017). By gauging into the
current ratio of BHP Billiton the investors and creditors can understand that the liquidity
position of BHP Billiton is far more superior to Rio Tinto which signifies that the business is
better capable of paying its current liabilities. Furthermore, the current ratio of BHP Billiton
states that the firm’s current debt is in terms with the current assets than Rio Tinto as it more
easily makes the payments of current debt.
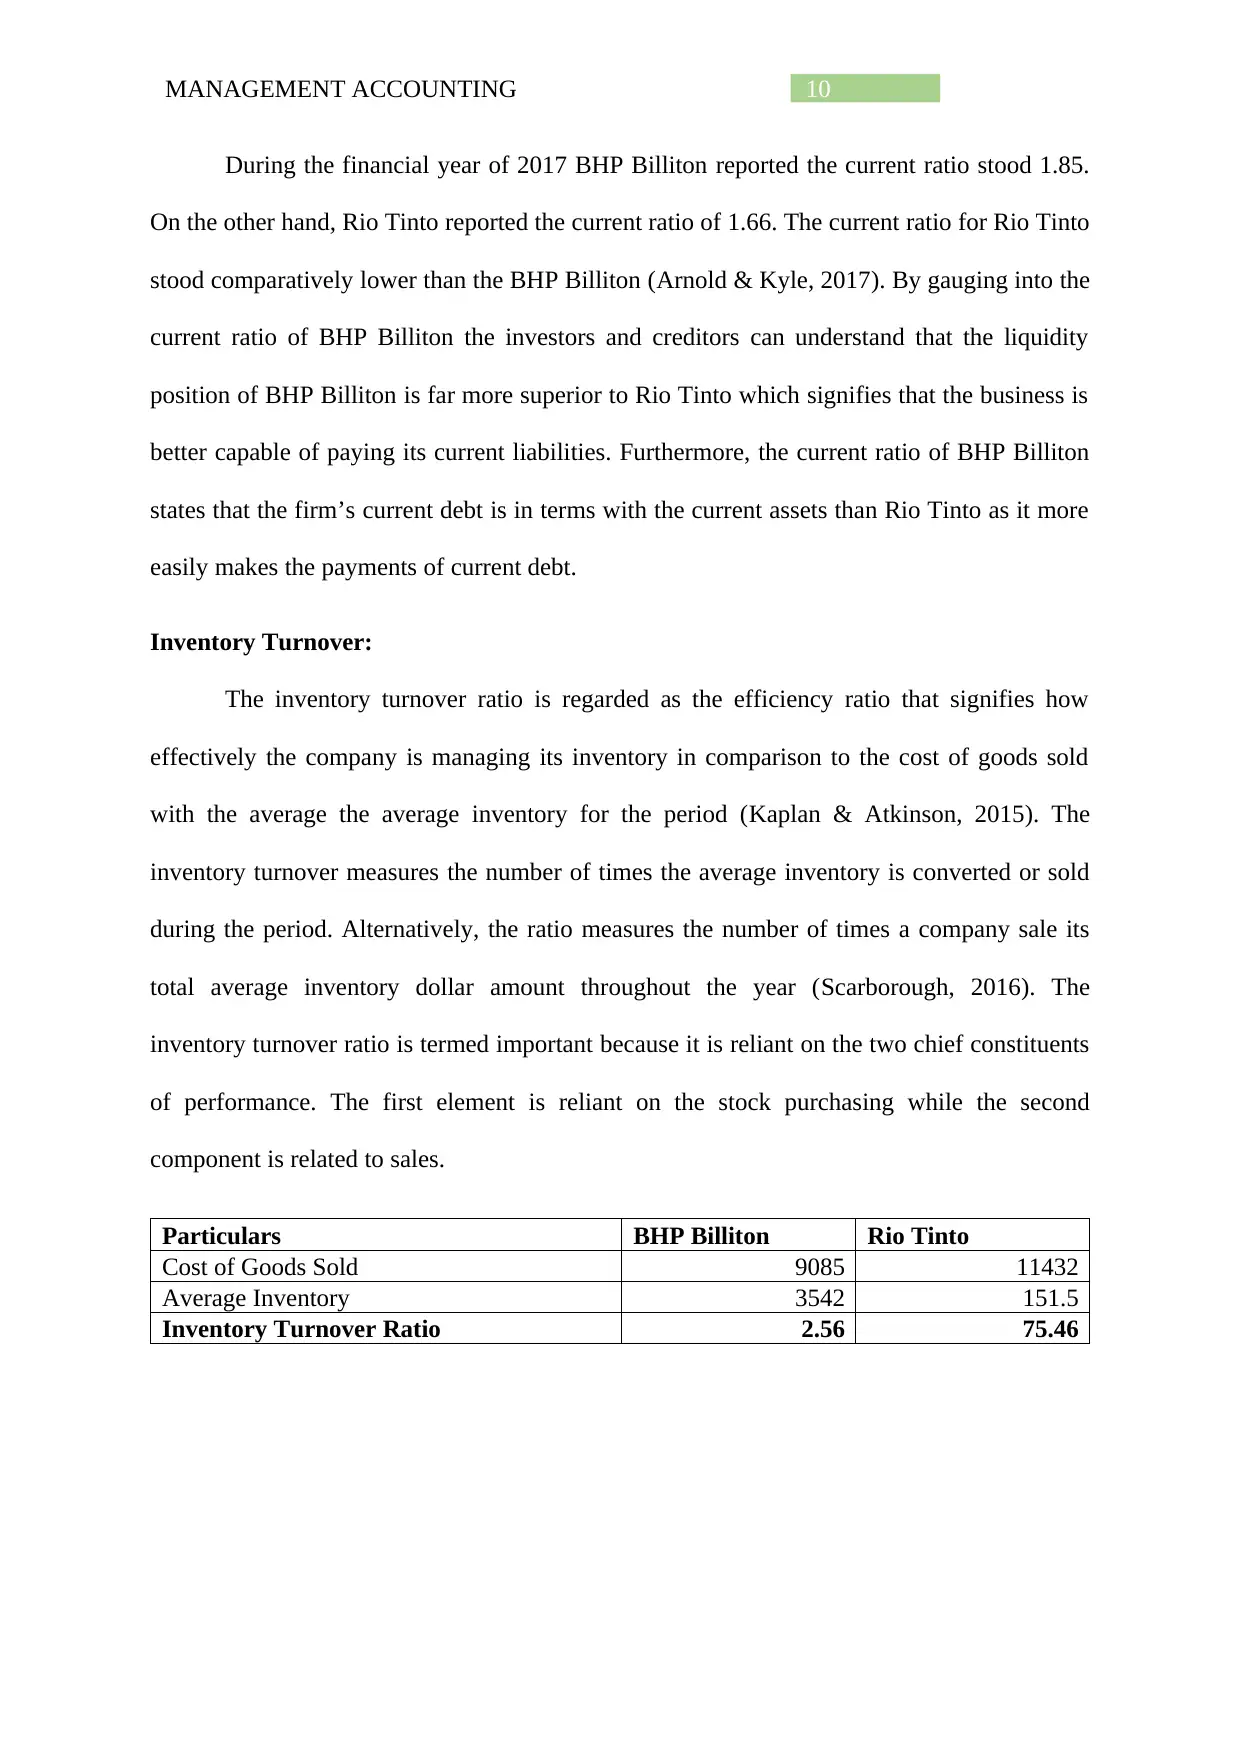
Inventory Turnover:
The inventory turnover ratio is regarded as the efficiency ratio that signifies how
effectively the company is managing its inventory in comparison to the cost of goods sold
with the average the average inventory for the period (Kaplan & Atkinson, 2015). The
inventory turnover measures the number of times the average inventory is converted or sold
during the period. Alternatively, the ratio measures the number of times a company sale its
total average inventory dollar amount throughout the year (Scarborough, 2016). The
inventory turnover ratio is termed important because it is reliant on the two chief constituents
of performance. The first element is reliant on the stock purchasing while the second
component is related to sales.
Particulars BHP Billiton Rio Tinto
Cost of Goods Sold 9085 11432
Average Inventory 3542 151.5
Inventory Turnover Ratio 2.56 75.46
During the financial year of 2017 BHP Billiton reported the current ratio stood 1.85.
On the other hand, Rio Tinto reported the current ratio of 1.66. The current ratio for Rio Tinto
stood comparatively lower than the BHP Billiton (Arnold & Kyle, 2017). By gauging into the
current ratio of BHP Billiton the investors and creditors can understand that the liquidity
position of BHP Billiton is far more superior to Rio Tinto which signifies that the business is
better capable of paying its current liabilities. Furthermore, the current ratio of BHP Billiton
states that the firm’s current debt is in terms with the current assets than Rio Tinto as it more
easily makes the payments of current debt.
Inventory Turnover:
The inventory turnover ratio is regarded as the efficiency ratio that signifies how
effectively the company is managing its inventory in comparison to the cost of goods sold
with the average the average inventory for the period (Kaplan & Atkinson, 2015). The
inventory turnover measures the number of times the average inventory is converted or sold
during the period. Alternatively, the ratio measures the number of times a company sale its
total average inventory dollar amount throughout the year (Scarborough, 2016). The
inventory turnover ratio is termed important because it is reliant on the two chief constituents
of performance. The first element is reliant on the stock purchasing while the second
component is related to sales.
Particulars BHP Billiton Rio Tinto
Cost of Goods Sold 9085 11432
Average Inventory 3542 151.5
Inventory Turnover Ratio 2.56 75.46
11MANAGEMENT ACCOUNTING
BHP Billiton Rio Tinto
0.00
10.00
20.00
30.00
40.00
50.00
60.00
70.00
80.00
2.56
75.46
Inventory Turnover Ratio
Inventory Turnover Ratio
2017
Axis Title
Figure 5: Figure representing Inventory Turnover Ratio
Source: (As Created by Author)
The inventory turnover for BHP Billiton and Rio Tinto is computed as cost of goods
sold divided by the total inventories. The inventory turnover ratio for BHP Billiton stood 2.56
times for the financial year ended 2017 whereas Rio Tinto reported inventory turnover of
75.46 times. BHP Billiton recognizes the inventory and based on the stage of production
procedure. BHP Billiton realises the inventory at the lower costs and net realisable value. The
cost is ascertained primarily on the basis of average costs.
Rio Tinto average of cost is computed by referring to the level of cost during the
relevant month along with the opening inventory (Langfield-Smith et al., 2017). The
inventory turnover of Rio Tinto is comparatively better than BHP Billiton because the stock
purchase resulted in greater sales of inventory which ultimately improved its inventory. The
real cause of BHP Billiton lower inventory turnover ratio is that the first component of stock
purchase is larger which amounts to accumulation of stocks and ultimately contributing to the
storage costs and holding of other assets.
⊘ This is a preview!⊘
Do you want full access?
Subscribe today to unlock all pages.
Trusted by 1+ million students worldwide
1 out of 32
Related Documents


Your All-in-One AI-Powered Toolkit for Academic Success.
+13062052269
info@desklib.com
Available 24*7 on WhatsApp / Email
![[object Object]](/_next/static/media/star-bottom.7253800d.svg)
Unlock your academic potential
Copyright © 2020–2026 A2Z Services. All Rights Reserved. Developed and managed by ZUCOL.