Management Accounting Report: Analysis for Smart Looks Ltd
VerifiedAdded on 2020/02/14
|18
|3165
|106
Report
AI Summary
This management accounting report examines Smart Looks Ltd, a UK-based clothing retailer, and applies various management accounting tools. The report begins with cost classifications (fixed, variable, semi-variable, direct, indirect, product, period, controllable, sunk, and opportunity costs) and then calculates total and unit costs, analyzing the relationship between production volume and cost. Inventory valuation methods (FIFO, LIFO, and average cost) are calculated. The report also provides a cost of goods sold report, suggests critical factors and performance indicators, and explores cost reduction and value enhancement strategies. Task 2 focuses on budgeting, including sales, production, raw materials, labor, overhead, and cash budgets. Finally, the report considers marginal costing techniques to determine selling prices and compares budgeted and actual profits. Overall, the report provides a comprehensive analysis of Smart Looks Ltd's financial performance and offers recommendations for improvement.
MANAGEMENT
ACCOUNTING
ACCOUNTING
Paraphrase This Document
Need a fresh take? Get an instant paraphrase of this document with our AI Paraphraser
TABLE OF CONTENTS
INTRODUCTION...........................................................................................................................5
TASK 1............................................................................................................................................5
Q1...........................................................................................................................................5
a) Classify the costs into Fixed, Variable and Semi-variable cost.........................................5
b) Explain other ways of classifying cost...............................................................................5
Q2...........................................................................................................................................7
a) Calculate total and unit costs.............................................................................................7
b) Analyze the cost data.........................................................................................................7
Q3. Calculation of inventory..................................................................................................8
1.FIFO Method ......................................................................................................................8
2.LIFO Method.......................................................................................................................8
3.Average Cost Method..........................................................................................................9
Q4. Prepare report of cost of goods sold................................................................................9
Q5.........................................................................................................................................10
a) Suggest 2 critical factors and performance indicators .....................................................10
B (1) How costs can be reduced...........................................................................................10
B (2) How value and quality can be enhanced.....................................................................11
TASK 2..........................................................................................................................................11
Q6. Usefulness of preparing budget.....................................................................................11
Q7. Preparation of budgets...................................................................................................12
Q8. Preparation of cash budget............................................................................................13
TASK 3..........................................................................................................................................14
Q9) 4.2 Comparison of budgeted and actual profit for Smart Looks Ltd............................14
Computation of selling price by considering the marginal costing technique.....................14
CONCLUSION..............................................................................................................................17
REFERENCES..............................................................................................................................18
Index of Tables
Table 1: Calculation of total costs and unit costs...........................................................................7
Table 2: Analysis of cost data..........................................................................................................7
Table 3: FIFO Method.....................................................................................................................8
Table 4: LIFO Method.....................................................................................................................8
Table 5: Average Cost Method........................................................................................................9
Table 6: Sales Budget....................................................................................................................12
Table 7: Production budget............................................................................................................12
Table 8: Raw Material purchases budget.......................................................................................12
Table 9: Labor budget....................................................................................................................13
Table 10: overhead budget.............................................................................................................13
Table 11: Cash Budget...................................................................................................................14
⊘ This is a preview!⊘
Do you want full access?
Subscribe today to unlock all pages.
Trusted by 1+ million students worldwide

Illustration Index
Illustration 1: Cost Classificationsource:http://www.yourarticlelibrary.com..................................6
Illustration 1: Cost Classificationsource:http://www.yourarticlelibrary.com..................................6
Paraphrase This Document
Need a fresh take? Get an instant paraphrase of this document with our AI Paraphraser
INTRODUCTION
Smart looks limited is a clothing retailer based in UK. management accounting is a
approach which enables the managers to take timely decision aiming at providing the right
information. this report enables us to understand various management tools like costing,
budgeting and inventory level tools, calculation of marginal costing and calculation of the actual
and budgeted costs and preparation of report and these tools are useful for understanding and
also forecasting the decision making process of smart looks limited. it also aims at determining
the differences between the actual and the standards costs and the reasons for deviations and
corrections taken thereafter.
TASK 1
Q1.
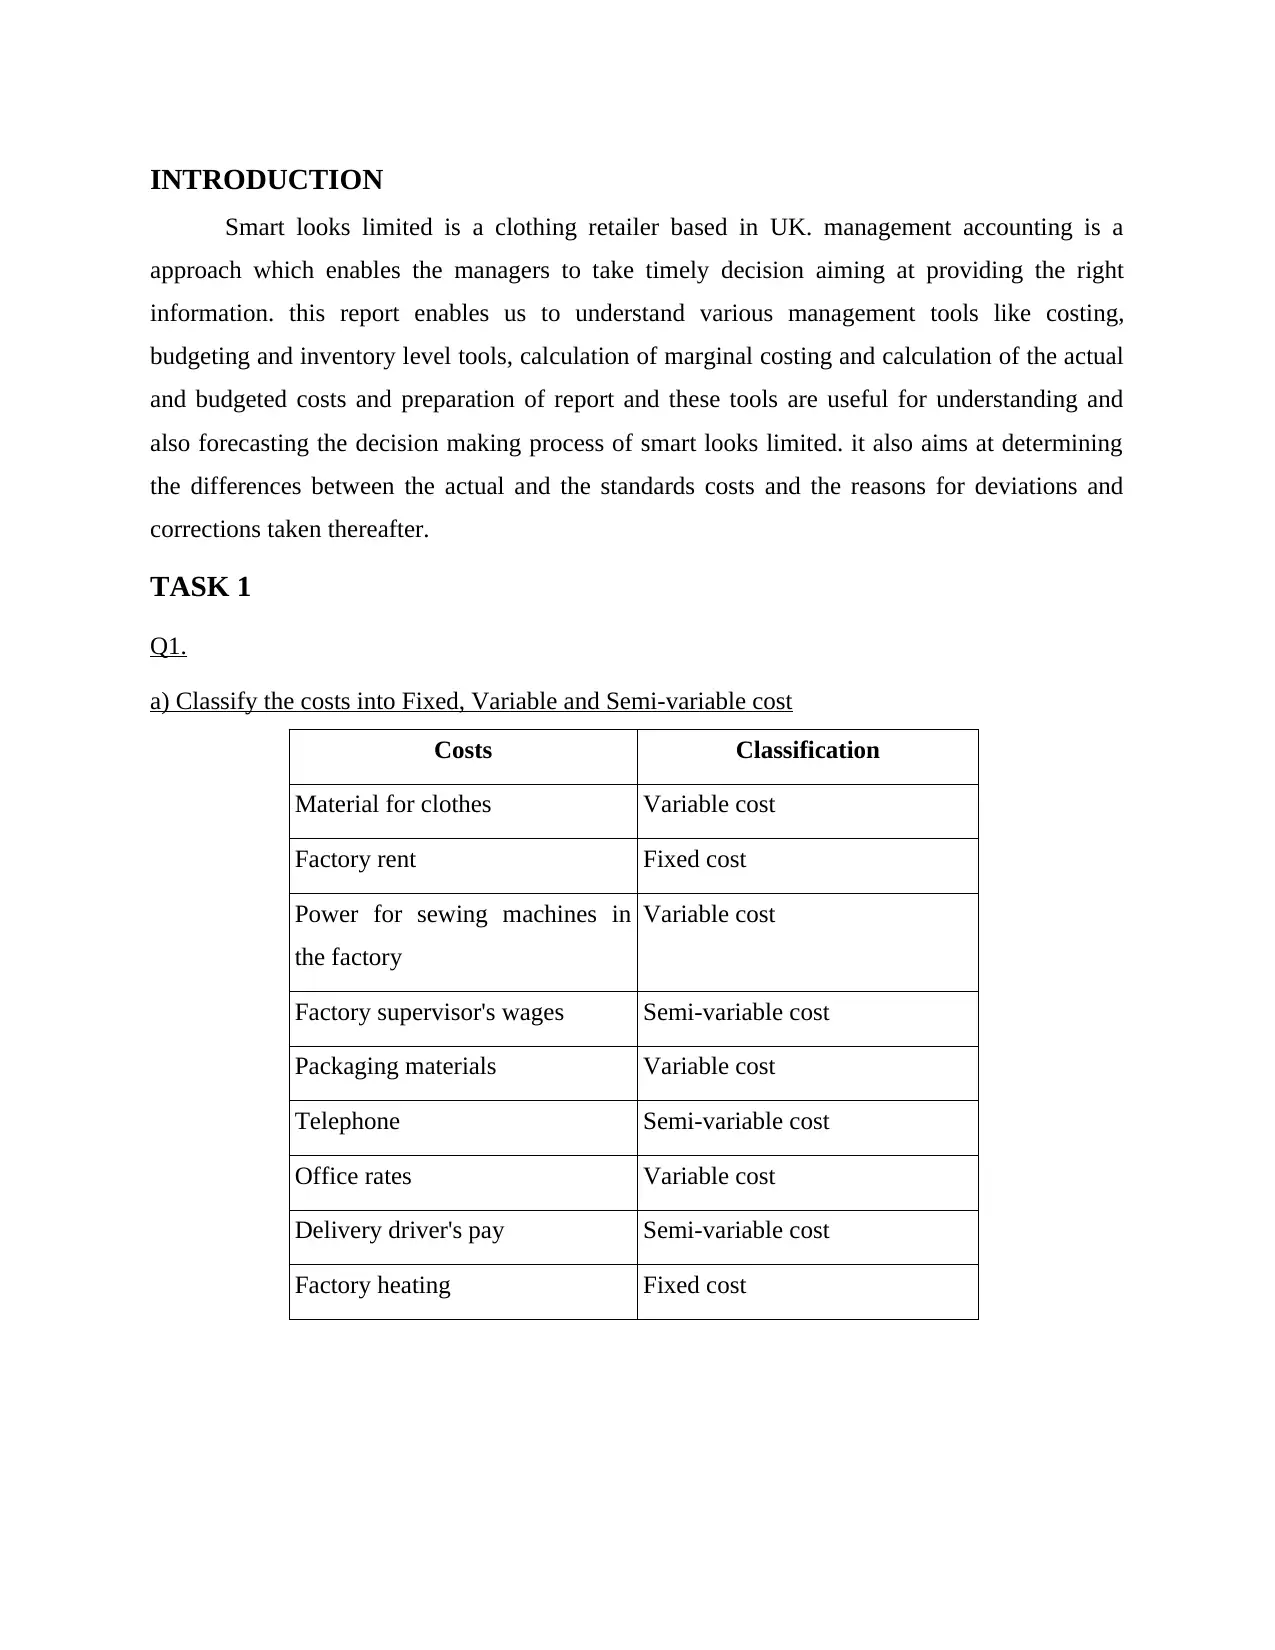
a) Classify the costs into Fixed, Variable and Semi-variable cost
Costs Classification
Material for clothes Variable cost
Factory rent Fixed cost
Power for sewing machines in
the factory
Variable cost
Factory supervisor's wages Semi-variable cost
Packaging materials Variable cost
Telephone Semi-variable cost
Office rates Variable cost
Delivery driver's pay Semi-variable cost
Factory heating Fixed cost
Smart looks limited is a clothing retailer based in UK. management accounting is a
approach which enables the managers to take timely decision aiming at providing the right
information. this report enables us to understand various management tools like costing,
budgeting and inventory level tools, calculation of marginal costing and calculation of the actual
and budgeted costs and preparation of report and these tools are useful for understanding and
also forecasting the decision making process of smart looks limited. it also aims at determining
the differences between the actual and the standards costs and the reasons for deviations and
corrections taken thereafter.
TASK 1
Q1.
a) Classify the costs into Fixed, Variable and Semi-variable cost
Costs Classification
Material for clothes Variable cost
Factory rent Fixed cost
Power for sewing machines in
the factory
Variable cost
Factory supervisor's wages Semi-variable cost
Packaging materials Variable cost
Telephone Semi-variable cost
Office rates Variable cost
Delivery driver's pay Semi-variable cost
Factory heating Fixed cost
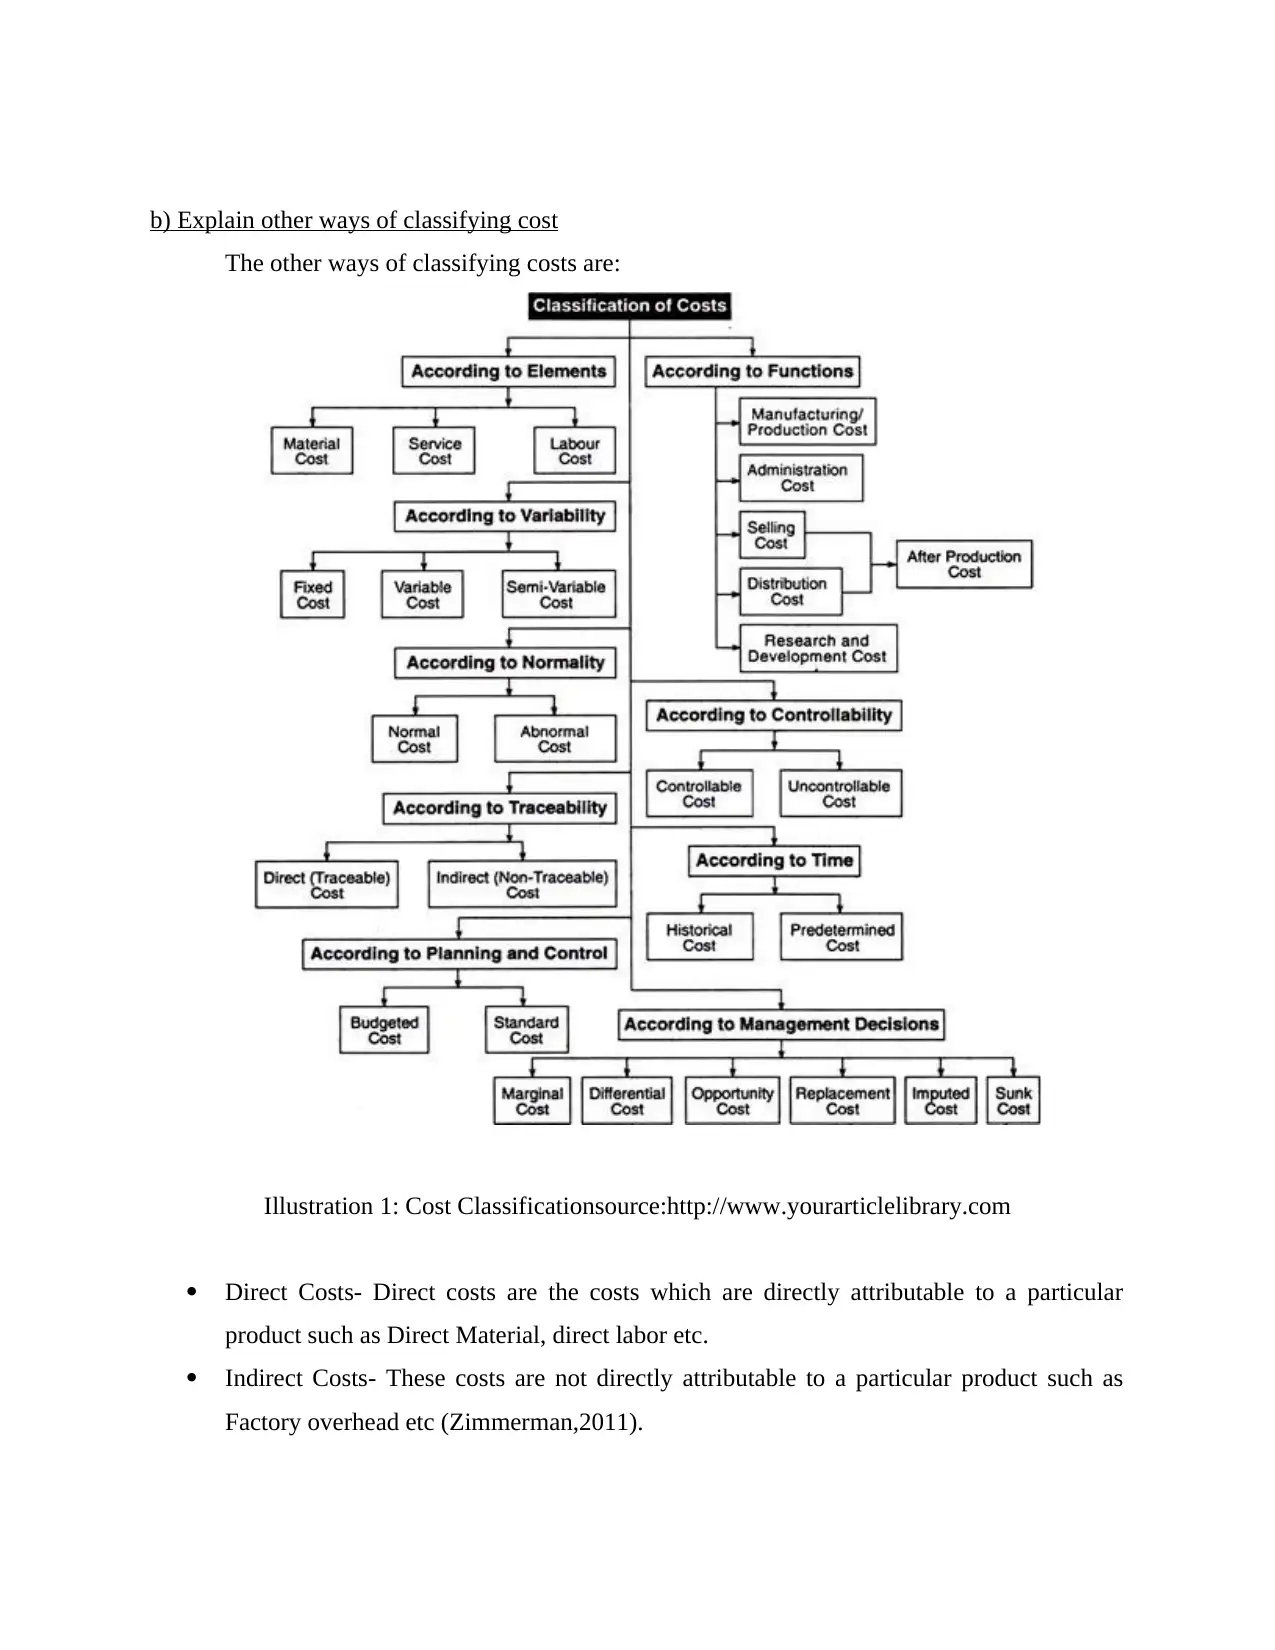
b) Explain other ways of classifying cost
The other ways of classifying costs are:
Illustration 1: Cost Classificationsource:http://www.yourarticlelibrary.com
Direct Costs- Direct costs are the costs which are directly attributable to a particular
product such as Direct Material, direct labor etc.
Indirect Costs- These costs are not directly attributable to a particular product such as
Factory overhead etc (Zimmerman,2011).
⊘ This is a preview!⊘
Do you want full access?
Subscribe today to unlock all pages.
Trusted by 1+ million students worldwide

Product Costs- These costs can be identifies to a individual product. It is the cost which is
incurred when we create a product. Examples are direct material, Factory overhead etc.
Period Costs- These costs cannot be identifies on the individual product and these cost
continues for a period of time like depreciation, advertising expenses etc.
Controllable costs- Controllable costs are the costs can be controlled by the management
like direct expenses, labor etc.
Sunk Costs- As the name suggests, these are the costs which cannot be recovered as they
have already been incurred and thus they are not even considered for decision making.
Example can the cost incurred on training (Pitkänen and Lukka, 2011).
Opportunity Costs- When once alternative is chosen over the another and the cost so
foregone is opportunity costs. These are costs which are considered for decision making.
Q2.
a) Calculate total and unit costs
Table 1: Calculation of total costs and unit costs
15000 units 20000 units 25000 units
Material £5 £75000 £100000 £125000
Labor £6 £90000 £120000 £150000
Total fixed costs £50000 £50000 £50000
Unit Costs ( Total cost /
number of units)
£14.33 £13.5 £13
Material £5 £75000 £100000 £125000
Labor £6 £90000 £120000 £150000
Total fixed costs £50000 £50000 £50000
Total Costs £215000 £270000 £325000
Paraphrase This Document
Need a fresh take? Get an instant paraphrase of this document with our AI Paraphraser
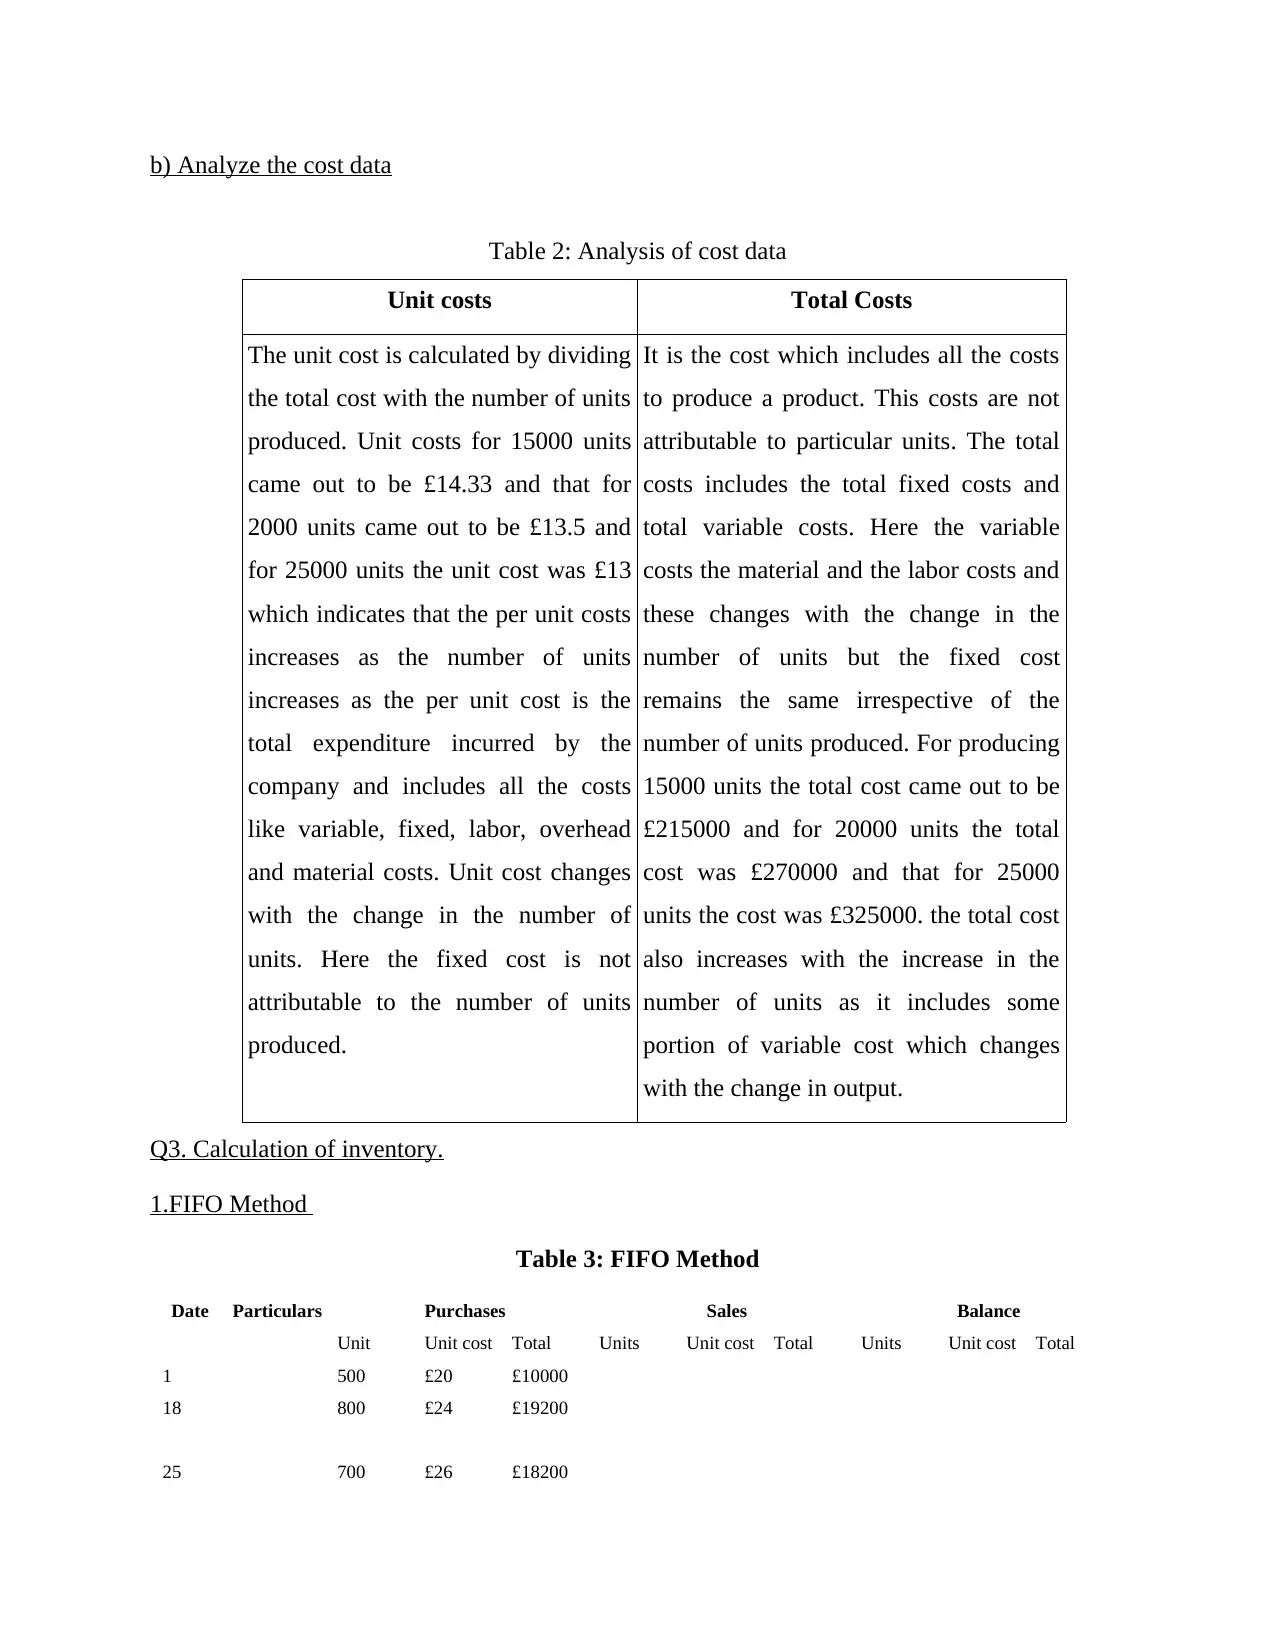
b) Analyze the cost data
Table 2: Analysis of cost data
Unit costs Total Costs
The unit cost is calculated by dividing
the total cost with the number of units
produced. Unit costs for 15000 units
came out to be £14.33 and that for
2000 units came out to be £13.5 and
for 25000 units the unit cost was £13
which indicates that the per unit costs
increases as the number of units
increases as the per unit cost is the
total expenditure incurred by the
company and includes all the costs
like variable, fixed, labor, overhead
and material costs. Unit cost changes
with the change in the number of
units. Here the fixed cost is not
attributable to the number of units
produced.
It is the cost which includes all the costs
to produce a product. This costs are not
attributable to particular units. The total
costs includes the total fixed costs and
total variable costs. Here the variable
costs the material and the labor costs and
these changes with the change in the
number of units but the fixed cost
remains the same irrespective of the
number of units produced. For producing
15000 units the total cost came out to be
£215000 and for 20000 units the total
cost was £270000 and that for 25000
units the cost was £325000. the total cost
also increases with the increase in the
number of units as it includes some
portion of variable cost which changes
with the change in output.
Q3. Calculation of inventory.
1.FIFO Method
Table 3: FIFO Method
Date Particulars Purchases Sales Balance
Unit Unit cost Total Units Unit cost Total Units Unit cost Total
1 500 £20 £10000
18 800 £24 £19200
25 700 £26 £18200
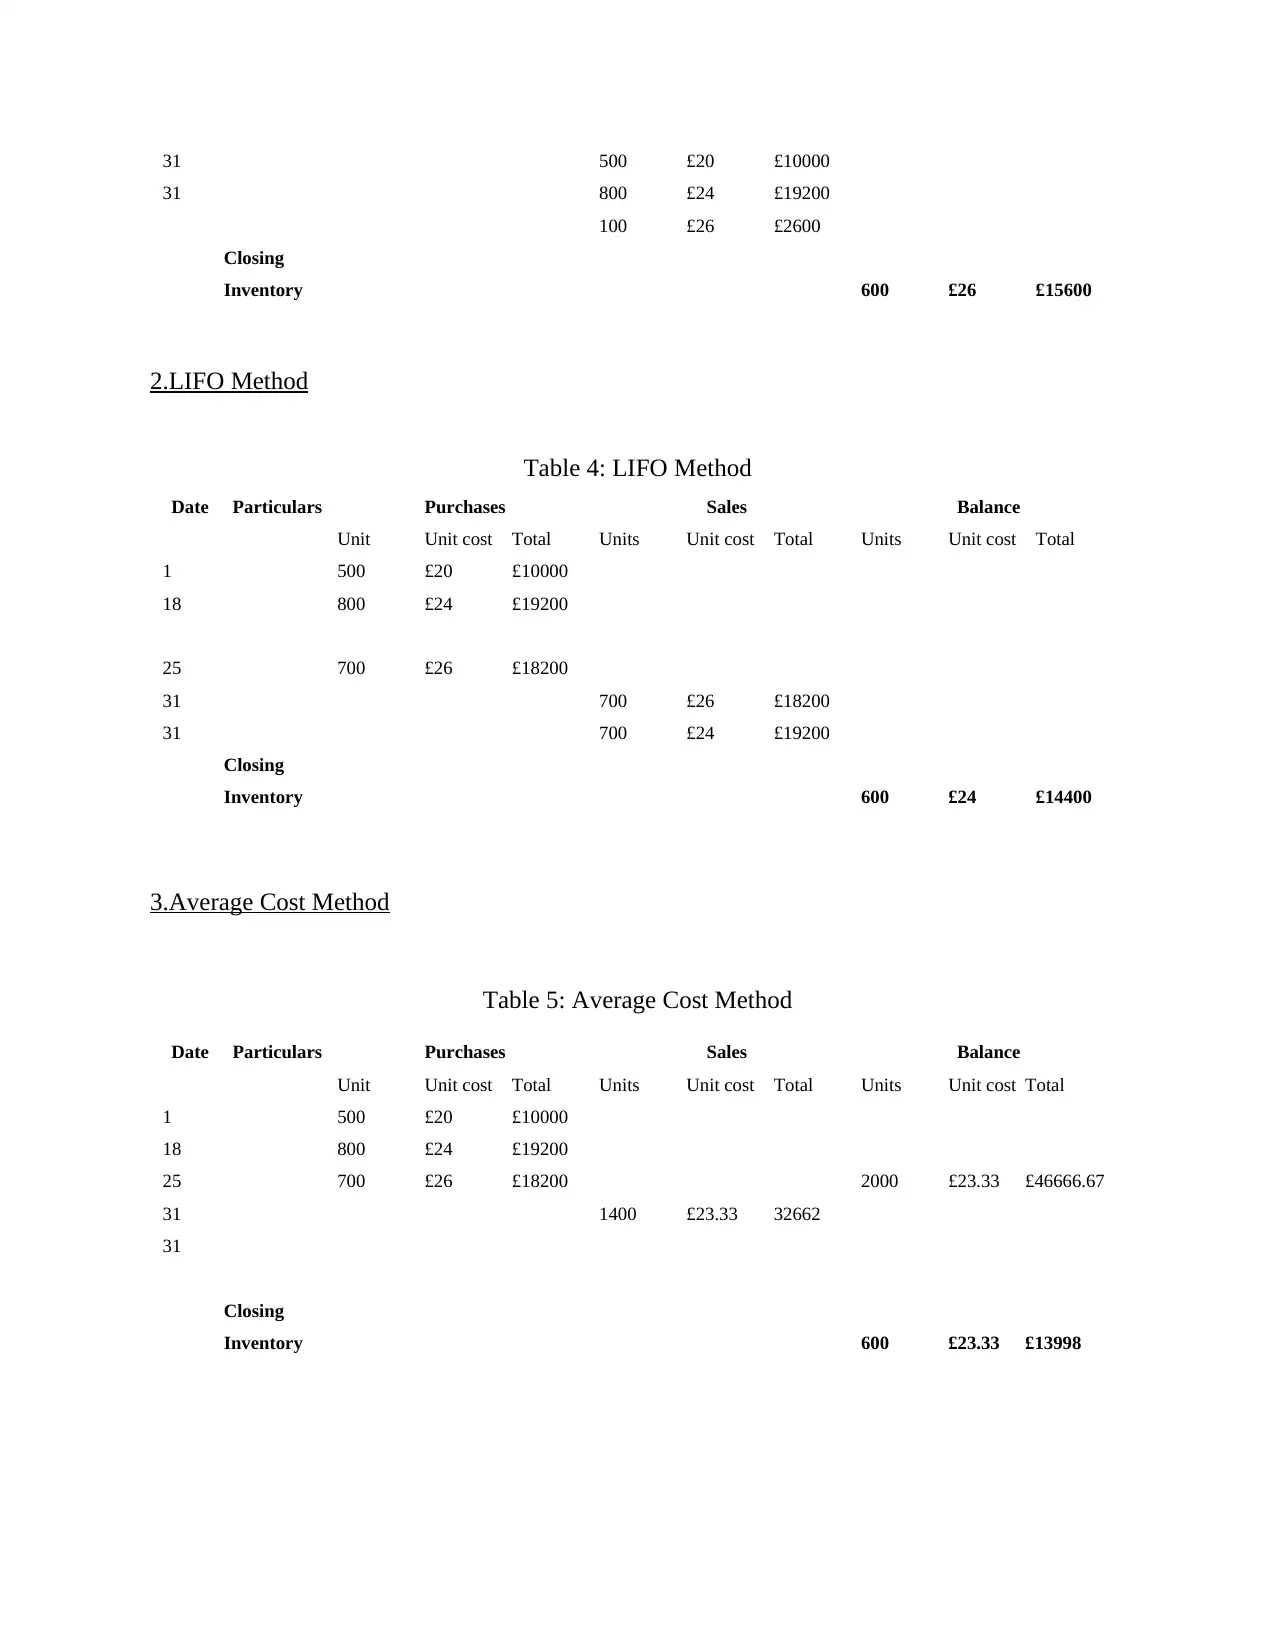
31 500 £20 £10000
31 800 £24 £19200
100 £26 £2600
Closing
Inventory 600 £26 £15600
2.LIFO Method
Table 4: LIFO Method
Date Particulars Purchases Sales Balance
Unit Unit cost Total Units Unit cost Total Units Unit cost Total
1 500 £20 £10000
18 800 £24 £19200
25 700 £26 £18200
31 700 £26 £18200
31 700 £24 £19200
Closing
Inventory 600 £24 £14400
3.Average Cost Method
Table 5: Average Cost Method
Date Particulars Purchases Sales Balance
Unit Unit cost Total Units Unit cost Total Units Unit cost Total
1 500 £20 £10000
18 800 £24 £19200
25 700 £26 £18200 2000 £23.33 £46666.67
31 1400 £23.33 32662
31
Closing
Inventory 600 £23.33 £13998
⊘ This is a preview!⊘
Do you want full access?
Subscribe today to unlock all pages.
Trusted by 1+ million students worldwide
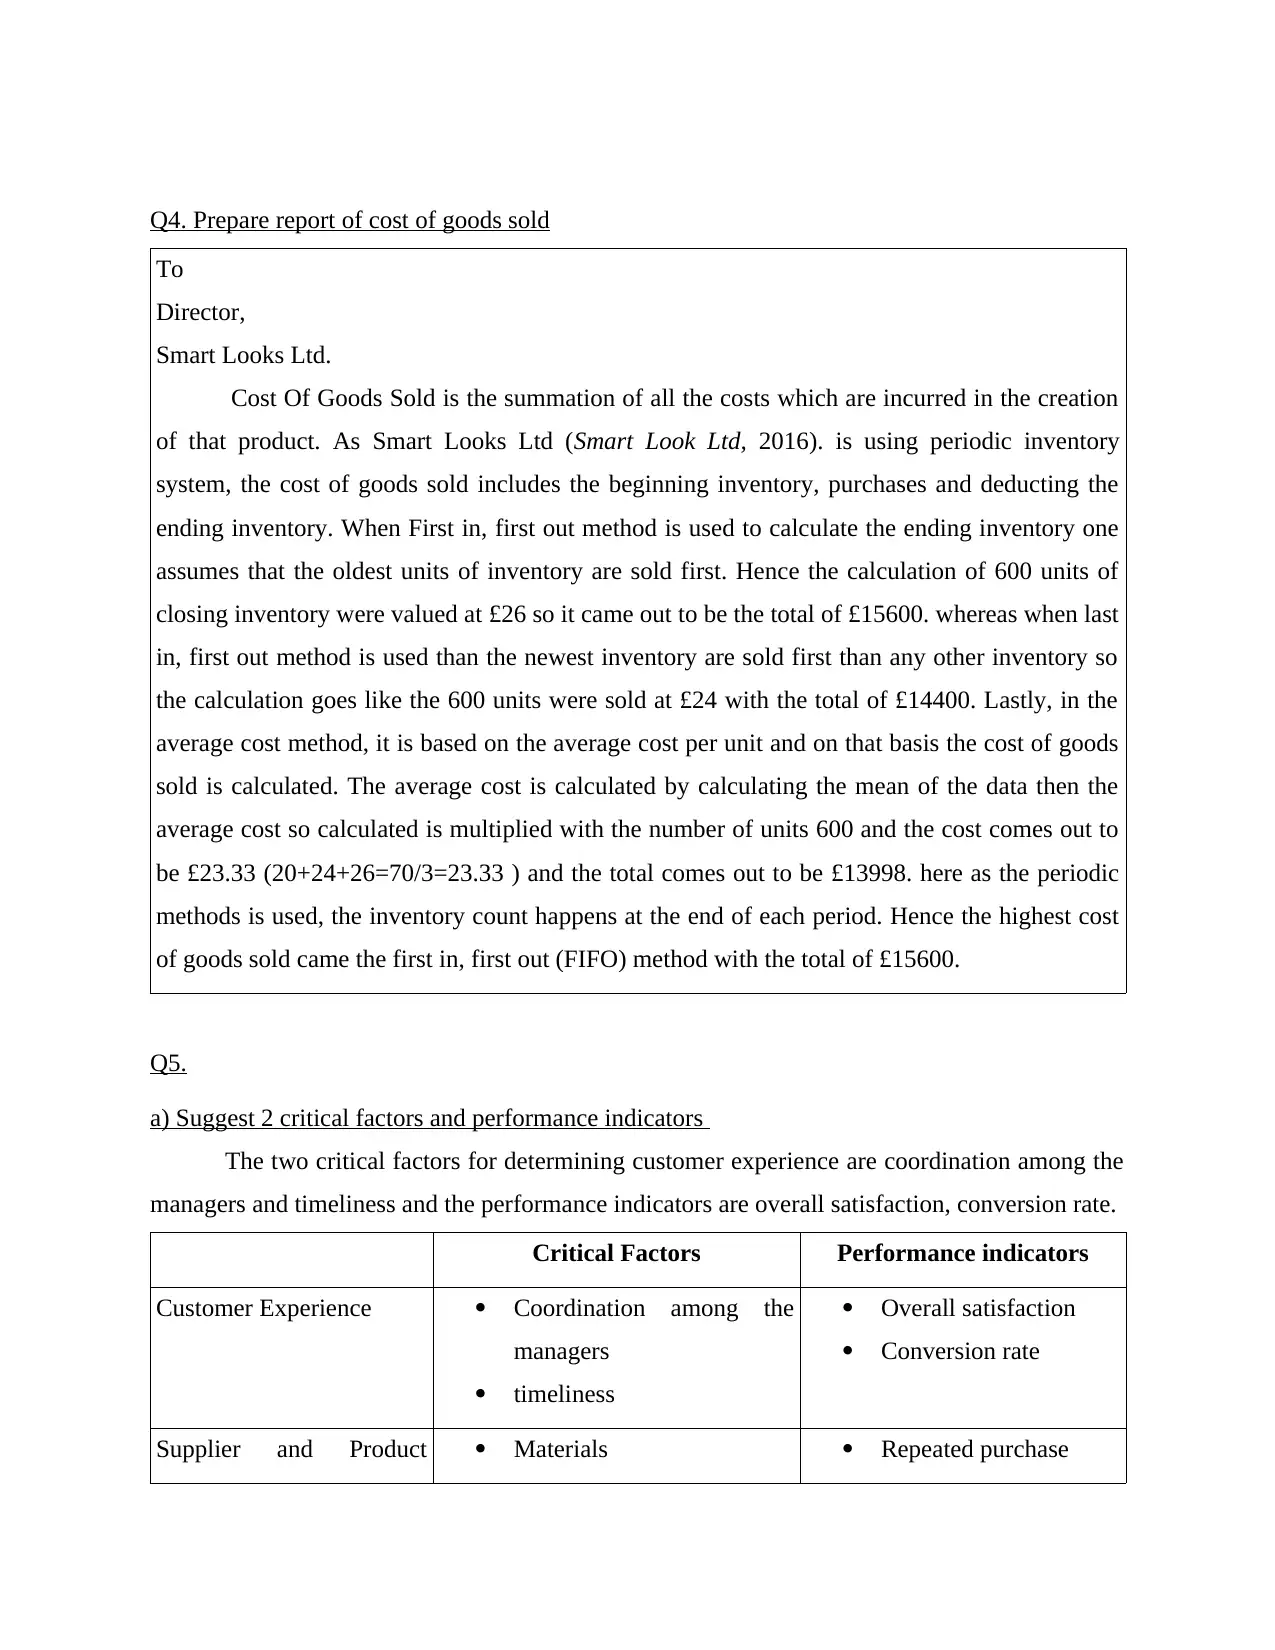
Q4. Prepare report of cost of goods sold
To
Director,
Smart Looks Ltd.
Cost Of Goods Sold is the summation of all the costs which are incurred in the creation
of that product. As Smart Looks Ltd (Smart Look Ltd, 2016). is using periodic inventory
system, the cost of goods sold includes the beginning inventory, purchases and deducting the
ending inventory. When First in, first out method is used to calculate the ending inventory one
assumes that the oldest units of inventory are sold first. Hence the calculation of 600 units of
closing inventory were valued at £26 so it came out to be the total of £15600. whereas when last
in, first out method is used than the newest inventory are sold first than any other inventory so
the calculation goes like the 600 units were sold at £24 with the total of £14400. Lastly, in the
average cost method, it is based on the average cost per unit and on that basis the cost of goods
sold is calculated. The average cost is calculated by calculating the mean of the data then the
average cost so calculated is multiplied with the number of units 600 and the cost comes out to
be £23.33 (20+24+26=70/3=23.33 ) and the total comes out to be £13998. here as the periodic
methods is used, the inventory count happens at the end of each period. Hence the highest cost
of goods sold came the first in, first out (FIFO) method with the total of £15600.
Q5.
a) Suggest 2 critical factors and performance indicators
The two critical factors for determining customer experience are coordination among the
managers and timeliness and the performance indicators are overall satisfaction, conversion rate.
Critical Factors Performance indicators
Customer Experience Coordination among the
managers
timeliness
Overall satisfaction
Conversion rate
Supplier and Product Materials Repeated purchase
Paraphrase This Document
Need a fresh take? Get an instant paraphrase of this document with our AI Paraphraser
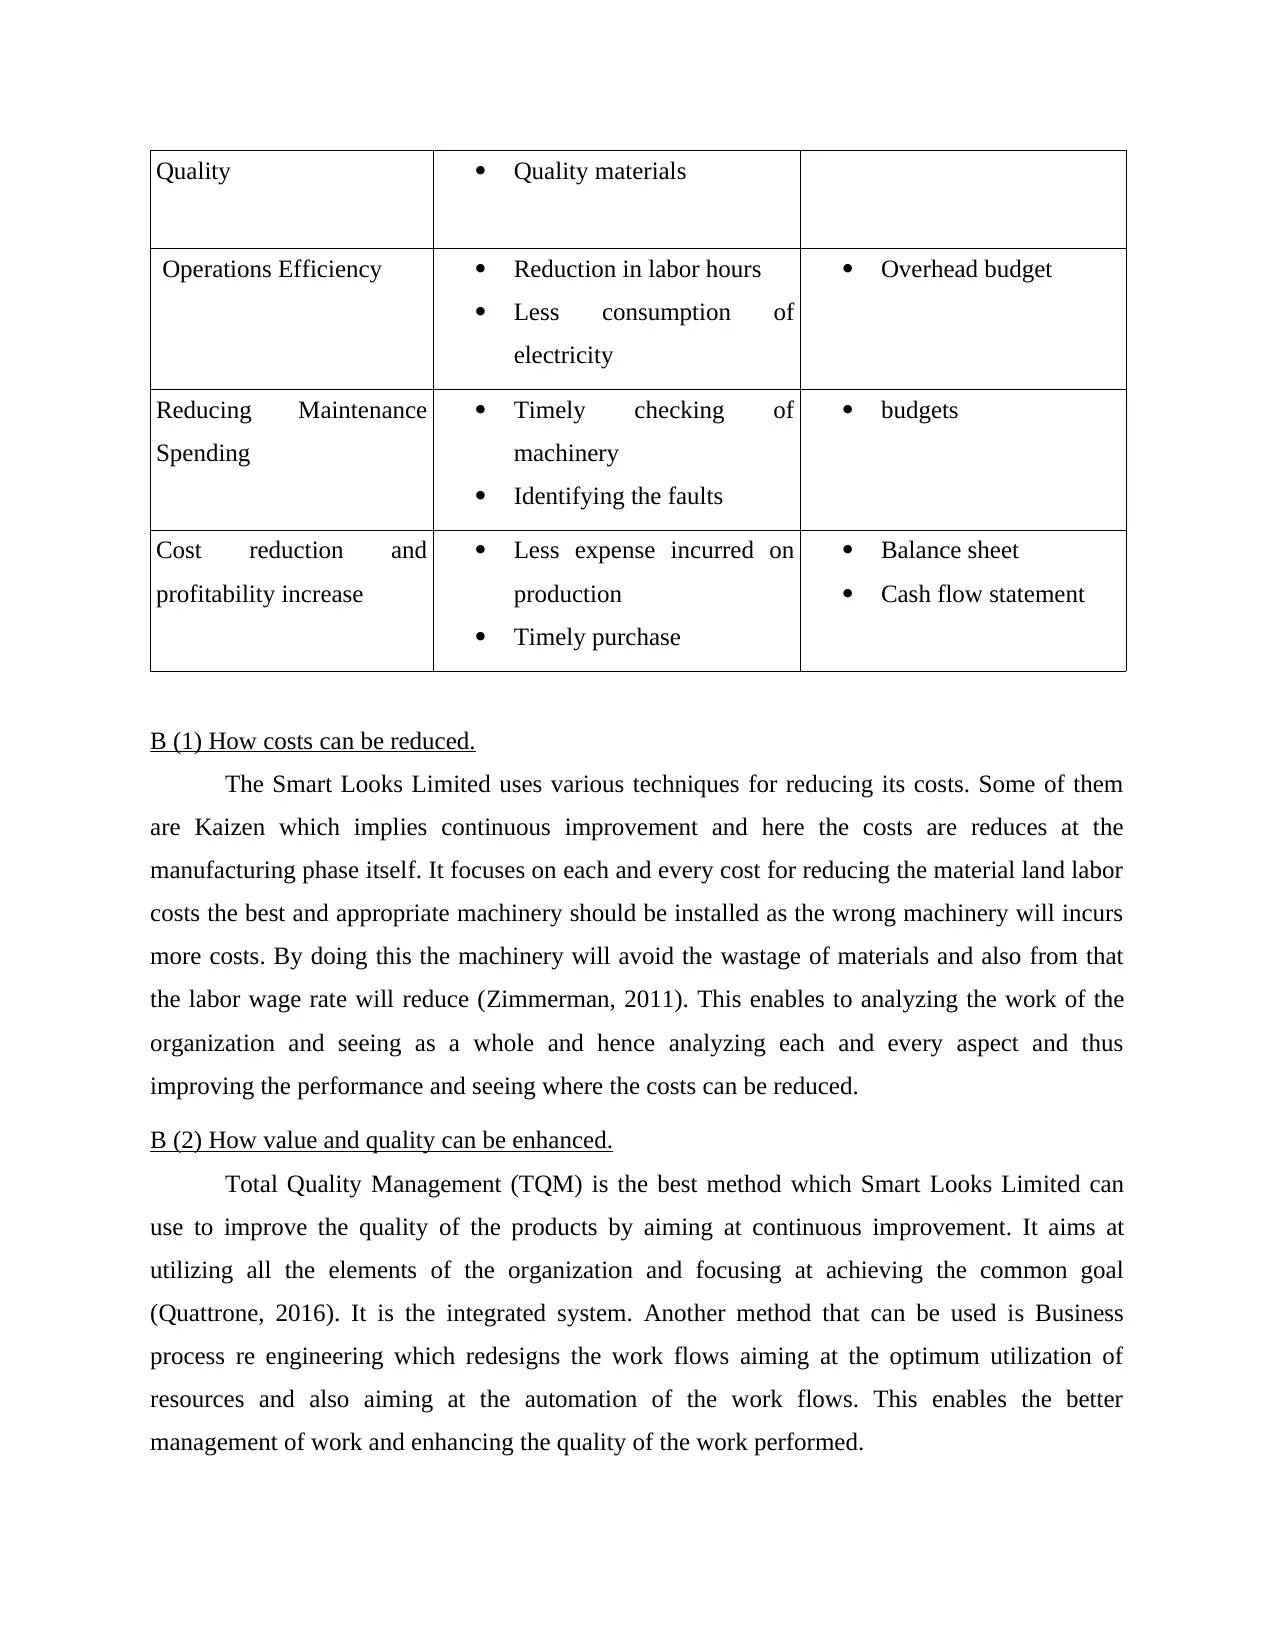
Quality Quality materials
Operations Efficiency Reduction in labor hours
Less consumption of
electricity
Overhead budget
Reducing Maintenance
Spending
Timely checking of
machinery
Identifying the faults
budgets
Cost reduction and
profitability increase
Less expense incurred on
production
Timely purchase
Balance sheet
Cash flow statement
B (1) How costs can be reduced.
The Smart Looks Limited uses various techniques for reducing its costs. Some of them
are Kaizen which implies continuous improvement and here the costs are reduces at the
manufacturing phase itself. It focuses on each and every cost for reducing the material land labor
costs the best and appropriate machinery should be installed as the wrong machinery will incurs
more costs. By doing this the machinery will avoid the wastage of materials and also from that
the labor wage rate will reduce (Zimmerman, 2011). This enables to analyzing the work of the
organization and seeing as a whole and hence analyzing each and every aspect and thus
improving the performance and seeing where the costs can be reduced.
B (2) How value and quality can be enhanced.
Total Quality Management (TQM) is the best method which Smart Looks Limited can
use to improve the quality of the products by aiming at continuous improvement. It aims at
utilizing all the elements of the organization and focusing at achieving the common goal
(Quattrone, 2016). It is the integrated system. Another method that can be used is Business
process re engineering which redesigns the work flows aiming at the optimum utilization of
resources and also aiming at the automation of the work flows. This enables the better
management of work and enhancing the quality of the work performed.
TASK 2
Q6. Usefulness of preparing budget
Budget is a quantitative expression of the revenues and expenses for a particular period of
time defining the future state of the organization. The budgets are important for the company as
it is a tool for monitoring the company's performance as in the beginning itself the budgets are
set and the company's performance are evaluated on the basis of the fact that the company is
meeting with the standards or not. The budgets are also used for the short-term target setting as
the standards are set and the employees are asked to meet the targets within the stipulated time
and on that basis the performance levels are measured and the employees are motivated to
achieve the levels. There are various kinds of budgets like the Zero Base Budgeting, in this the
budgets are developed from the scratch (Vaivio and Sirén, 2010). No previous years/months data
has been considered. Here the main aim is the optimum utilization of resources as the
departments are reviewed as a whole. In the Fixed budget, the entire budget is drawn in advance
and it remains fixed irrespective of the activity levels therefore it is considered to be rigid. In
case of Flexible budget, the budget changes with the change in the activity levels and thus is
dynamic. For Smart Looks Limited the budget which is best suitable is the Fixed or Variable
budget.
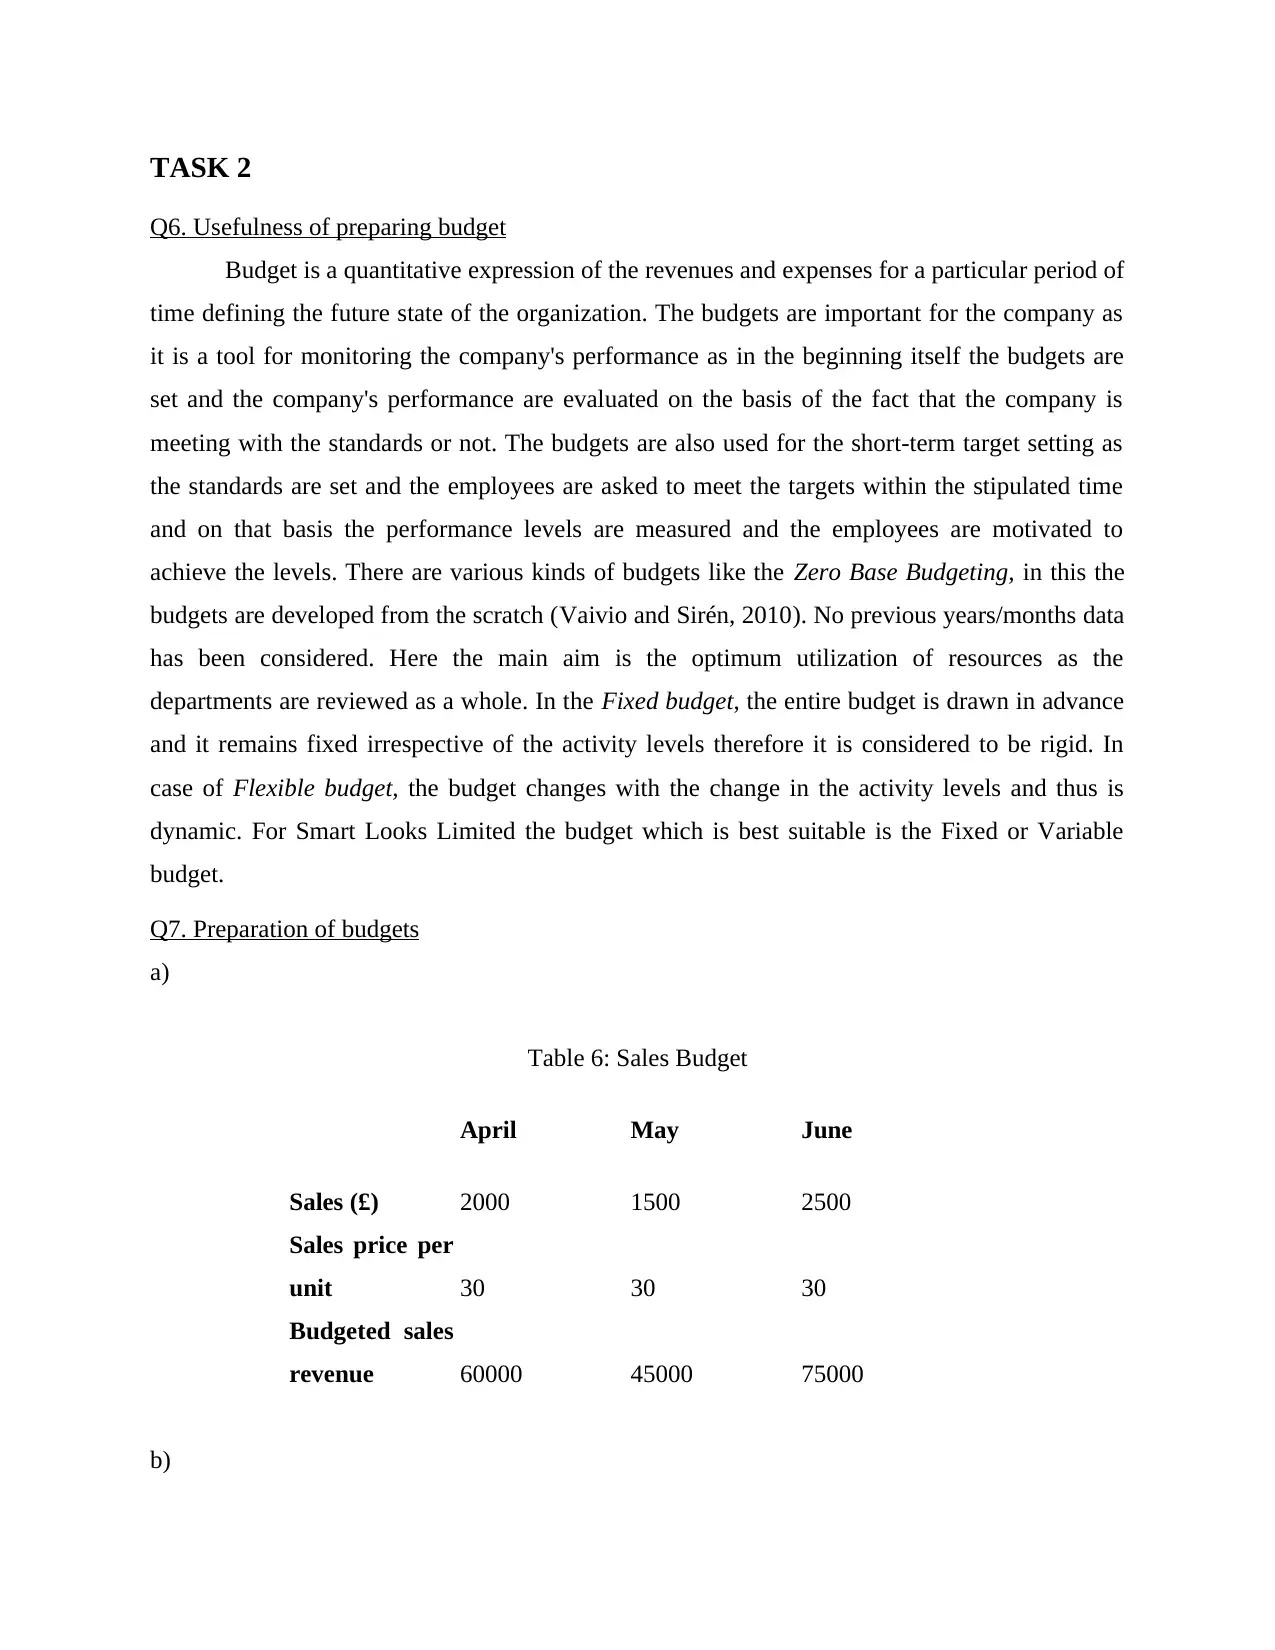
Q7. Preparation of budgets
a)
Table 6: Sales Budget
April May June
Sales (£) 2000 1500 2500
Sales price per
unit 30 30 30
Budgeted sales
revenue 60000 45000 75000
b)
Q6. Usefulness of preparing budget
Budget is a quantitative expression of the revenues and expenses for a particular period of
time defining the future state of the organization. The budgets are important for the company as
it is a tool for monitoring the company's performance as in the beginning itself the budgets are
set and the company's performance are evaluated on the basis of the fact that the company is
meeting with the standards or not. The budgets are also used for the short-term target setting as
the standards are set and the employees are asked to meet the targets within the stipulated time
and on that basis the performance levels are measured and the employees are motivated to
achieve the levels. There are various kinds of budgets like the Zero Base Budgeting, in this the
budgets are developed from the scratch (Vaivio and Sirén, 2010). No previous years/months data
has been considered. Here the main aim is the optimum utilization of resources as the
departments are reviewed as a whole. In the Fixed budget, the entire budget is drawn in advance
and it remains fixed irrespective of the activity levels therefore it is considered to be rigid. In
case of Flexible budget, the budget changes with the change in the activity levels and thus is
dynamic. For Smart Looks Limited the budget which is best suitable is the Fixed or Variable
budget.
Q7. Preparation of budgets
a)
Table 6: Sales Budget
April May June
Sales (£) 2000 1500 2500
Sales price per
unit 30 30 30
Budgeted sales
revenue 60000 45000 75000
b)
⊘ This is a preview!⊘
Do you want full access?
Subscribe today to unlock all pages.
Trusted by 1+ million students worldwide
1 out of 18
Related Documents


Your All-in-One AI-Powered Toolkit for Academic Success.
+13062052269
info@desklib.com
Available 24*7 on WhatsApp / Email
![[object Object]](/_next/static/media/star-bottom.7253800d.svg)
Unlock your academic potential
Copyright © 2020–2026 A2Z Services. All Rights Reserved. Developed and managed by ZUCOL.