MAA262: Management Accounting Assignment - Profitability Analysis
VerifiedAdded on 2023/03/17
|12
|2037
|62
Homework Assignment
AI Summary
This assignment solution addresses key concepts in management accounting. It begins with a revenue budget analysis for Purity Ltd., including sales and production calculations. The solution then examines cash flow from debtors, followed by an in-depth analysis of Return on Investment (ROI) and Residual Income, including a comparison of the shirt and trouser divisions, along with the benefits and drawbacks of ROI. The assignment further advises on product production arrangements for maximizing profitability, considering different sales strategies. Finally, it calculates and interprets direct materials and labor variances, exploring the relationships between them and their impact on overall production efficiency and cost control. The solution incorporates financial statements and calculations to support its conclusions, offering a comprehensive understanding of the topics covered.

Management accounting
Paraphrase This Document
Need a fresh take? Get an instant paraphrase of this document with our AI Paraphraser
Table of Contents
Question 1........................................................................................................................................3
a) Purity Ltd’ Revenues budget for the 31 December 2019 year end.........................................3
b) Production of minimum number of 1-litre bottles by Purity Ltd at the time of 2019.............3
c) Opening inventory amount of 15-litre containers as on 1 January 2019.................................3
Question 2........................................................................................................................................4
Computation of assumed cash obtained from debtors during May 2015....................................4
Question 3........................................................................................................................................4
a) Successful division based on ROI...........................................................................................4
b) Residual income computation in consideration with assumptions..........................................5
c) Overcoming the problem of bad decision caused by ROI.......................................................6
Question 4........................................................................................................................................7
Advice to the company on the arrangement of each product’s production for the maximization
of profitability..............................................................................................................................7
Question 5........................................................................................................................................7
a) Direct materials price and quantity variances..........................................................................7
b) Direct labour rate and efficiency variances.............................................................................8
c) Considering the link in calculated variance in part (a) and (b)...............................................9
References......................................................................................................................................11
QUESTION 1
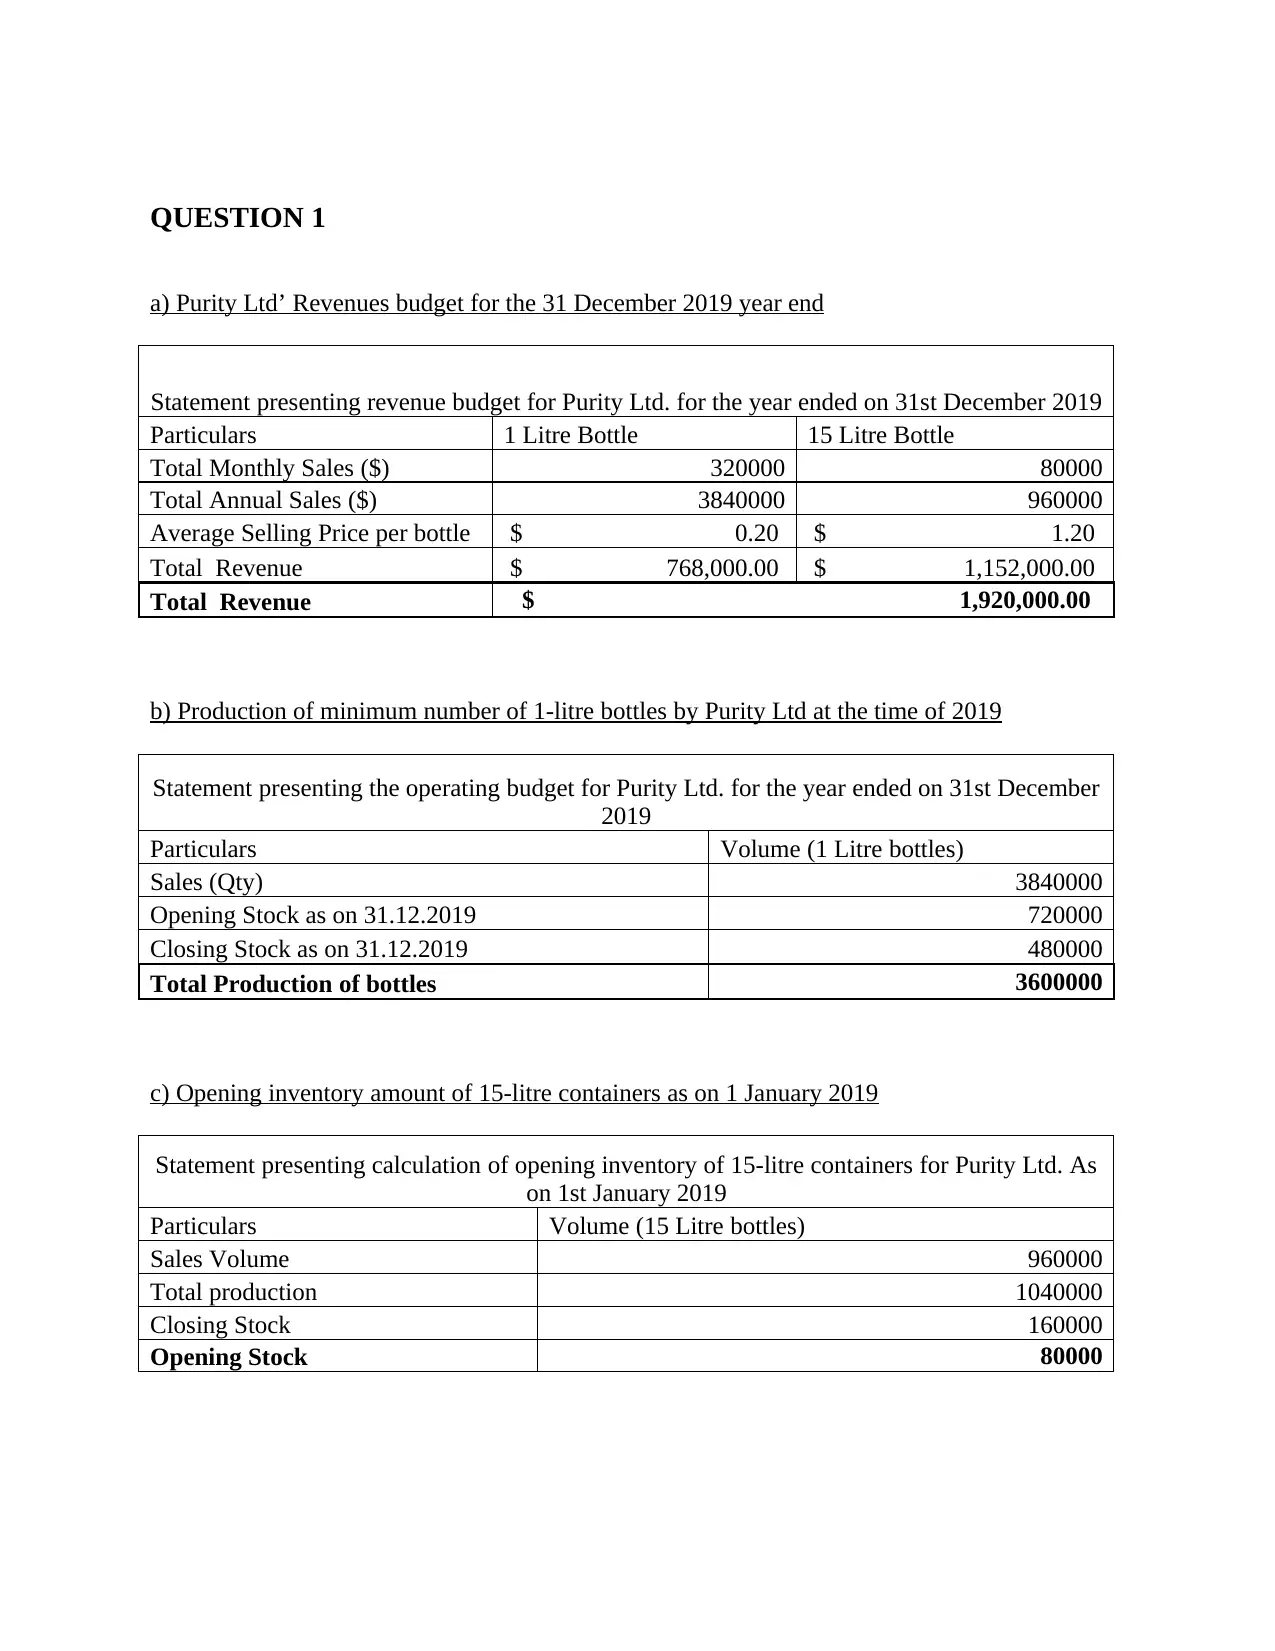
a) Purity Ltd’ Revenues budget for the 31 December 2019 year end
Statement presenting revenue budget for Purity Ltd. for the year ended on 31st December 2019
Particulars 1 Litre Bottle 15 Litre Bottle
Total Monthly Sales ($) 320000 80000
Total Annual Sales ($) 3840000 960000
Average Selling Price per bottle $ 0.20 $ 1.20
Total Revenue $ 768,000.00 $ 1,152,000.00
Total Revenue $ 1,920,000.00
b) Production of minimum number of 1-litre bottles by Purity Ltd at the time of 2019
Statement presenting the operating budget for Purity Ltd. for the year ended on 31st December
2019
Particulars Volume (1 Litre bottles)
Sales (Qty) 3840000
Opening Stock as on 31.12.2019 720000
Closing Stock as on 31.12.2019 480000
Total Production of bottles 3600000
c) Opening inventory amount of 15-litre containers as on 1 January 2019
Statement presenting calculation of opening inventory of 15-litre containers for Purity Ltd. As
on 1st January 2019
Particulars Volume (15 Litre bottles)
Sales Volume 960000
Total production 1040000
Closing Stock 160000
Opening Stock 80000
⊘ This is a preview!⊘
Do you want full access?
Subscribe today to unlock all pages.
Trusted by 1+ million students worldwide
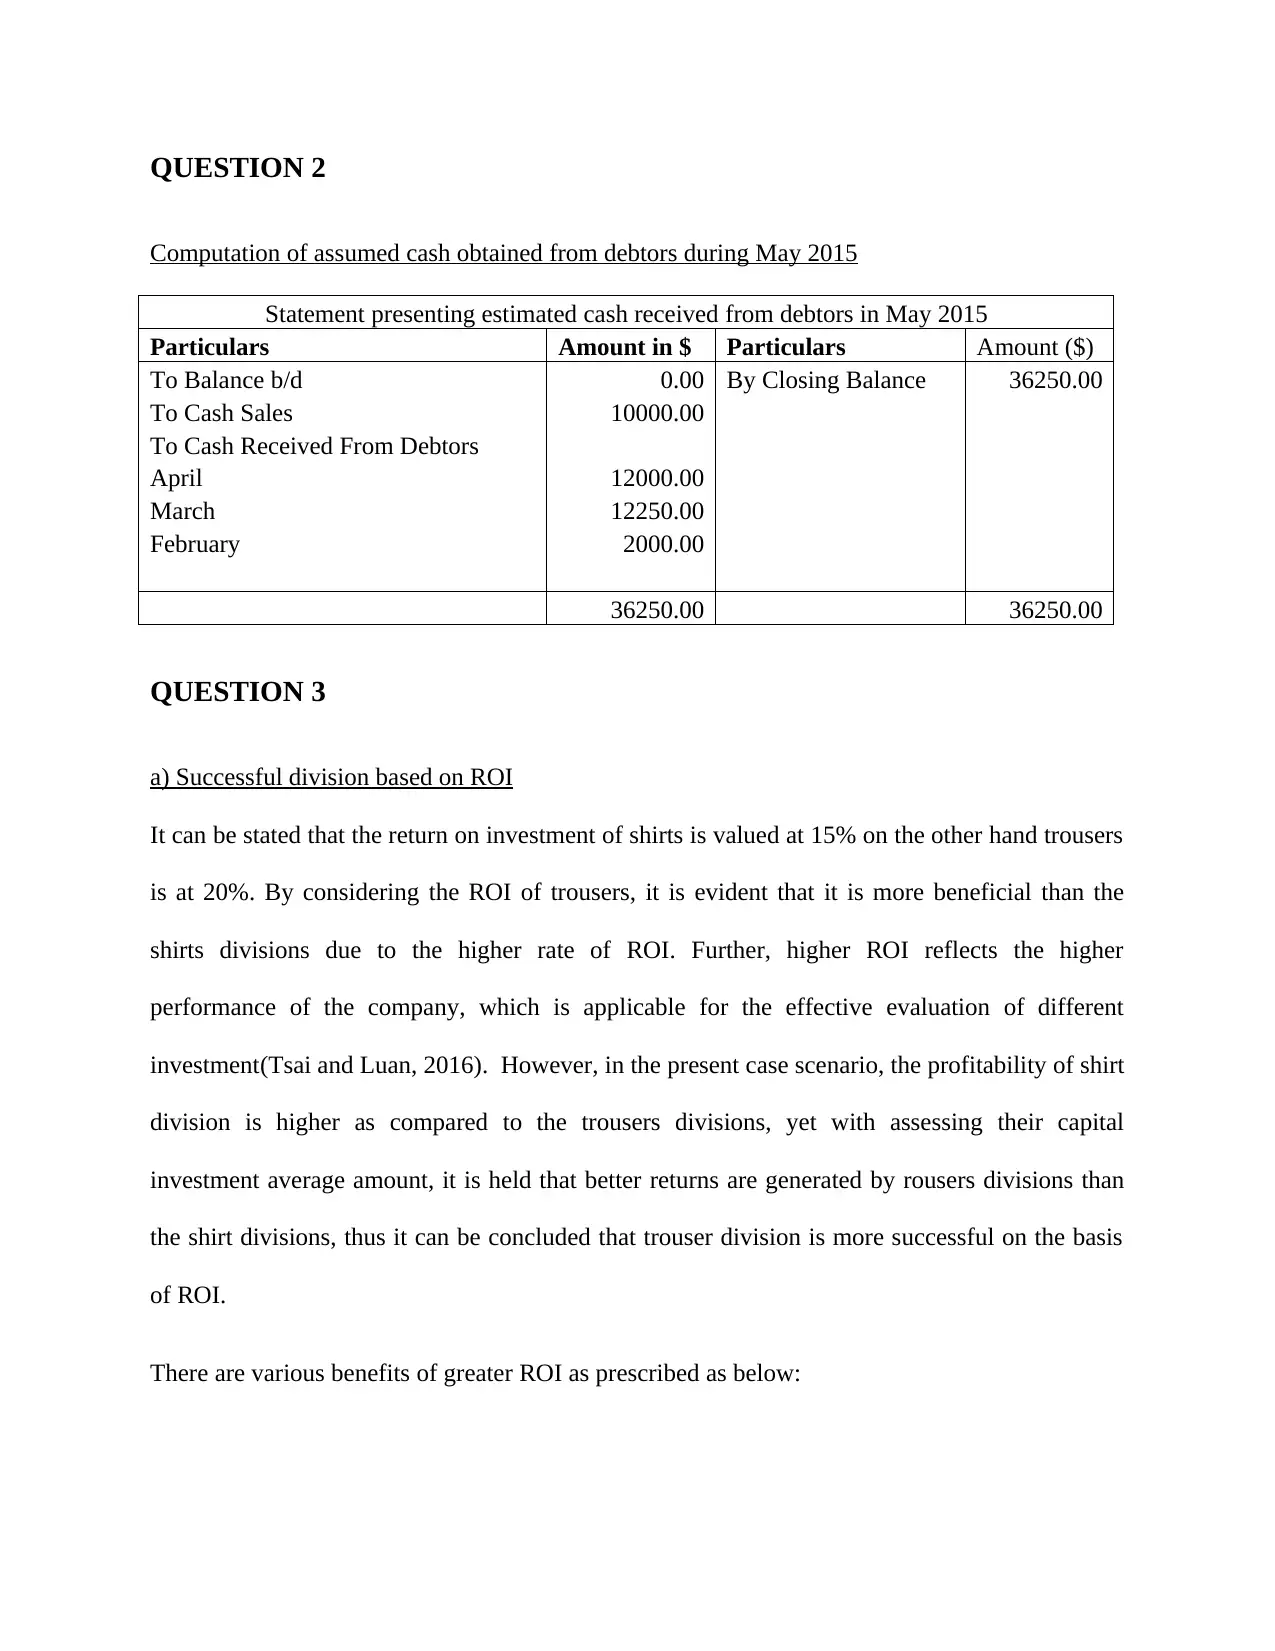
QUESTION 2
Computation of assumed cash obtained from debtors during May 2015
Statement presenting estimated cash received from debtors in May 2015
Particulars Amount in $ Particulars Amount ($)
To Balance b/d 0.00 By Closing Balance 36250.00
To Cash Sales 10000.00
To Cash Received From Debtors
April 12000.00
March 12250.00
February 2000.00
36250.00 36250.00
QUESTION 3
a) Successful division based on ROI
It can be stated that the return on investment of shirts is valued at 15% on the other hand trousers
is at 20%. By considering the ROI of trousers, it is evident that it is more beneficial than the
shirts divisions due to the higher rate of ROI. Further, higher ROI reflects the higher
performance of the company, which is applicable for the effective evaluation of different
investment(Tsai and Luan, 2016). However, in the present case scenario, the profitability of shirt
division is higher as compared to the trousers divisions, yet with assessing their capital
investment average amount, it is held that better returns are generated by rousers divisions than
the shirt divisions, thus it can be concluded that trouser division is more successful on the basis
of ROI.
There are various benefits of greater ROI as prescribed as below:
Paraphrase This Document
Need a fresh take? Get an instant paraphrase of this document with our AI Paraphraser
ROI ensures goal analogy between the distinct divisions and the firm; any of the increment in the
divisional ROI will come up improvement in the entire firm and ROI. In addition, helps financial
users to check the investment prospect thus facilitating time and cost-effectiveness. It also helps
in measuring and monitoring possible returns on distinct investment opportunities, while helping
in interpreting the investment benefits in specified divisions. It also concentrates the attention of
management on gaining the best profit as much as possible on the capital, plus it acts as a
yardstick in the monitoring of management overall efficiency in the major divisions. It integrates
various stages of financial planning, cost control, profit goals and sales objectives, plus facilitate
in exploring weakness in regards to the inventories(Lara, Osma, and Penalva, 2016).
asy comparability with
internal and external
benchmarks and other
divisions who use ROI.
Controls for size and
divergences across
plants and divisions.
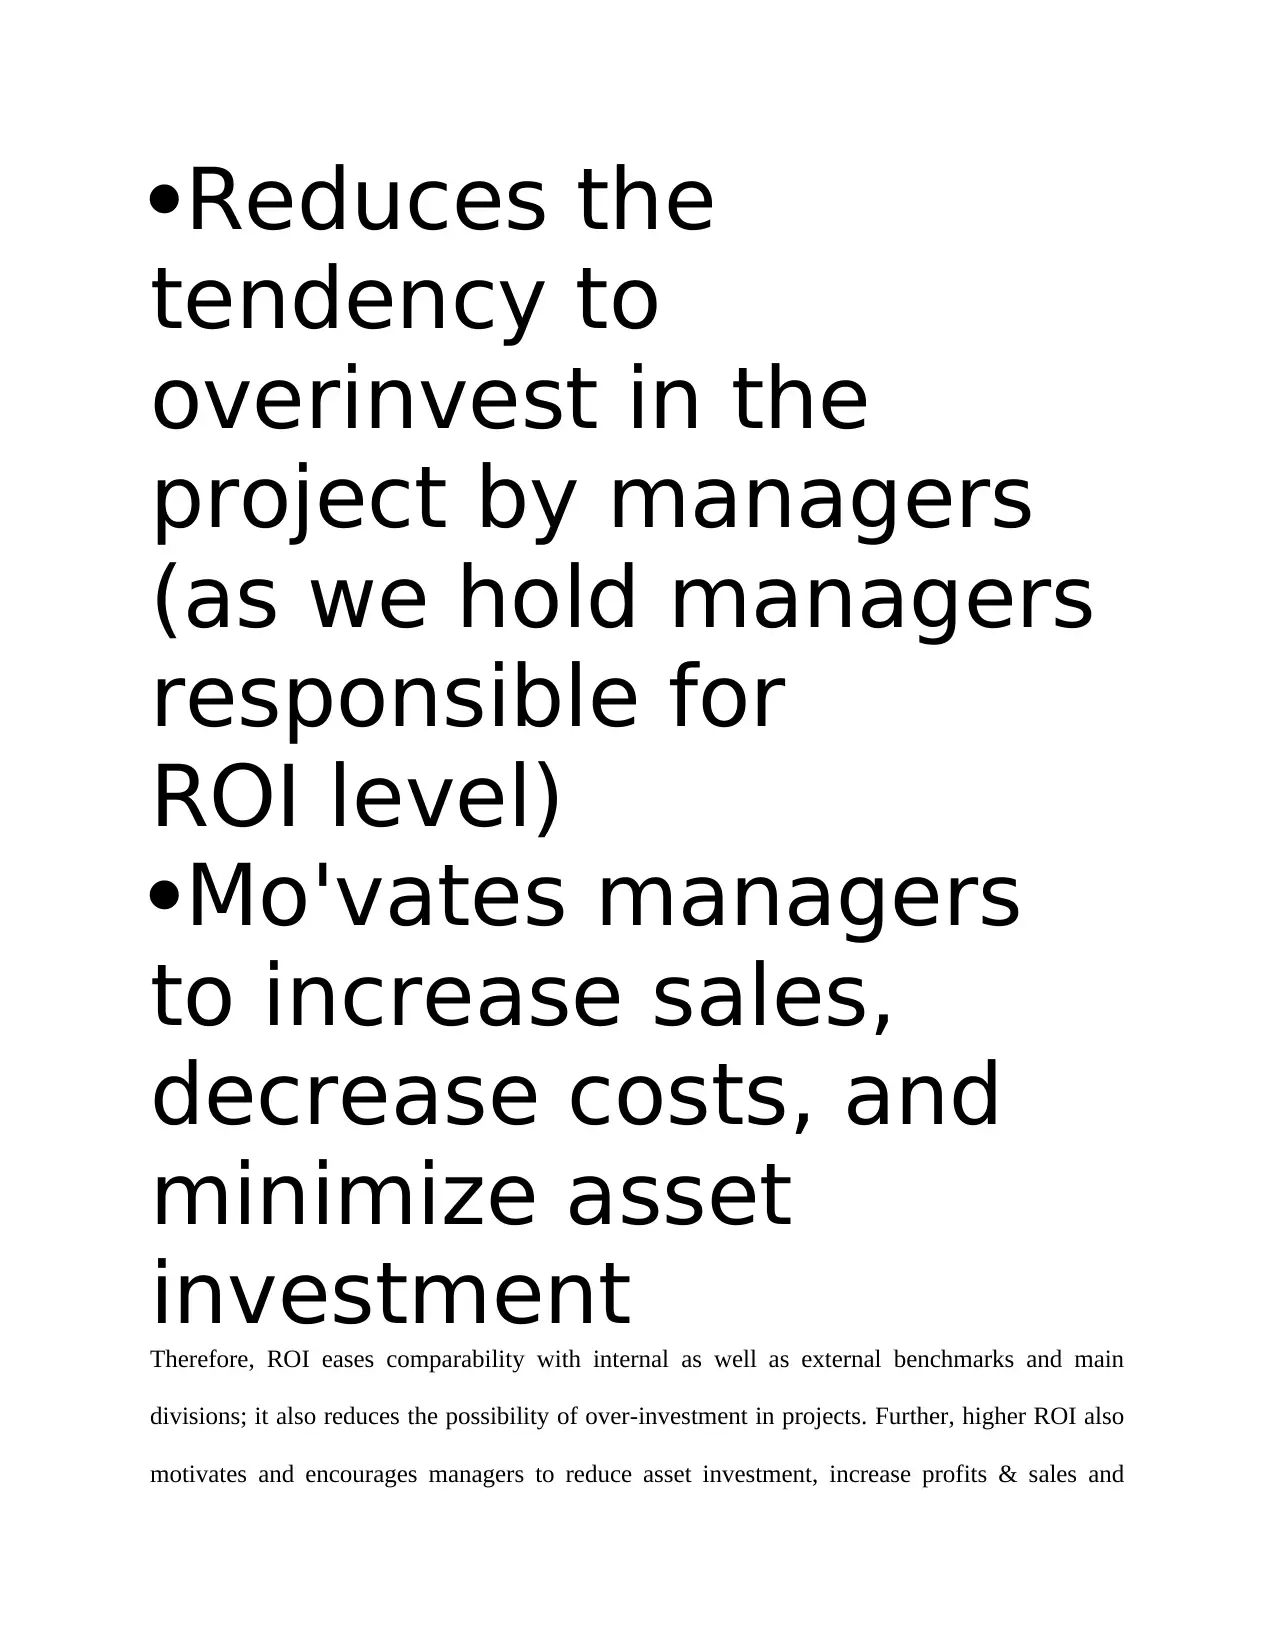
Reduces the
tendency to
overinvest in the
project by managers
(as we hold managers
responsible for
ROI level)
Mo'vates managers
to increase sales,
decrease costs, and
minimize asset
investment
Therefore, ROI eases comparability with internal as well as external benchmarks and main
divisions; it also reduces the possibility of over-investment in projects. Further, higher ROI also
motivates and encourages managers to reduce asset investment, increase profits & sales and
⊘ This is a preview!⊘
Do you want full access?
Subscribe today to unlock all pages.
Trusted by 1+ million students worldwide
reduce costs(Swami and Jain, 2019). However, ROI is merely focused on short term goals,
profitability so it can lead to sub-optimal decisions, and based on ROI company cannot make
good decisions.
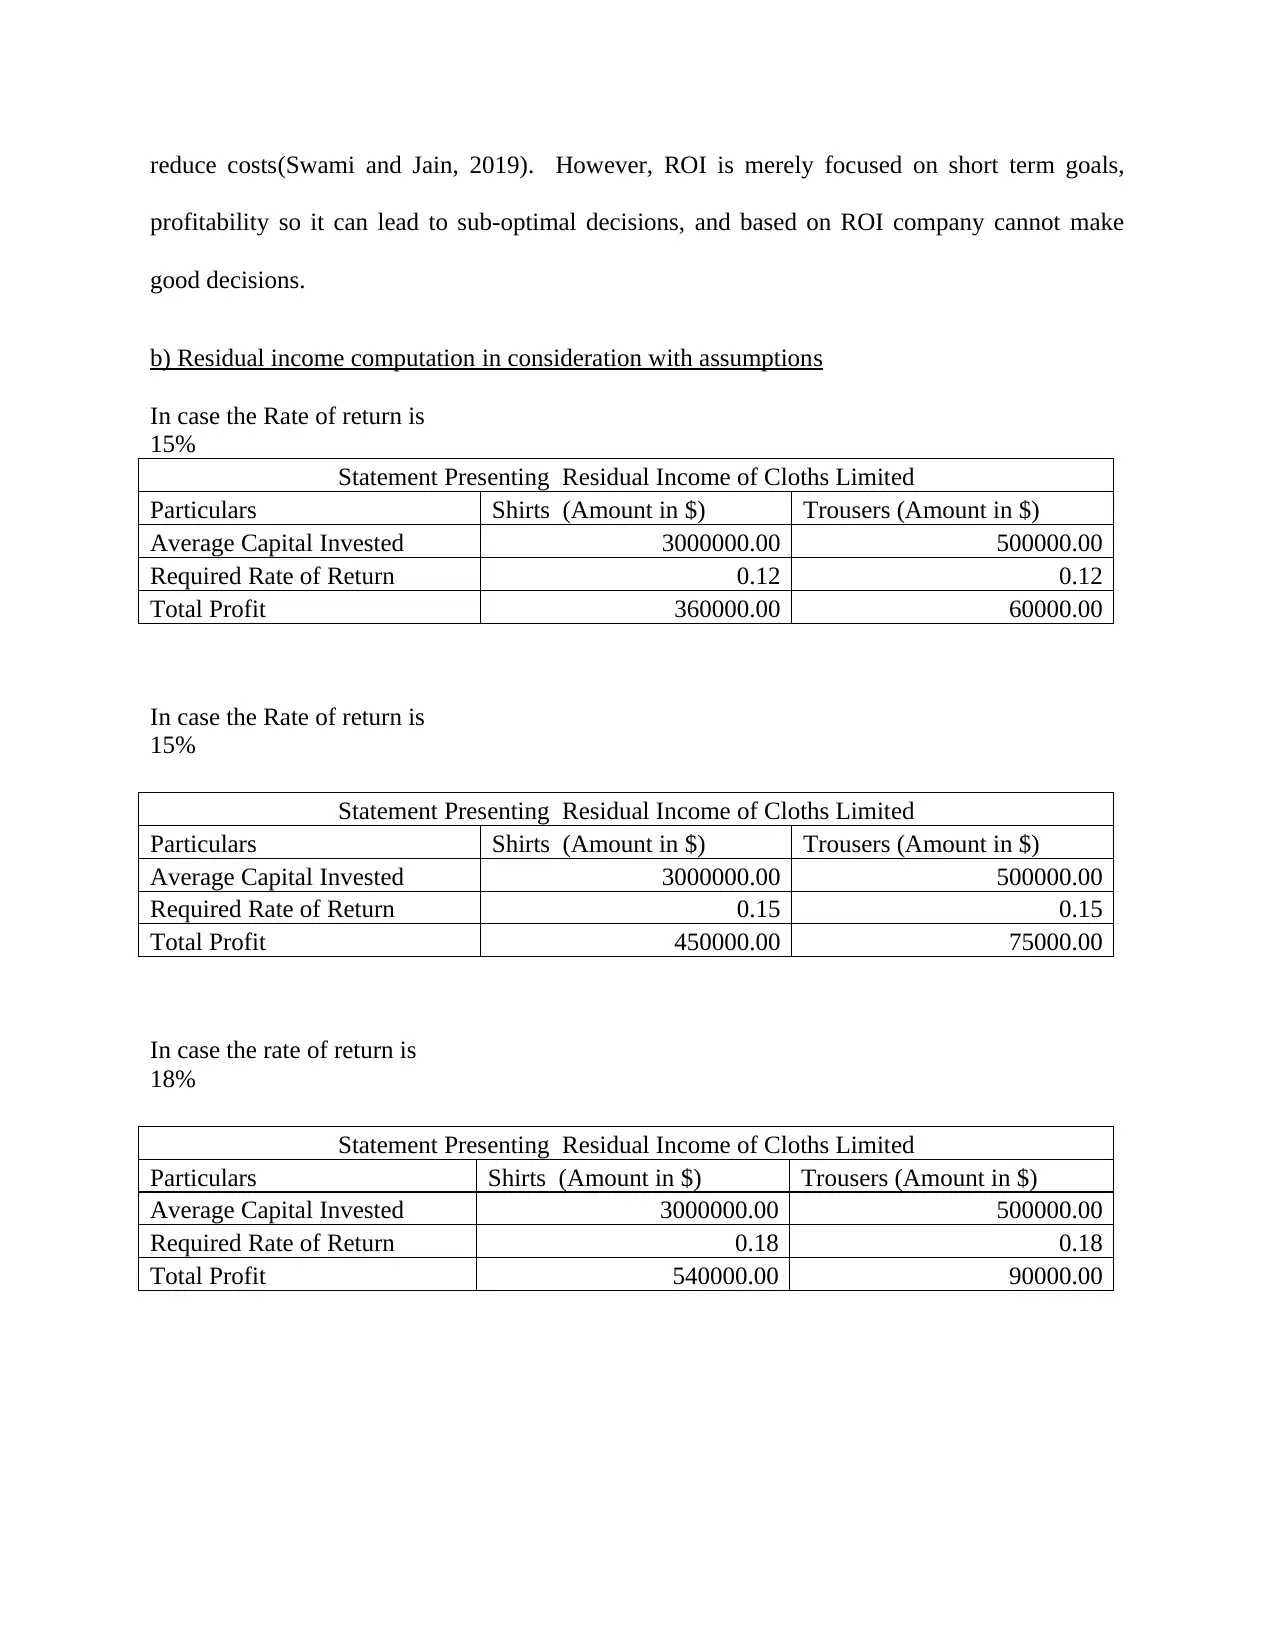
b) Residual income computation in consideration with assumptions
In case the Rate of return is
15%
Statement Presenting Residual Income of Cloths Limited
Particulars Shirts (Amount in $) Trousers (Amount in $)
Average Capital Invested 3000000.00 500000.00
Required Rate of Return 0.12 0.12
Total Profit 360000.00 60000.00
In case the Rate of return is
15%
Statement Presenting Residual Income of Cloths Limited
Particulars Shirts (Amount in $) Trousers (Amount in $)
Average Capital Invested 3000000.00 500000.00
Required Rate of Return 0.15 0.15
Total Profit 450000.00 75000.00
In case the rate of return is
18%
Statement Presenting Residual Income of Cloths Limited
Particulars Shirts (Amount in $) Trousers (Amount in $)
Average Capital Invested 3000000.00 500000.00
Required Rate of Return 0.18 0.18
Total Profit 540000.00 90000.00
profitability so it can lead to sub-optimal decisions, and based on ROI company cannot make
good decisions.
b) Residual income computation in consideration with assumptions
In case the Rate of return is
15%
Statement Presenting Residual Income of Cloths Limited
Particulars Shirts (Amount in $) Trousers (Amount in $)
Average Capital Invested 3000000.00 500000.00
Required Rate of Return 0.12 0.12
Total Profit 360000.00 60000.00
In case the Rate of return is
15%
Statement Presenting Residual Income of Cloths Limited
Particulars Shirts (Amount in $) Trousers (Amount in $)
Average Capital Invested 3000000.00 500000.00
Required Rate of Return 0.15 0.15
Total Profit 450000.00 75000.00
In case the rate of return is
18%
Statement Presenting Residual Income of Cloths Limited
Particulars Shirts (Amount in $) Trousers (Amount in $)
Average Capital Invested 3000000.00 500000.00
Required Rate of Return 0.18 0.18
Total Profit 540000.00 90000.00
Paraphrase This Document
Need a fresh take? Get an instant paraphrase of this document with our AI Paraphraser
c) Overcoming the problem of bad decision caused by ROI
In a situation where ROI is employed to measure performance, then a manager of that investment
centre might not approve to a profitable investment opportunity having a higher rate of return
than the required rate of return of the company, but is lower than the current ROI of the
company. In other words, if ROI is utilized as a managerial performance measure, it can result
in optimal or ideal decisions for the individual decisions, however bad for the company(Latino,
Latino and Latino, 2016). ROI is more focused on short-run profitability, considering merely the
last quarter or year performance of the company.
Further, in such cases, residual income approach helps in overcoming this issues, as any of the
project or investment whose rate of return surpasses the minimum required rate of return of
company will end up with an increment in residual income thereof(Wild, 2017).
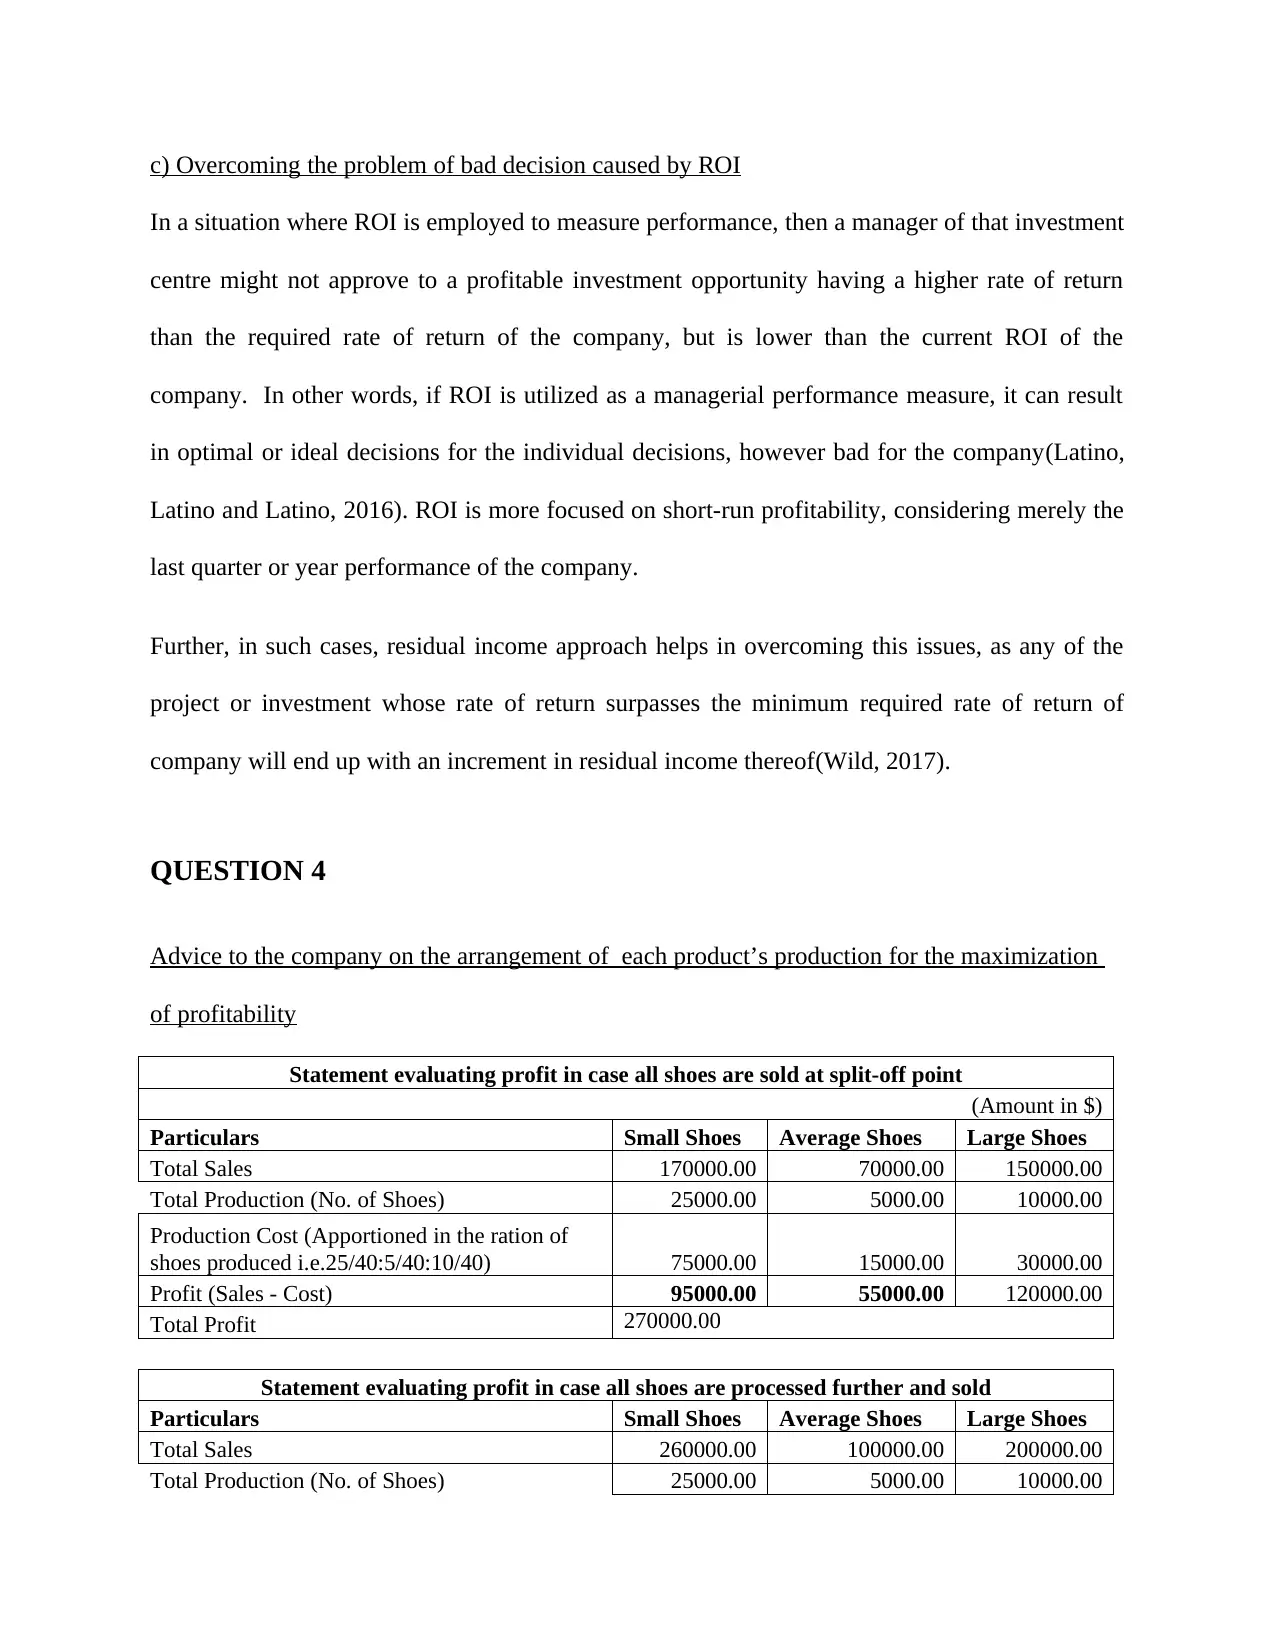
QUESTION 4
Advice to the company on the arrangement of each product’s production for the maximization
of profitability
Statement evaluating profit in case all shoes are sold at split-off point
(Amount in $)
Particulars Small Shoes Average Shoes Large Shoes
Total Sales 170000.00 70000.00 150000.00
Total Production (No. of Shoes) 25000.00 5000.00 10000.00
Production Cost (Apportioned in the ration of
shoes produced i.e.25/40:5/40:10/40) 75000.00 15000.00 30000.00
Profit (Sales - Cost) 95000.00 55000.00 120000.00
Total Profit 270000.00
Statement evaluating profit in case all shoes are processed further and sold
Particulars Small Shoes Average Shoes Large Shoes
Total Sales 260000.00 100000.00 200000.00
Total Production (No. of Shoes) 25000.00 5000.00 10000.00
In a situation where ROI is employed to measure performance, then a manager of that investment
centre might not approve to a profitable investment opportunity having a higher rate of return
than the required rate of return of the company, but is lower than the current ROI of the
company. In other words, if ROI is utilized as a managerial performance measure, it can result
in optimal or ideal decisions for the individual decisions, however bad for the company(Latino,
Latino and Latino, 2016). ROI is more focused on short-run profitability, considering merely the
last quarter or year performance of the company.
Further, in such cases, residual income approach helps in overcoming this issues, as any of the
project or investment whose rate of return surpasses the minimum required rate of return of
company will end up with an increment in residual income thereof(Wild, 2017).
QUESTION 4
Advice to the company on the arrangement of each product’s production for the maximization
of profitability
Statement evaluating profit in case all shoes are sold at split-off point
(Amount in $)
Particulars Small Shoes Average Shoes Large Shoes
Total Sales 170000.00 70000.00 150000.00
Total Production (No. of Shoes) 25000.00 5000.00 10000.00
Production Cost (Apportioned in the ration of
shoes produced i.e.25/40:5/40:10/40) 75000.00 15000.00 30000.00
Profit (Sales - Cost) 95000.00 55000.00 120000.00
Total Profit 270000.00
Statement evaluating profit in case all shoes are processed further and sold
Particulars Small Shoes Average Shoes Large Shoes
Total Sales 260000.00 100000.00 200000.00
Total Production (No. of Shoes) 25000.00 5000.00 10000.00
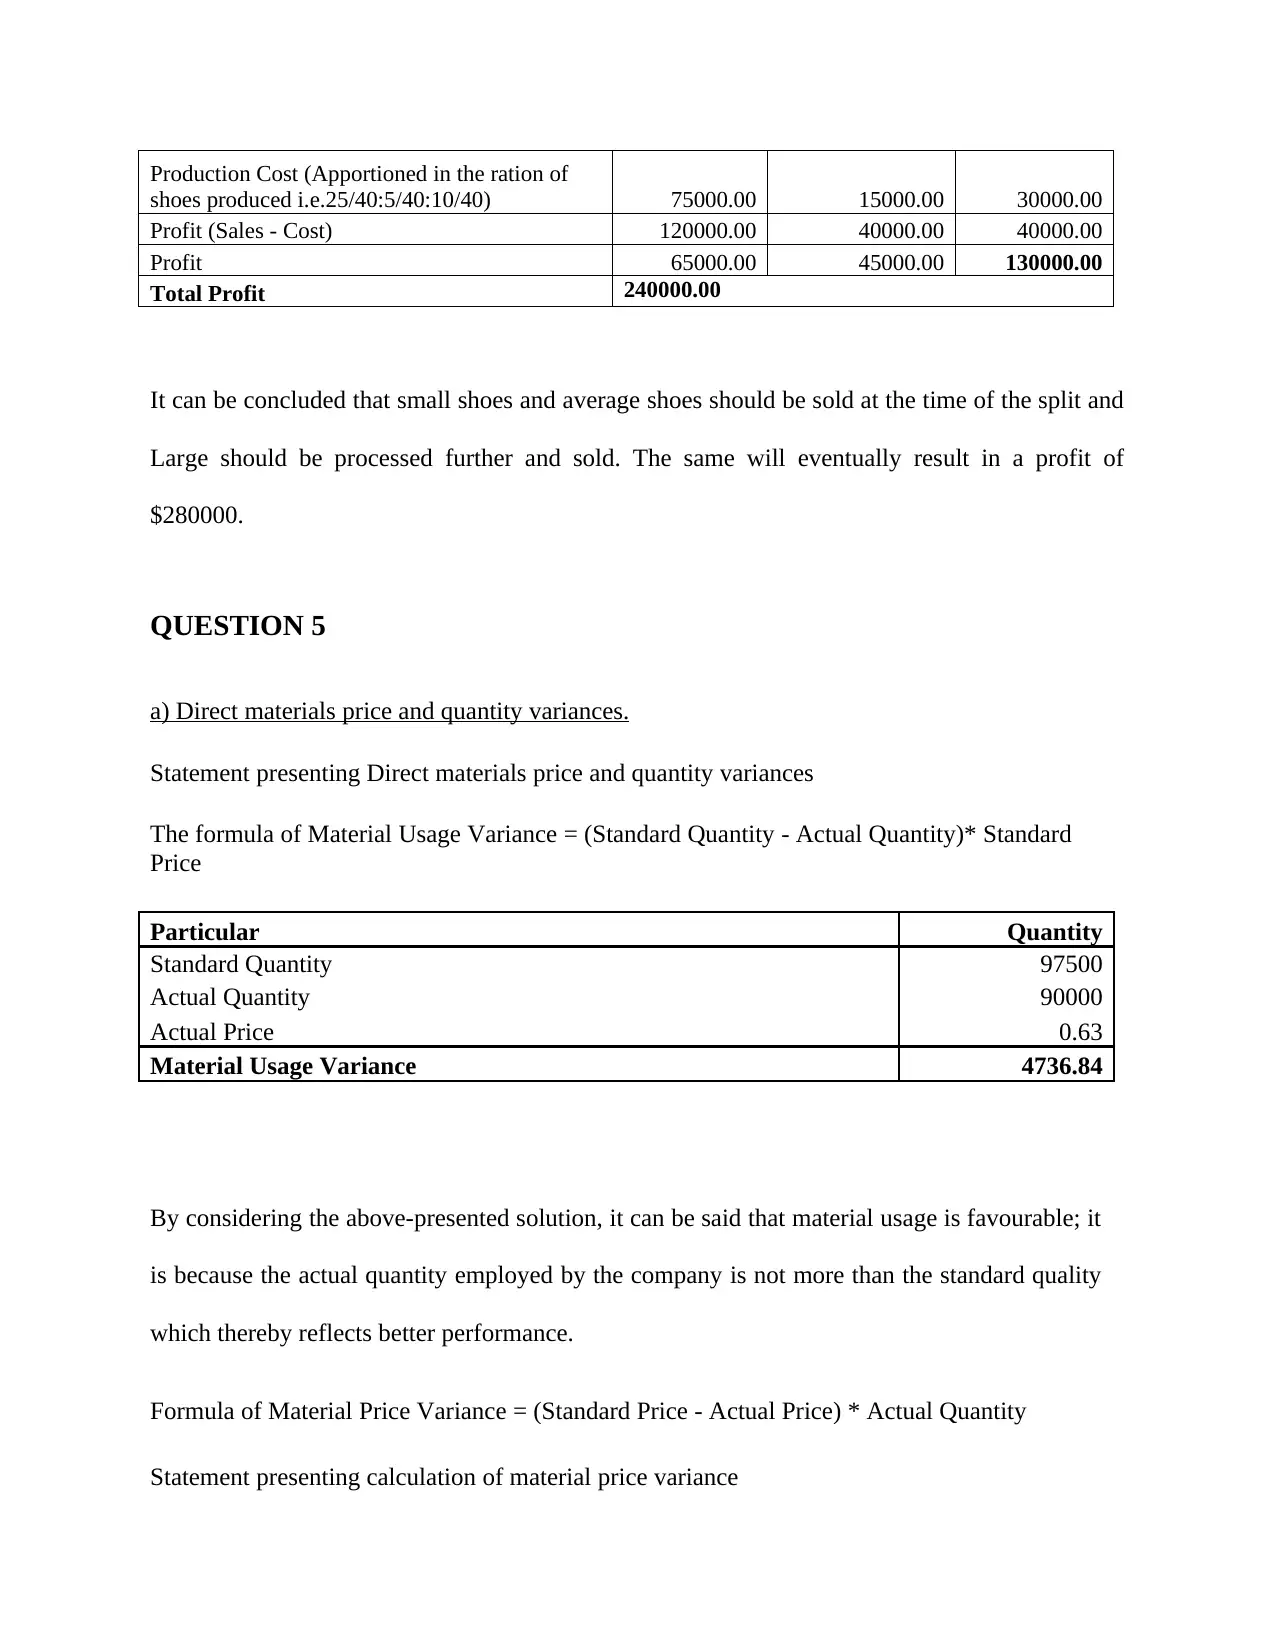
Production Cost (Apportioned in the ration of
shoes produced i.e.25/40:5/40:10/40) 75000.00 15000.00 30000.00
Profit (Sales - Cost) 120000.00 40000.00 40000.00
Profit 65000.00 45000.00 130000.00
Total Profit 240000.00
It can be concluded that small shoes and average shoes should be sold at the time of the split and
Large should be processed further and sold. The same will eventually result in a profit of
$280000.
QUESTION 5
a) Direct materials price and quantity variances.
Statement presenting Direct materials price and quantity variances
The formula of Material Usage Variance = (Standard Quantity - Actual Quantity)* Standard
Price
Particular Quantity
Standard Quantity 97500
Actual Quantity 90000
Actual Price 0.63
Material Usage Variance 4736.84
By considering the above-presented solution, it can be said that material usage is favourable; it
is because the actual quantity employed by the company is not more than the standard quality
which thereby reflects better performance.
Formula of Material Price Variance = (Standard Price - Actual Price) * Actual Quantity
Statement presenting calculation of material price variance
⊘ This is a preview!⊘
Do you want full access?
Subscribe today to unlock all pages.
Trusted by 1+ million students worldwide
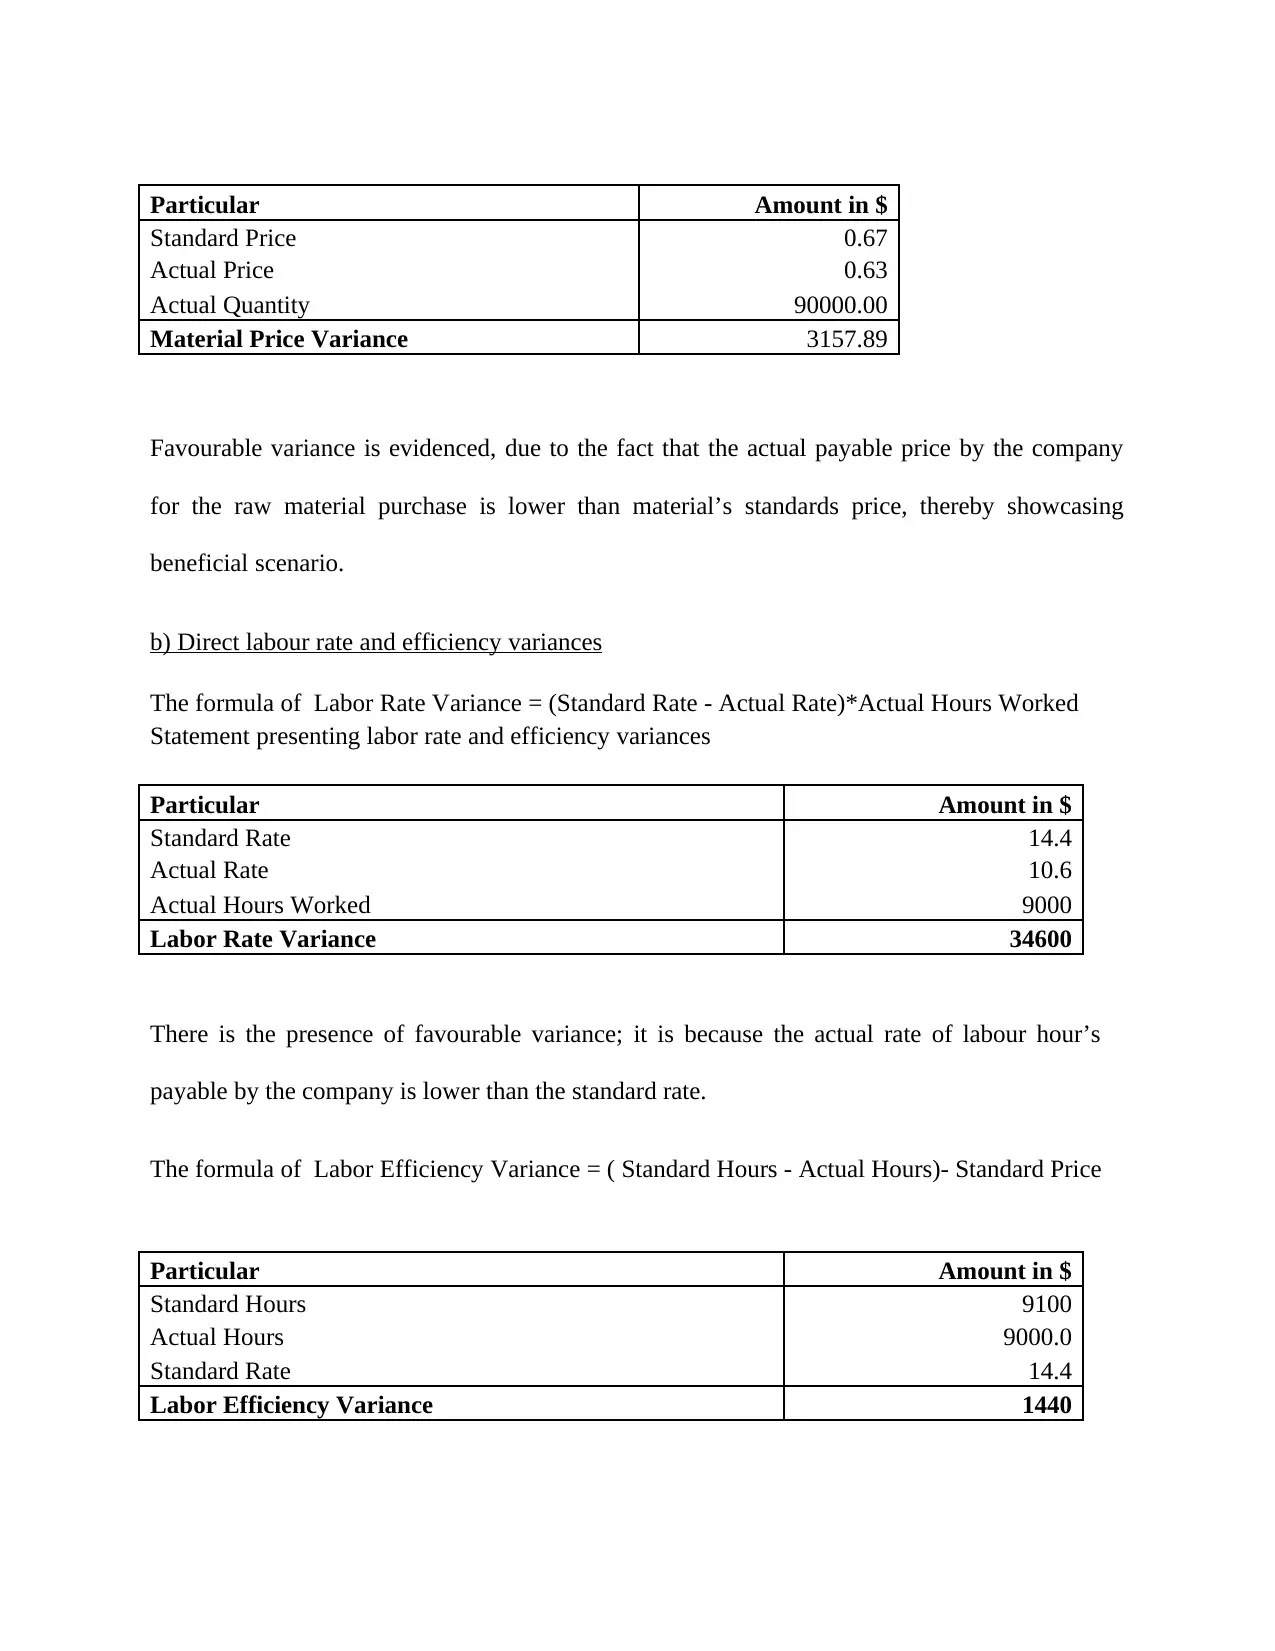
Particular Amount in $
Standard Price 0.67
Actual Price 0.63
Actual Quantity 90000.00
Material Price Variance 3157.89
Favourable variance is evidenced, due to the fact that the actual payable price by the company
for the raw material purchase is lower than material’s standards price, thereby showcasing
beneficial scenario.
b) Direct labour rate and efficiency variances
The formula of Labor Rate Variance = (Standard Rate - Actual Rate)*Actual Hours Worked
Statement presenting labor rate and efficiency variances
Particular Amount in $
Standard Rate 14.4
Actual Rate 10.6
Actual Hours Worked 9000
Labor Rate Variance 34600
There is the presence of favourable variance; it is because the actual rate of labour hour’s
payable by the company is lower than the standard rate.
The formula of Labor Efficiency Variance = ( Standard Hours - Actual Hours)- Standard Price
Particular Amount in $
Standard Hours 9100
Actual Hours 9000.0
Standard Rate 14.4
Labor Efficiency Variance 1440
Paraphrase This Document
Need a fresh take? Get an instant paraphrase of this document with our AI Paraphraser
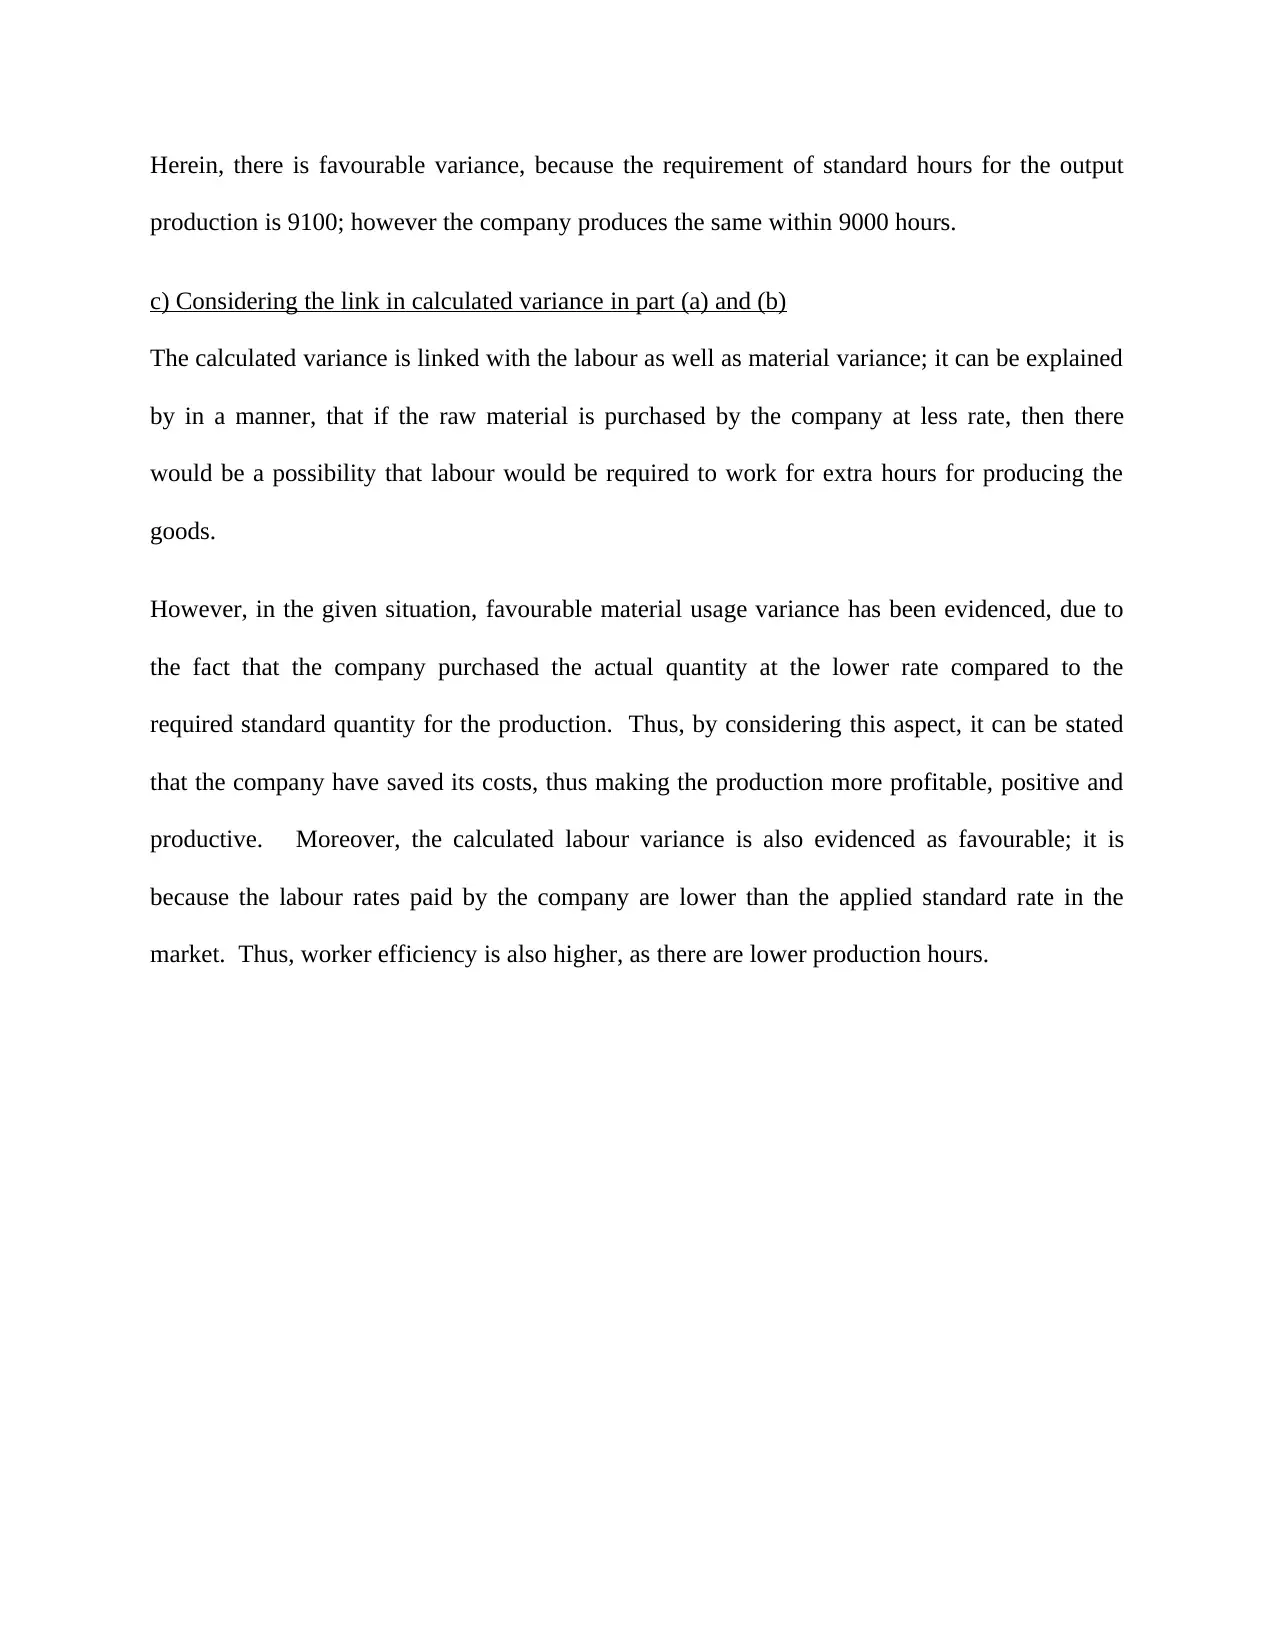
Herein, there is favourable variance, because the requirement of standard hours for the output
production is 9100; however the company produces the same within 9000 hours.
c) Considering the link in calculated variance in part (a) and (b)
The calculated variance is linked with the labour as well as material variance; it can be explained
by in a manner, that if the raw material is purchased by the company at less rate, then there
would be a possibility that labour would be required to work for extra hours for producing the
goods.
However, in the given situation, favourable material usage variance has been evidenced, due to
the fact that the company purchased the actual quantity at the lower rate compared to the
required standard quantity for the production. Thus, by considering this aspect, it can be stated
that the company have saved its costs, thus making the production more profitable, positive and
productive. Moreover, the calculated labour variance is also evidenced as favourable; it is
because the labour rates paid by the company are lower than the applied standard rate in the
market. Thus, worker efficiency is also higher, as there are lower production hours.
REFERENCES
Lara, J.M.G., Osma, B.G. and Penalva, F., 2016. Accounting conservatism and firm investment
efficiency. Journal of Accounting and Economics, 61(1), pp.221-238.
Latino, R.J., Latino, K.C. and Latino, M.A., 2016. Root cause analysis: improving performance
for bottom-line results. CRC Press, Sydney.
Swami, R. and Jain, T.K., 2019. Managing Investment Risks: Modern vs Traditional Knowledge
and Practices. Routledge, UK.
Tsai, H.F. and Luan, C.J., 2016. What makes firms embrace risks? A risk-taking capability
perspective. BRQ Business Research Quarterly, 19(3), pp.219-231.
Wild, T., 2017. Best practice in inventory management. Routledge, UK.
⊘ This is a preview!⊘
Do you want full access?
Subscribe today to unlock all pages.
Trusted by 1+ million students worldwide
1 out of 12
Related Documents


Your All-in-One AI-Powered Toolkit for Academic Success.
+13062052269
info@desklib.com
Available 24*7 on WhatsApp / Email
![[object Object]](/_next/static/media/star-bottom.7253800d.svg)
Unlock your academic potential
Copyright © 2020–2026 A2Z Services. All Rights Reserved. Developed and managed by ZUCOL.