Malaysia University of Science and Technology: Management Accounting
VerifiedAdded on 2022/12/19
|16
|3267
|71
Homework Assignment
AI Summary
This management accounting assignment solution provides a comprehensive analysis of various cost accounting concepts. The solution begins with an activity-based costing analysis, computing activity cost rates and assigning costs to different activities, including customer orders, complaints, and credit checks. It then proceeds to a break-even analysis, determining the sales levels required to achieve desired profit margins under single and double-shift operations. The assignment also covers budgeting, including sales, production, and component usage budgets, along with a production cost budget. Finally, it assesses financial feasibility based on the budget findings and presents a strategic plan for a university, focusing on operational improvements, student welfare, and strategic objectives. The solution demonstrates a strong understanding of cost accounting principles and their application in decision-making.
MANAGEMENT
ACCOUNTING
ACCOUNTING
Paraphrase This Document
Need a fresh take? Get an instant paraphrase of this document with our AI Paraphraser
TABLE OF CONTENTS
QUSETION- 1.................................................................................................................................1
(a) Computation of the activity cost rate as per the traditional method of activity based costing
......................................................................................................................................................1
(b) Computation of the time-driven activity cost driver rates......................................................1
(c) Computation of the cost assigned to each activities...............................................................2
(d).................................................................................................................................................2
QUESTION- 2.................................................................................................................................3
(a) Contribution margin per capacitor in January........................................................................3
(b) Sales level at the desired profit of 20%..................................................................................3
(c) Break-even analysis of single shift operations.......................................................................4
Break-even analysis of double shift operations...........................................................................4
(d) Sales level at the desired profit of 10% in February at single shift of operation...................4
Sales level at the desired profit of 10% in February at double shift of operation........................5
QUESTION 3...................................................................................................................................6
a) .................................................................................................................................................6
b)..................................................................................................................................................7
QUESTION 4...................................................................................................................................7
REFERENCES..............................................................................................................................12
QUSETION- 1
(a) Computation of the activity cost rate as per the traditional method of activity based costing
S.NO ACTIVITY
TIME
PERCENT
AGE
ASSIGNED
COST
ESTIMATED COST
DRIVER
QUANTITY
COST
DRIVER
RATE
1
Handle customer
orders 50.00% 300000 5000 customer orders
60 per customer
order
2
Process customer
complaints 35.00% 210000
700 customer
complaints
300 per
customer
complaint
3
Perform
customer credit
check 15.00% 90000 600 credit checks
150 per credit
checks
RM 600000
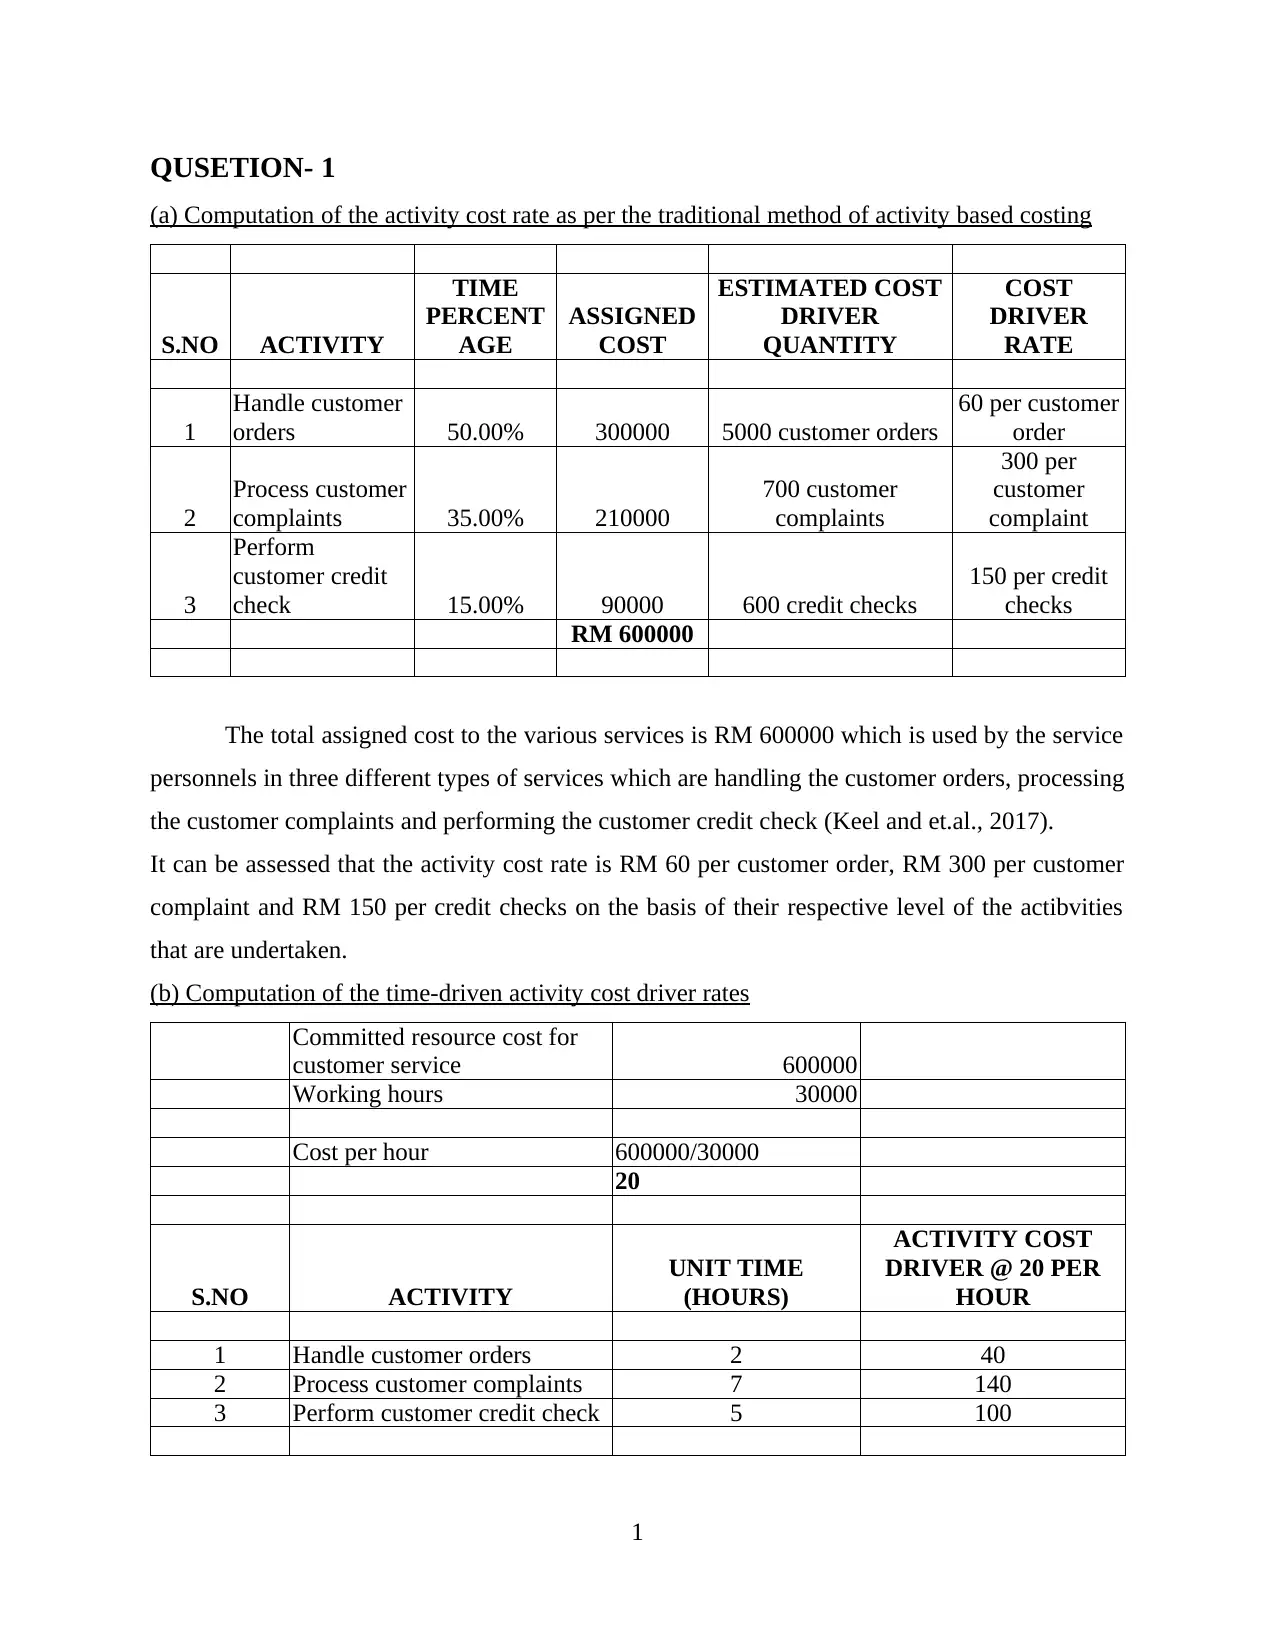
The total assigned cost to the various services is RM 600000 which is used by the service
personnels in three different types of services which are handling the customer orders, processing
the customer complaints and performing the customer credit check (Keel and et.al., 2017).
It can be assessed that the activity cost rate is RM 60 per customer order, RM 300 per customer
complaint and RM 150 per credit checks on the basis of their respective level of the actibvities
that are undertaken.
(b) Computation of the time-driven activity cost driver rates
Committed resource cost for
customer service 600000
Working hours 30000
Cost per hour 600000/30000
20
S.NO ACTIVITY
UNIT TIME
(HOURS)
ACTIVITY COST
DRIVER @ 20 PER
HOUR
1 Handle customer orders 2 40
2 Process customer complaints 7 140
3 Perform customer credit check 5 100
1
(a) Computation of the activity cost rate as per the traditional method of activity based costing
S.NO ACTIVITY
TIME
PERCENT
AGE
ASSIGNED
COST
ESTIMATED COST
DRIVER
QUANTITY
COST
DRIVER
RATE
1
Handle customer
orders 50.00% 300000 5000 customer orders
60 per customer
order
2
Process customer
complaints 35.00% 210000
700 customer
complaints
300 per
customer
complaint
3
Perform
customer credit
check 15.00% 90000 600 credit checks
150 per credit
checks
RM 600000
The total assigned cost to the various services is RM 600000 which is used by the service
personnels in three different types of services which are handling the customer orders, processing
the customer complaints and performing the customer credit check (Keel and et.al., 2017).
It can be assessed that the activity cost rate is RM 60 per customer order, RM 300 per customer
complaint and RM 150 per credit checks on the basis of their respective level of the actibvities
that are undertaken.
(b) Computation of the time-driven activity cost driver rates
Committed resource cost for
customer service 600000
Working hours 30000
Cost per hour 600000/30000
20
S.NO ACTIVITY
UNIT TIME
(HOURS)
ACTIVITY COST
DRIVER @ 20 PER
HOUR
1 Handle customer orders 2 40
2 Process customer complaints 7 140
3 Perform customer credit check 5 100
1
⊘ This is a preview!⊘
Do you want full access?
Subscribe today to unlock all pages.
Trusted by 1+ million students worldwide
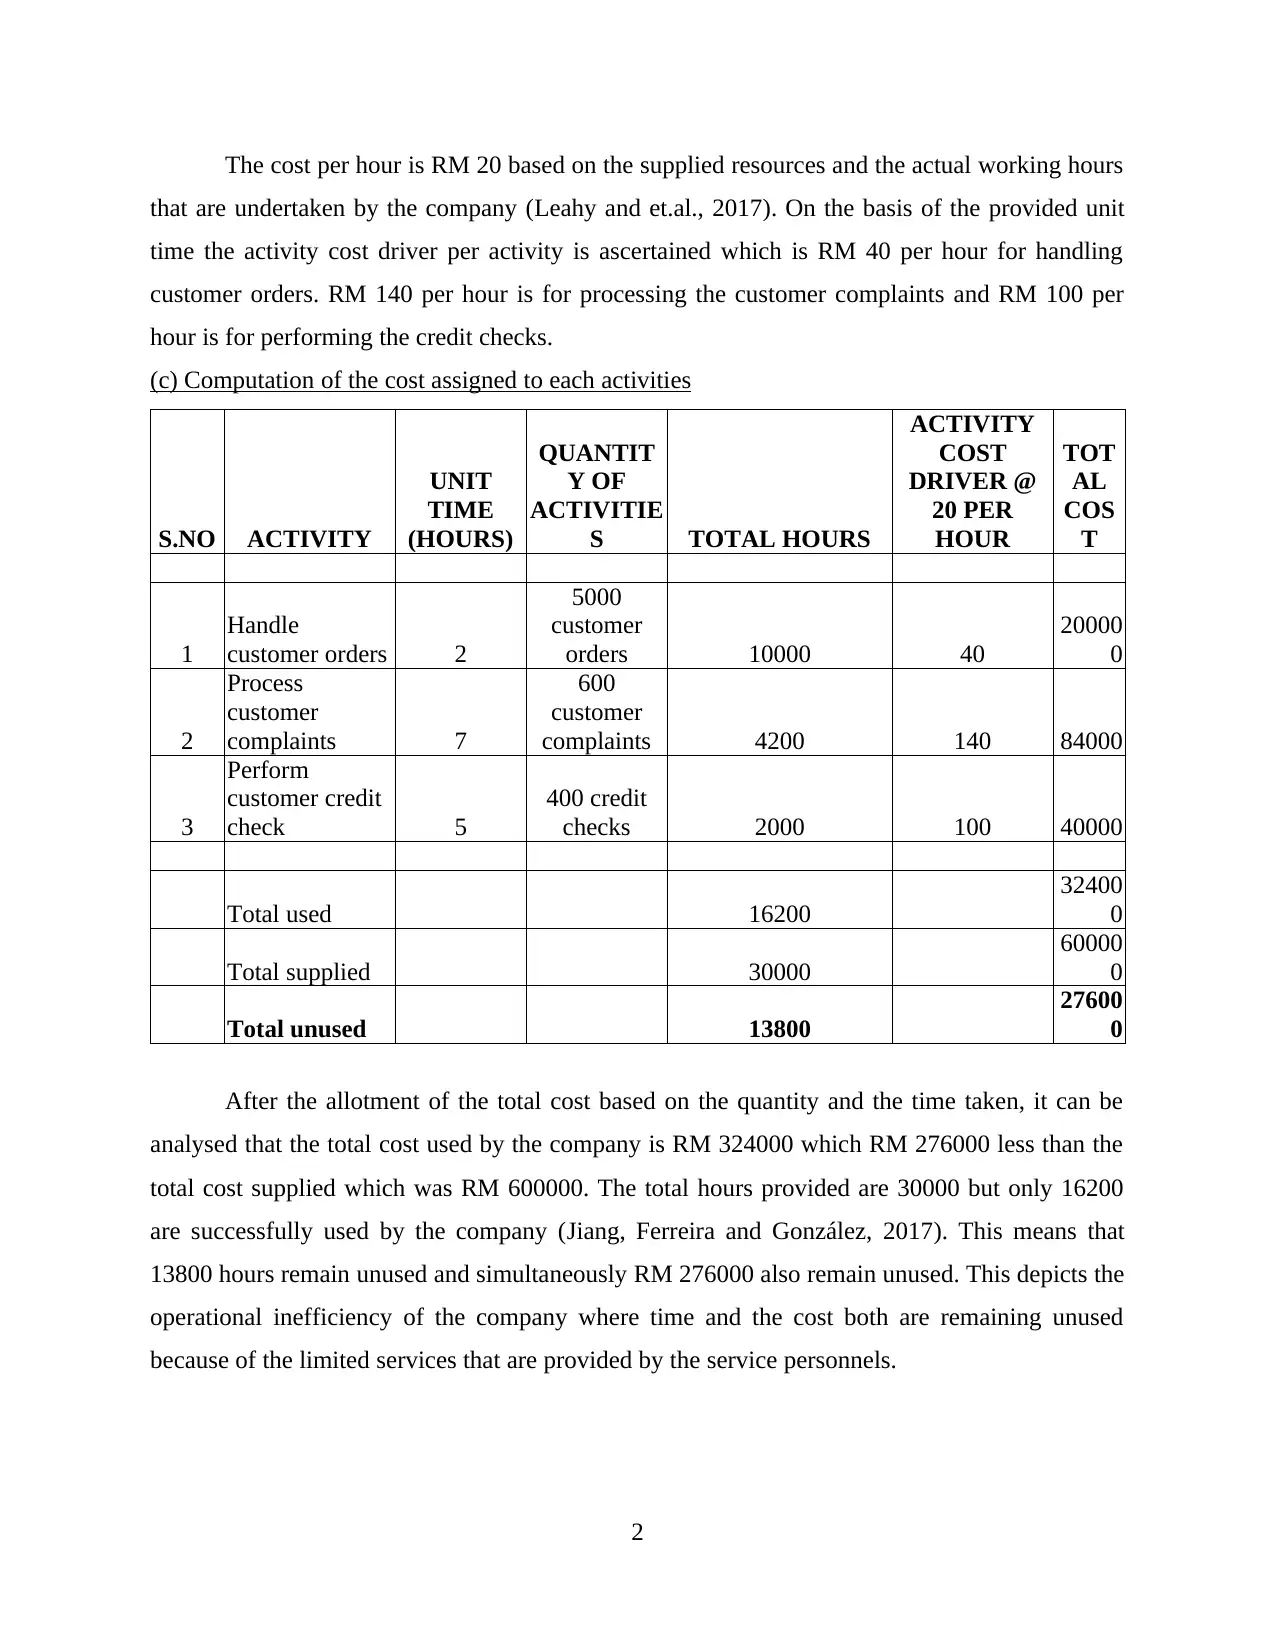
The cost per hour is RM 20 based on the supplied resources and the actual working hours
that are undertaken by the company (Leahy and et.al., 2017). On the basis of the provided unit
time the activity cost driver per activity is ascertained which is RM 40 per hour for handling
customer orders. RM 140 per hour is for processing the customer complaints and RM 100 per
hour is for performing the credit checks.
(c) Computation of the cost assigned to each activities
S.NO ACTIVITY
UNIT
TIME
(HOURS)
QUANTIT
Y OF
ACTIVITIE
S TOTAL HOURS
ACTIVITY
COST
DRIVER @
20 PER
HOUR
TOT
AL
COS
T
1
Handle
customer orders 2
5000
customer
orders 10000 40
20000
0
2
Process
customer
complaints 7
600
customer
complaints 4200 140 84000
3
Perform
customer credit
check 5
400 credit
checks 2000 100 40000
Total used 16200
32400
0
Total supplied 30000
60000
0
Total unused 13800
27600
0
After the allotment of the total cost based on the quantity and the time taken, it can be
analysed that the total cost used by the company is RM 324000 which RM 276000 less than the
total cost supplied which was RM 600000. The total hours provided are 30000 but only 16200
are successfully used by the company (Jiang, Ferreira and González, 2017). This means that
13800 hours remain unused and simultaneously RM 276000 also remain unused. This depicts the
operational inefficiency of the company where time and the cost both are remaining unused
because of the limited services that are provided by the service personnels.
2
Paraphrase This Document
Need a fresh take? Get an instant paraphrase of this document with our AI Paraphraser
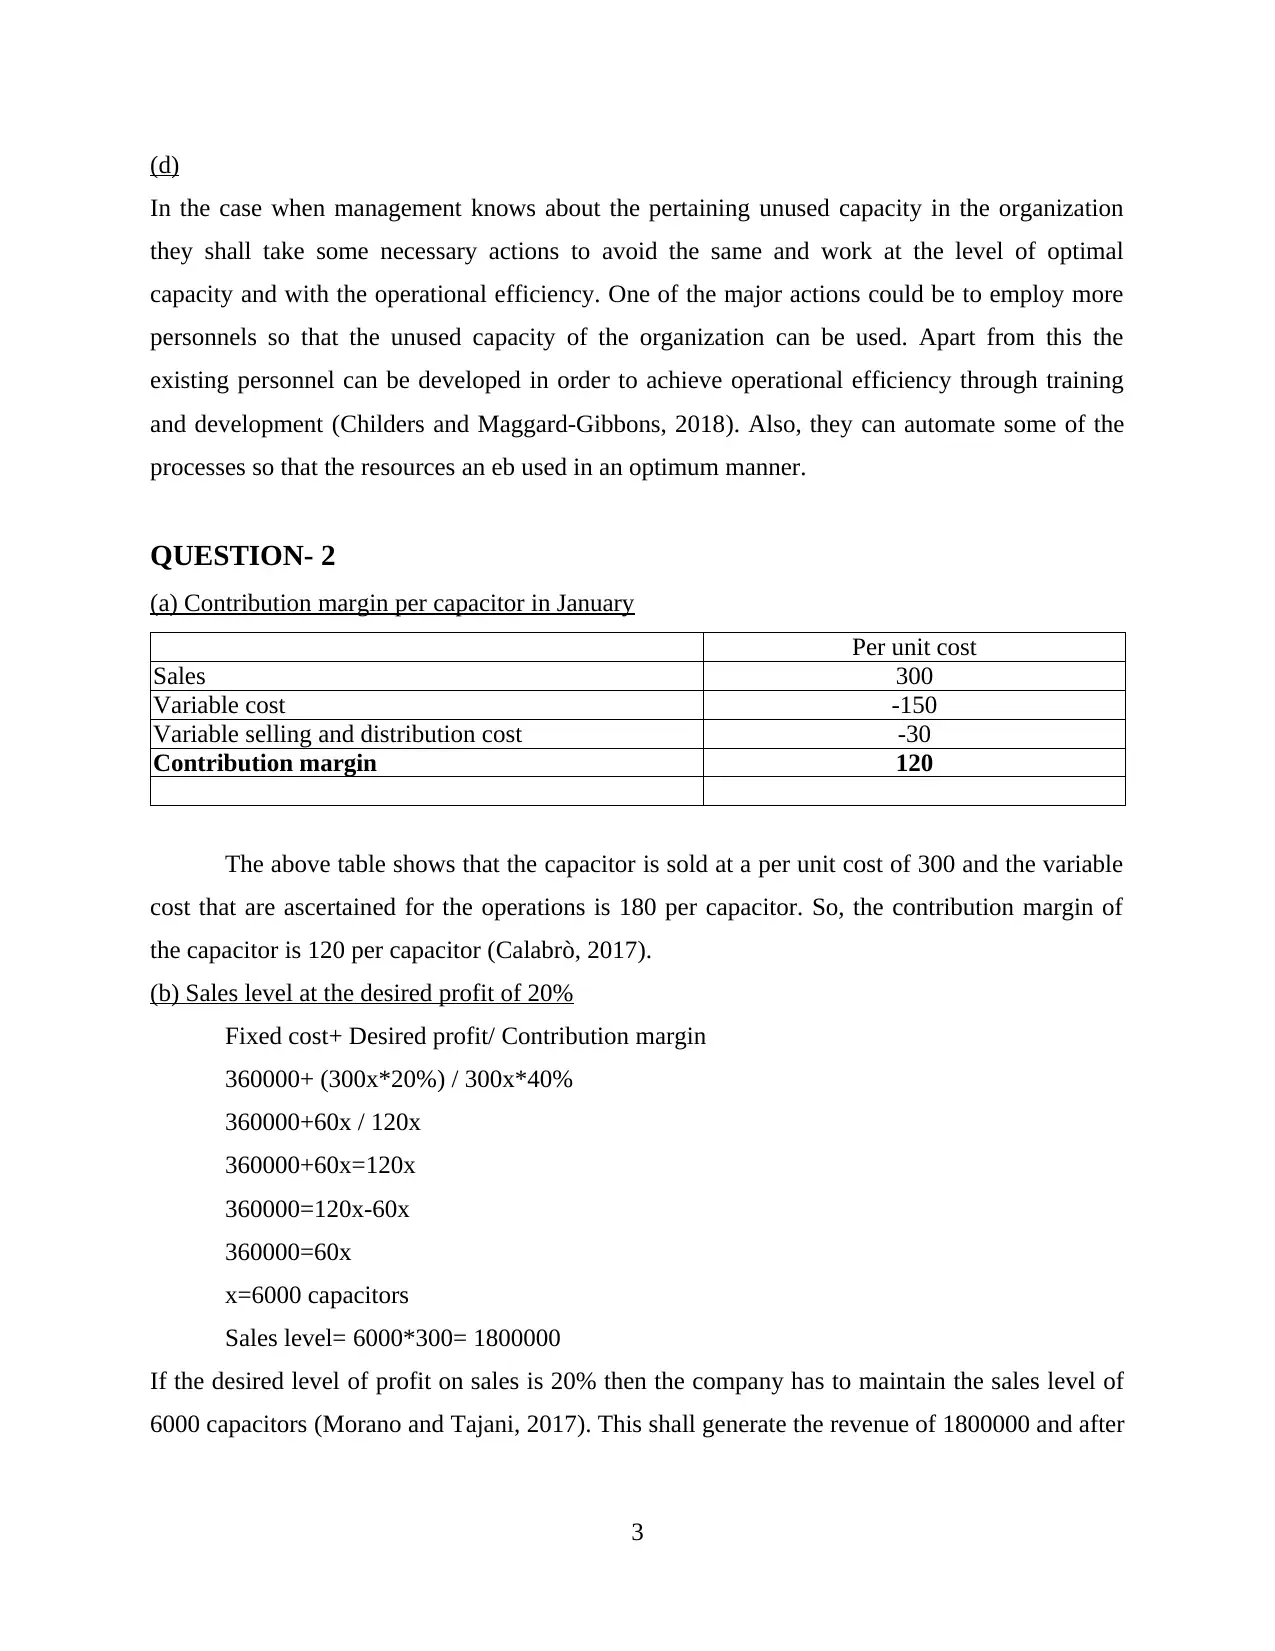
(d)
In the case when management knows about the pertaining unused capacity in the organization
they shall take some necessary actions to avoid the same and work at the level of optimal
capacity and with the operational efficiency. One of the major actions could be to employ more
personnels so that the unused capacity of the organization can be used. Apart from this the
existing personnel can be developed in order to achieve operational efficiency through training
and development (Childers and Maggard-Gibbons, 2018). Also, they can automate some of the
processes so that the resources an eb used in an optimum manner.
QUESTION- 2
(a) Contribution margin per capacitor in January
Per unit cost
Sales 300
Variable cost -150
Variable selling and distribution cost -30
Contribution margin 120
The above table shows that the capacitor is sold at a per unit cost of 300 and the variable
cost that are ascertained for the operations is 180 per capacitor. So, the contribution margin of
the capacitor is 120 per capacitor (Calabrò, 2017).
(b) Sales level at the desired profit of 20%
Fixed cost+ Desired profit/ Contribution margin
360000+ (300x*20%) / 300x*40%
360000+60x / 120x
360000+60x=120x
360000=120x-60x
360000=60x
x=6000 capacitors
Sales level= 6000*300= 1800000
If the desired level of profit on sales is 20% then the company has to maintain the sales level of
6000 capacitors (Morano and Tajani, 2017). This shall generate the revenue of 1800000 and after
3
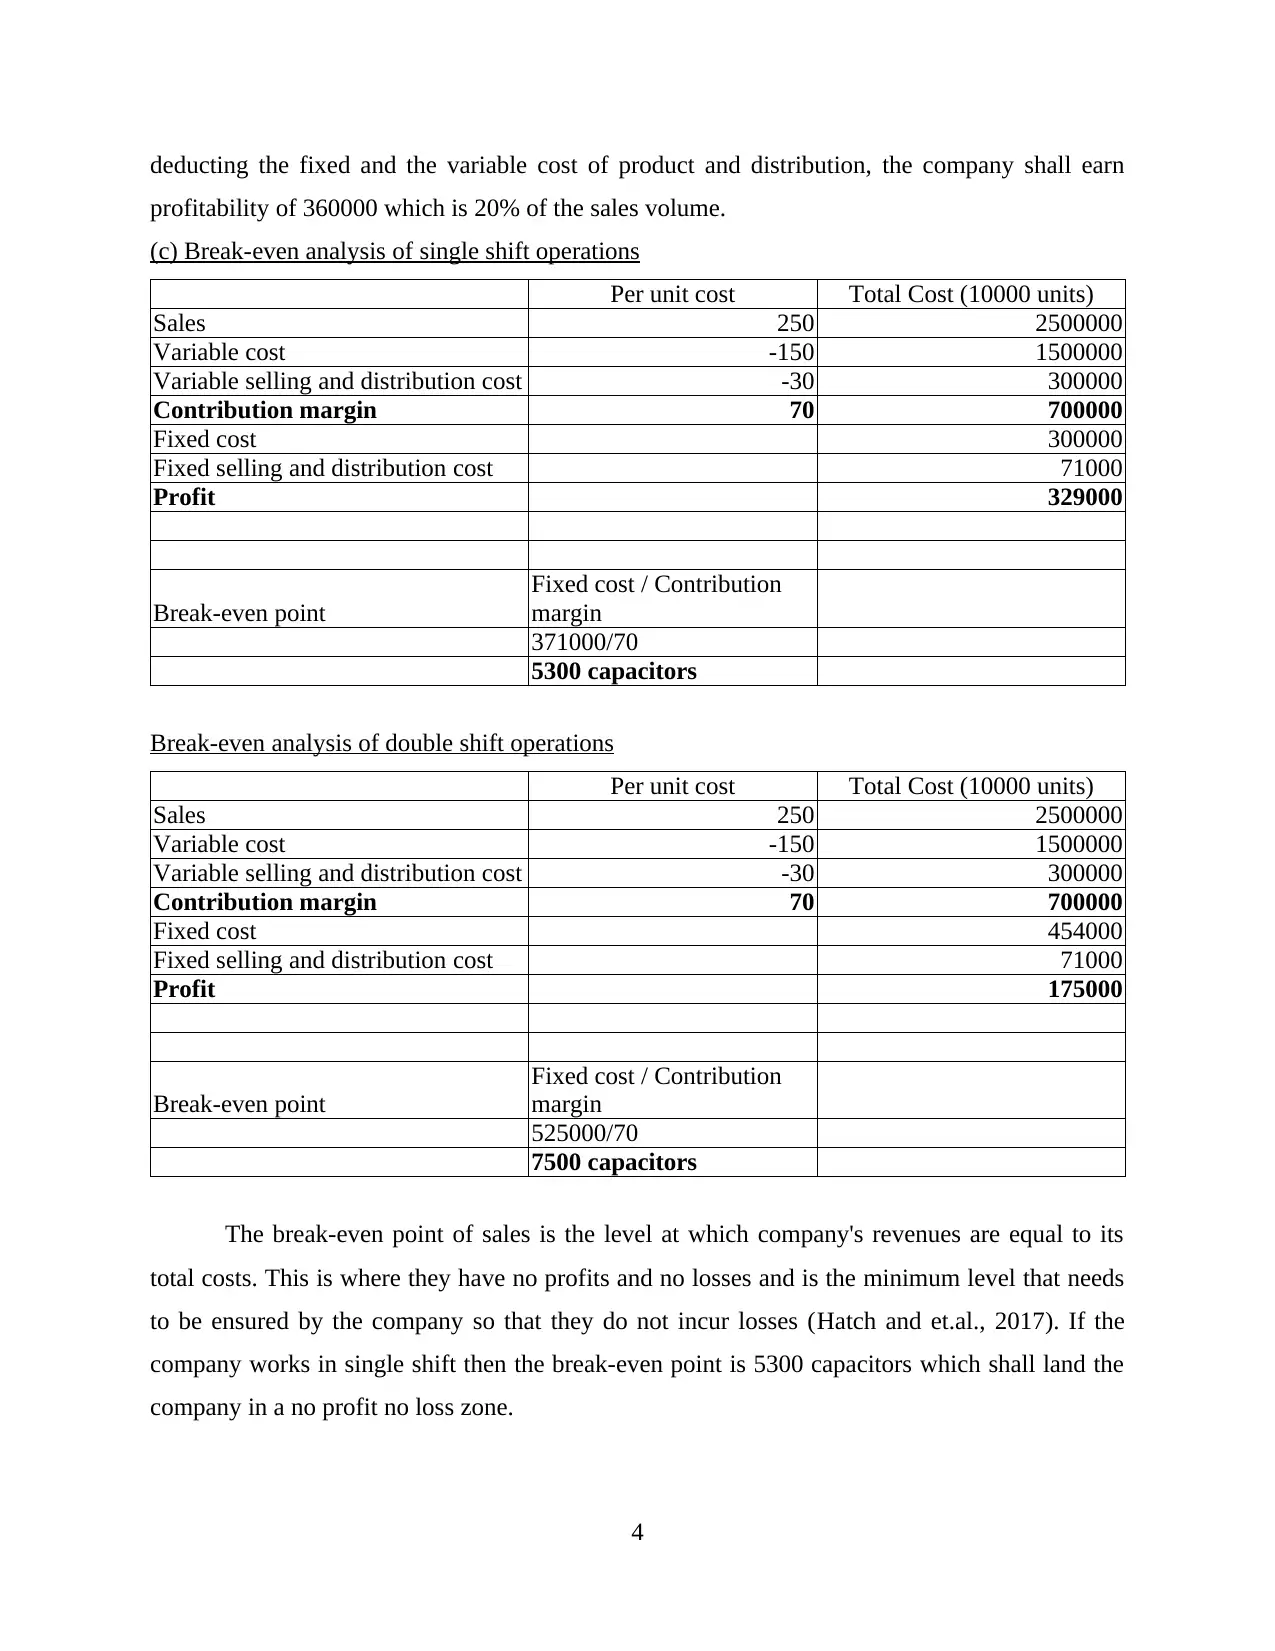
deducting the fixed and the variable cost of product and distribution, the company shall earn
profitability of 360000 which is 20% of the sales volume.
(c) Break-even analysis of single shift operations
Per unit cost Total Cost (10000 units)
Sales 250 2500000
Variable cost -150 1500000
Variable selling and distribution cost -30 300000
Contribution margin 70 700000
Fixed cost 300000
Fixed selling and distribution cost 71000
Profit 329000
Break-even point
Fixed cost / Contribution
margin
371000/70
5300 capacitors
Break-even analysis of double shift operations
Per unit cost Total Cost (10000 units)
Sales 250 2500000
Variable cost -150 1500000
Variable selling and distribution cost -30 300000
Contribution margin 70 700000
Fixed cost 454000
Fixed selling and distribution cost 71000
Profit 175000
Break-even point
Fixed cost / Contribution
margin
525000/70
7500 capacitors
The break-even point of sales is the level at which company's revenues are equal to its
total costs. This is where they have no profits and no losses and is the minimum level that needs
to be ensured by the company so that they do not incur losses (Hatch and et.al., 2017). If the
company works in single shift then the break-even point is 5300 capacitors which shall land the
company in a no profit no loss zone.
4
⊘ This is a preview!⊘
Do you want full access?
Subscribe today to unlock all pages.
Trusted by 1+ million students worldwide
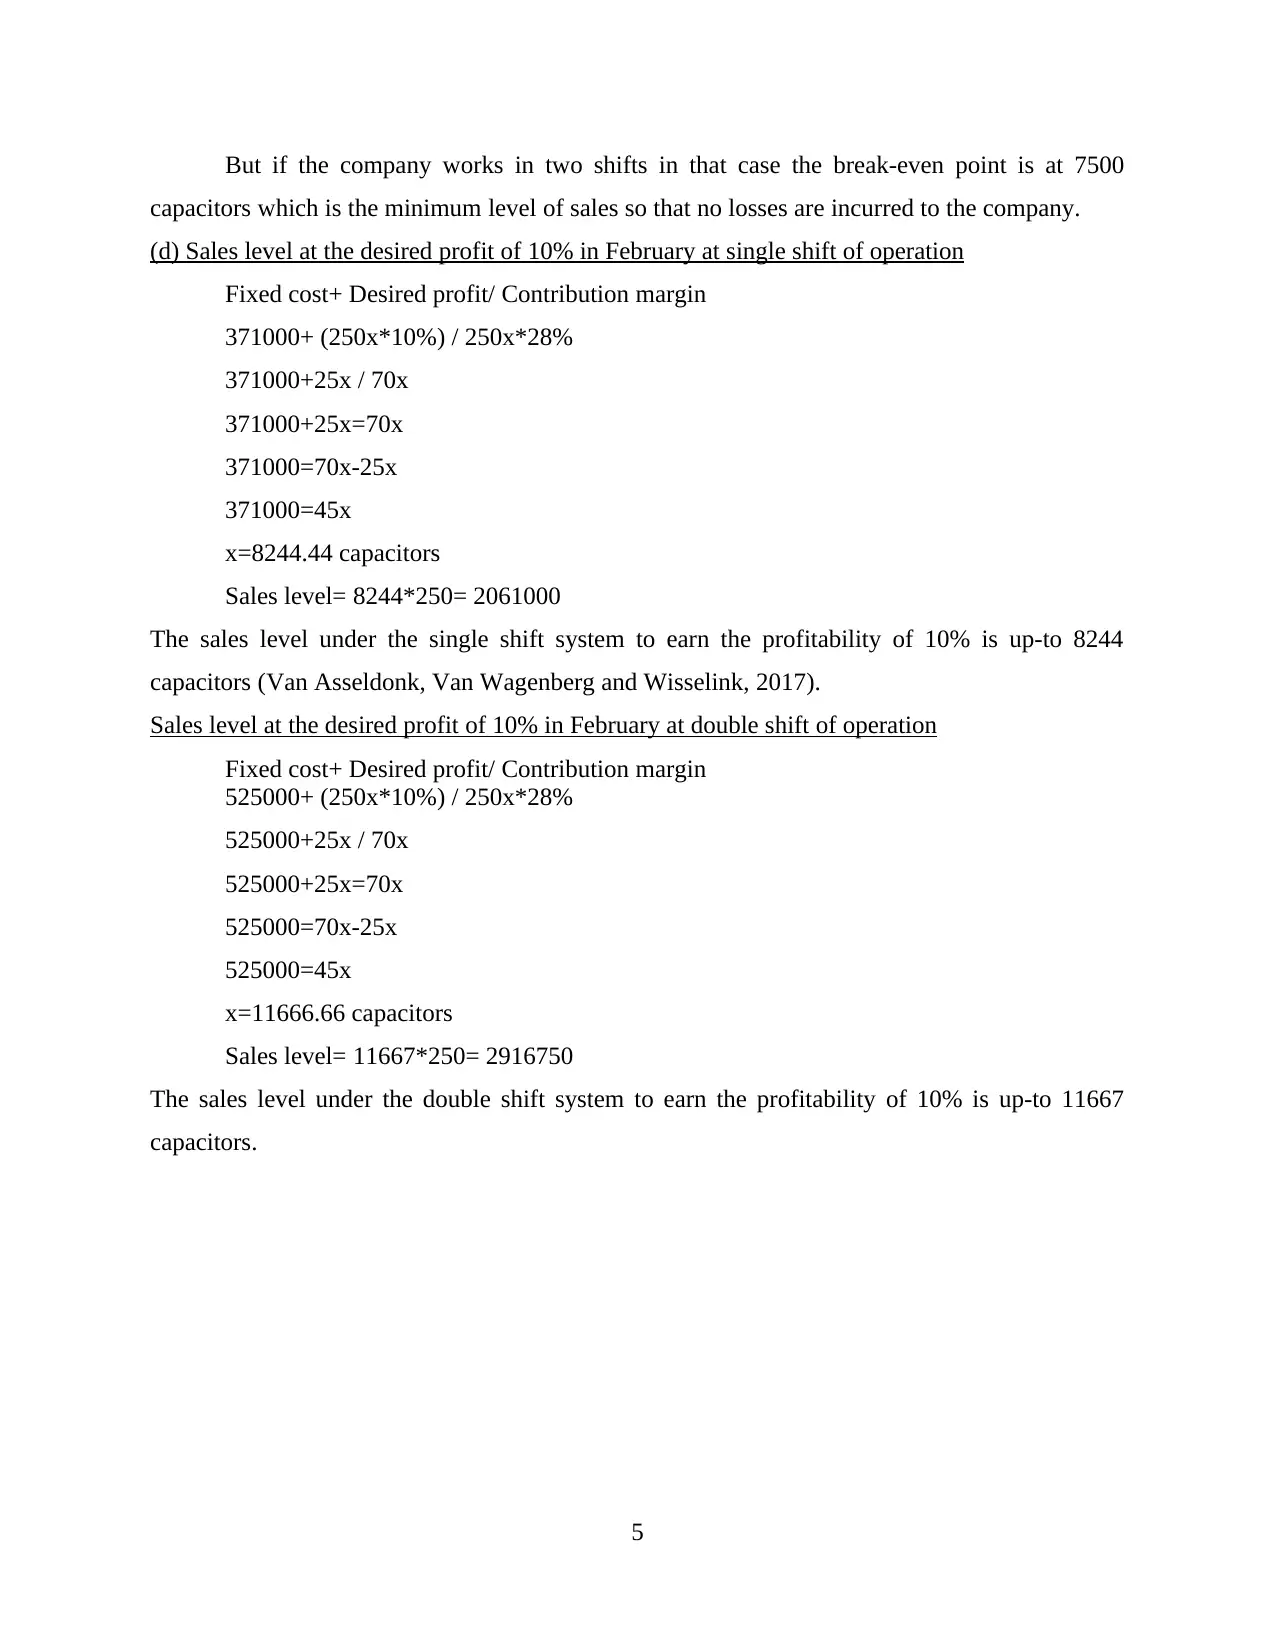
But if the company works in two shifts in that case the break-even point is at 7500
capacitors which is the minimum level of sales so that no losses are incurred to the company.
(d) Sales level at the desired profit of 10% in February at single shift of operation
Fixed cost+ Desired profit/ Contribution margin
371000+ (250x*10%) / 250x*28%
371000+25x / 70x
371000+25x=70x
371000=70x-25x
371000=45x
x=8244.44 capacitors
Sales level= 8244*250= 2061000
The sales level under the single shift system to earn the profitability of 10% is up-to 8244
capacitors (Van Asseldonk, Van Wagenberg and Wisselink, 2017).
Sales level at the desired profit of 10% in February at double shift of operation
Fixed cost+ Desired profit/ Contribution margin
525000+ (250x*10%) / 250x*28%
525000+25x / 70x
525000+25x=70x
525000=70x-25x
525000=45x
x=11666.66 capacitors
Sales level= 11667*250= 2916750
The sales level under the double shift system to earn the profitability of 10% is up-to 11667
capacitors.
5
Paraphrase This Document
Need a fresh take? Get an instant paraphrase of this document with our AI Paraphraser
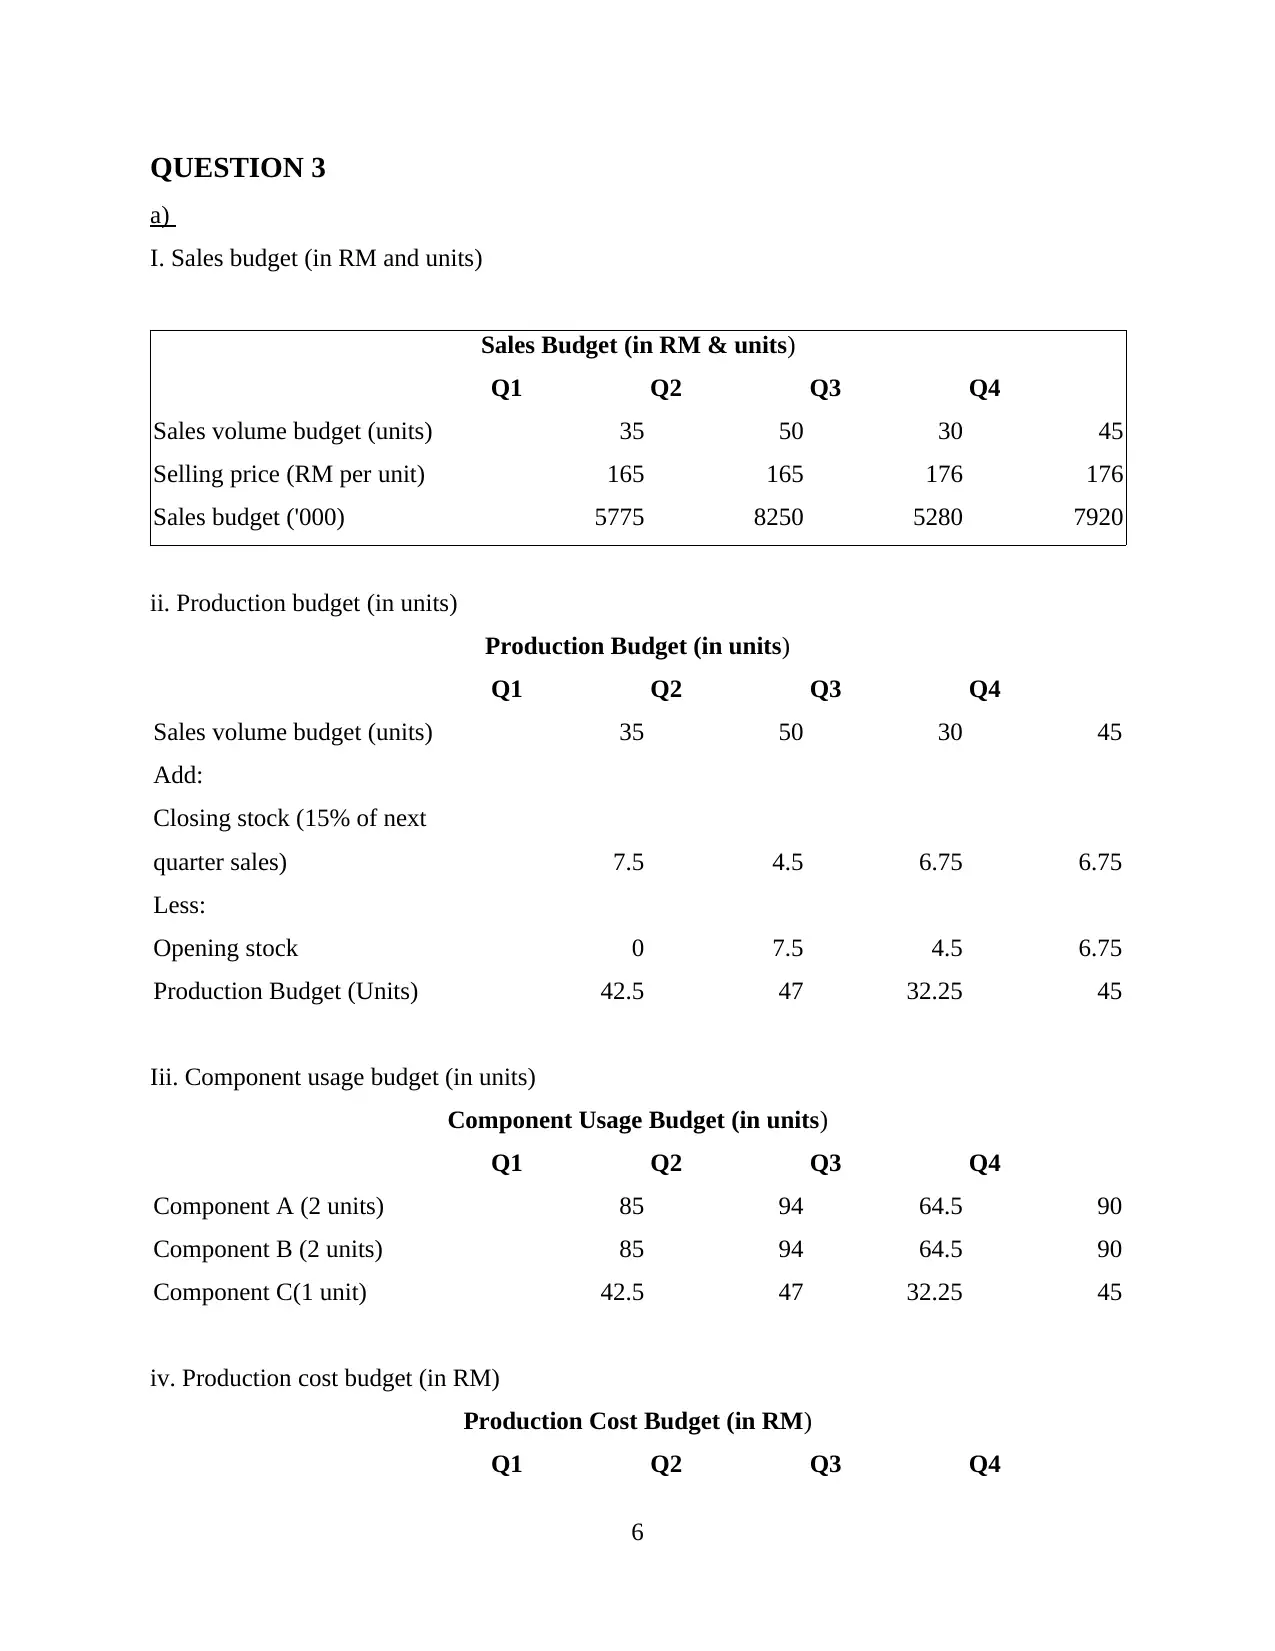
QUESTION 3
a)
I. Sales budget (in RM and units)
Sales Budget (in RM & units)
Q1 Q2 Q3 Q4
Sales volume budget (units) 35 50 30 45
Selling price (RM per unit) 165 165 176 176
Sales budget ('000) 5775 8250 5280 7920
ii. Production budget (in units)
Production Budget (in units)
Q1 Q2 Q3 Q4
Sales volume budget (units) 35 50 30 45
Add:
Closing stock (15% of next
quarter sales) 7.5 4.5 6.75 6.75
Less:
Opening stock 0 7.5 4.5 6.75
Production Budget (Units) 42.5 47 32.25 45
Iii. Component usage budget (in units)
Component Usage Budget (in units)
Q1 Q2 Q3 Q4
Component A (2 units) 85 94 64.5 90
Component B (2 units) 85 94 64.5 90
Component C(1 unit) 42.5 47 32.25 45
iv. Production cost budget (in RM)
Production Cost Budget (in RM)
Q1 Q2 Q3 Q4
6
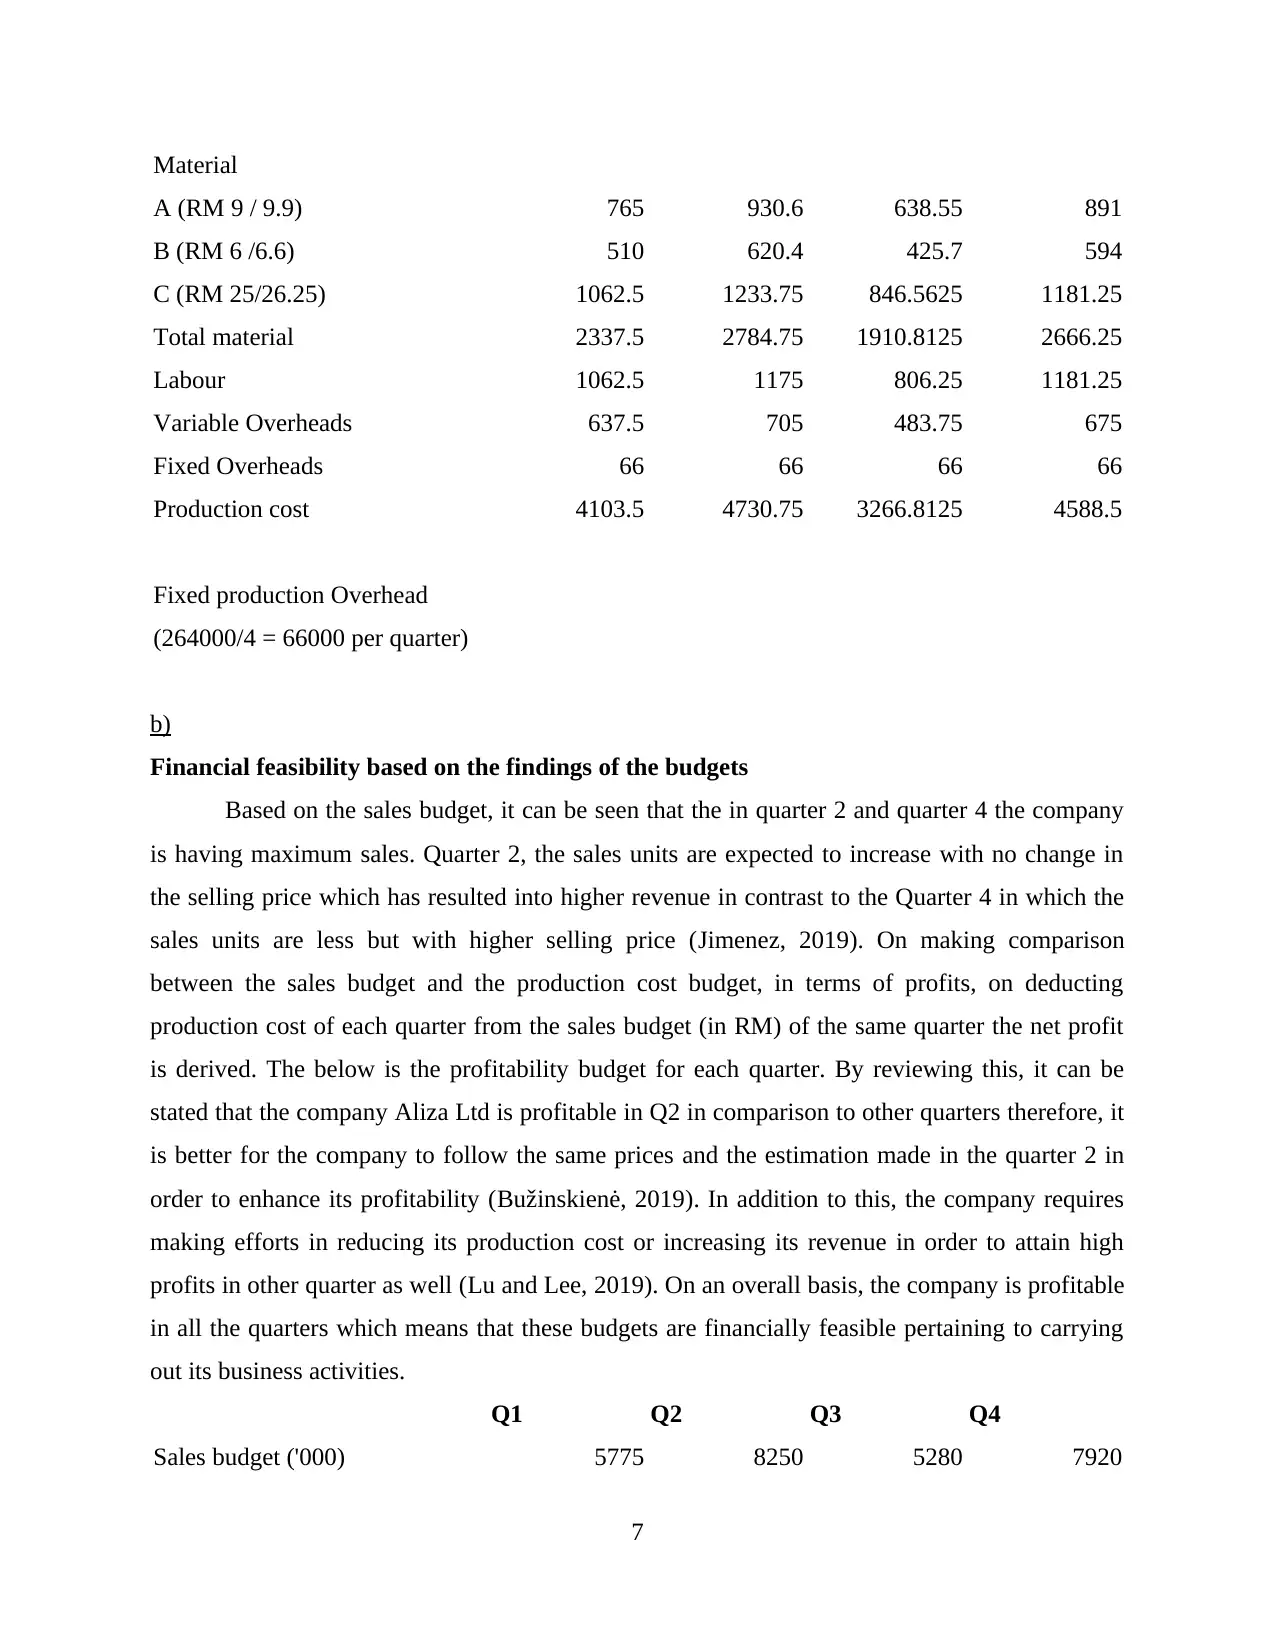
Material
A (RM 9 / 9.9) 765 930.6 638.55 891
B (RM 6 /6.6) 510 620.4 425.7 594
C (RM 25/26.25) 1062.5 1233.75 846.5625 1181.25
Total material 2337.5 2784.75 1910.8125 2666.25
Labour 1062.5 1175 806.25 1181.25
Variable Overheads 637.5 705 483.75 675
Fixed Overheads 66 66 66 66
Production cost 4103.5 4730.75 3266.8125 4588.5
Fixed production Overhead
(264000/4 = 66000 per quarter)
b)
Financial feasibility based on the findings of the budgets
Based on the sales budget, it can be seen that the in quarter 2 and quarter 4 the company
is having maximum sales. Quarter 2, the sales units are expected to increase with no change in
the selling price which has resulted into higher revenue in contrast to the Quarter 4 in which the
sales units are less but with higher selling price (Jimenez, 2019). On making comparison
between the sales budget and the production cost budget, in terms of profits, on deducting
production cost of each quarter from the sales budget (in RM) of the same quarter the net profit
is derived. The below is the profitability budget for each quarter. By reviewing this, it can be
stated that the company Aliza Ltd is profitable in Q2 in comparison to other quarters therefore, it
is better for the company to follow the same prices and the estimation made in the quarter 2 in
order to enhance its profitability (Bužinskienė, 2019). In addition to this, the company requires
making efforts in reducing its production cost or increasing its revenue in order to attain high
profits in other quarter as well (Lu and Lee, 2019). On an overall basis, the company is profitable
in all the quarters which means that these budgets are financially feasible pertaining to carrying
out its business activities.
Q1 Q2 Q3 Q4
Sales budget ('000) 5775 8250 5280 7920
7
⊘ This is a preview!⊘
Do you want full access?
Subscribe today to unlock all pages.
Trusted by 1+ million students worldwide
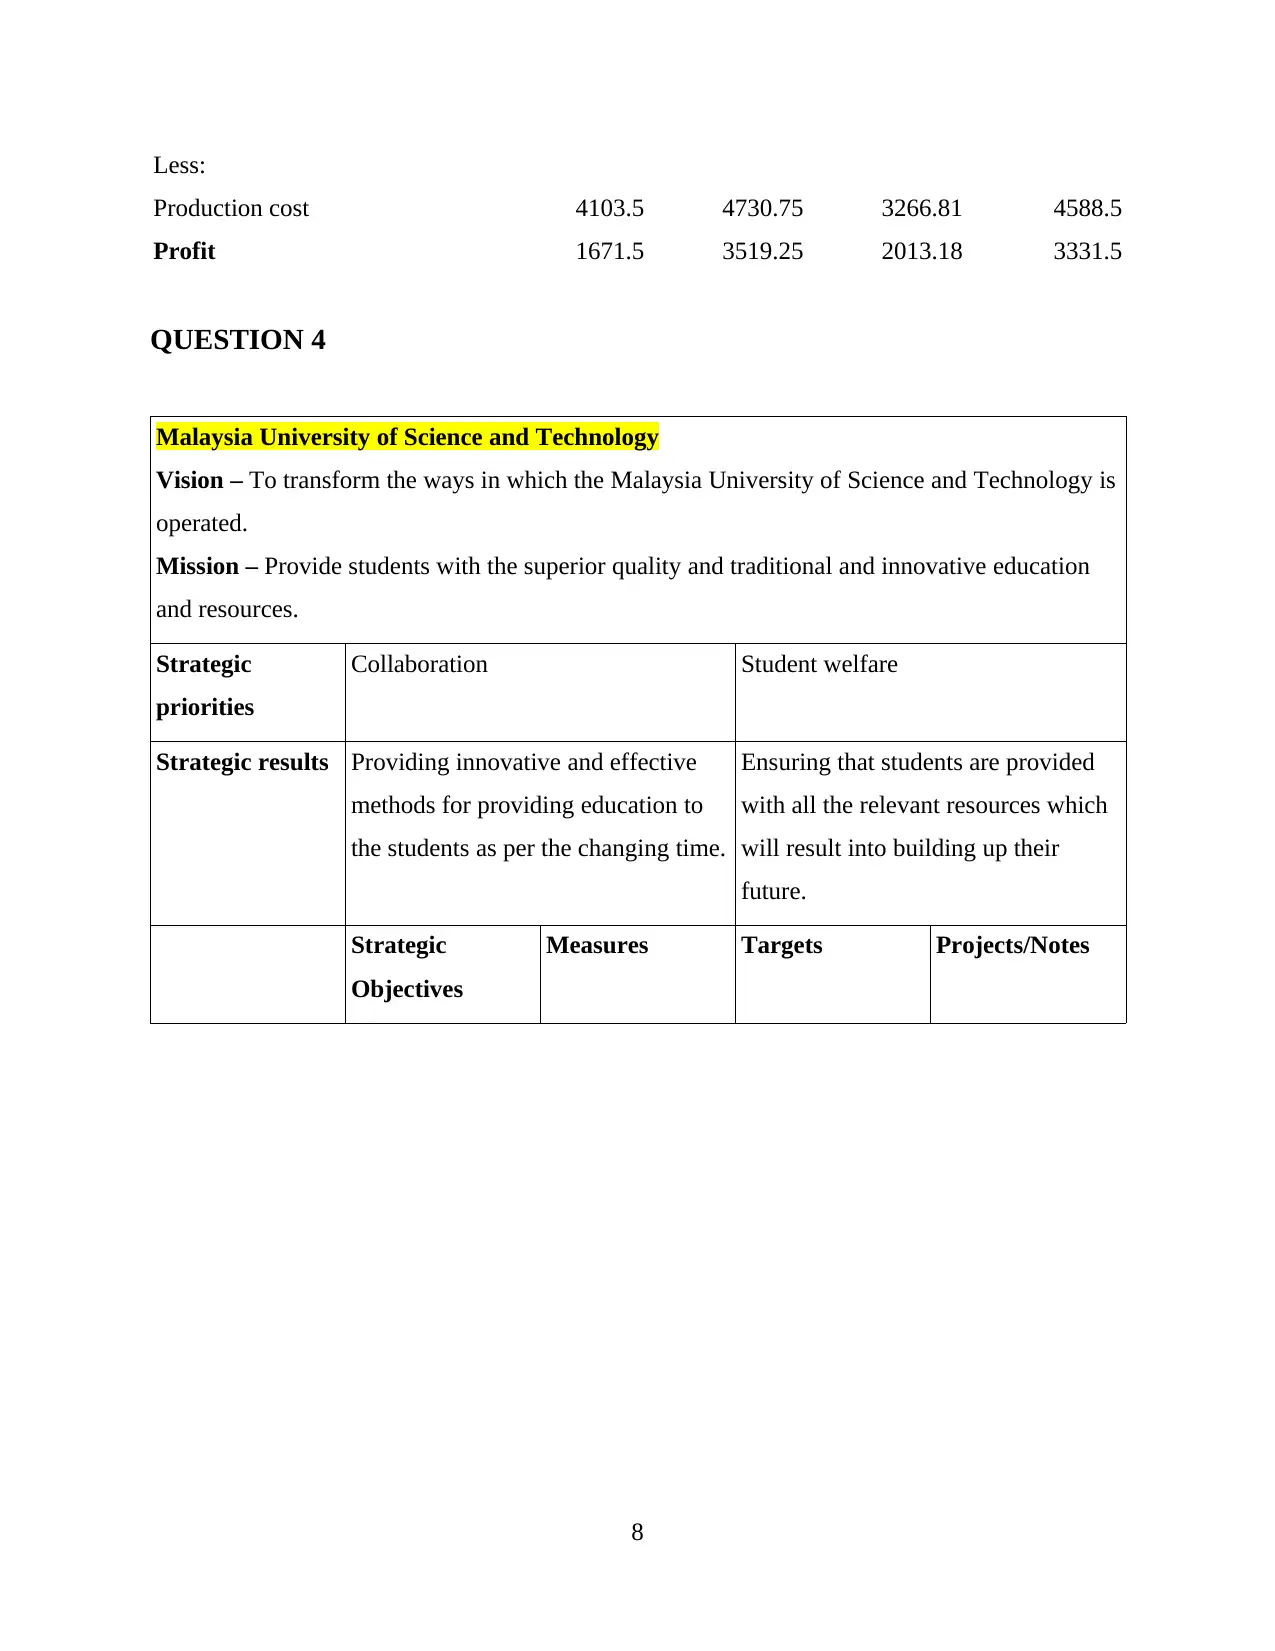
Less:
Production cost 4103.5 4730.75 3266.81 4588.5
Profit 1671.5 3519.25 2013.18 3331.5
QUESTION 4
Malaysia University of Science and Technology
Vision – To transform the ways in which the Malaysia University of Science and Technology is
operated.
Mission – Provide students with the superior quality and traditional and innovative education
and resources.
Strategic
priorities
Collaboration Student welfare
Strategic results Providing innovative and effective
methods for providing education to
the students as per the changing time.
Ensuring that students are provided
with all the relevant resources which
will result into building up their
future.
Strategic
Objectives
Measures Targets Projects/Notes
8
Paraphrase This Document
Need a fresh take? Get an instant paraphrase of this document with our AI Paraphraser
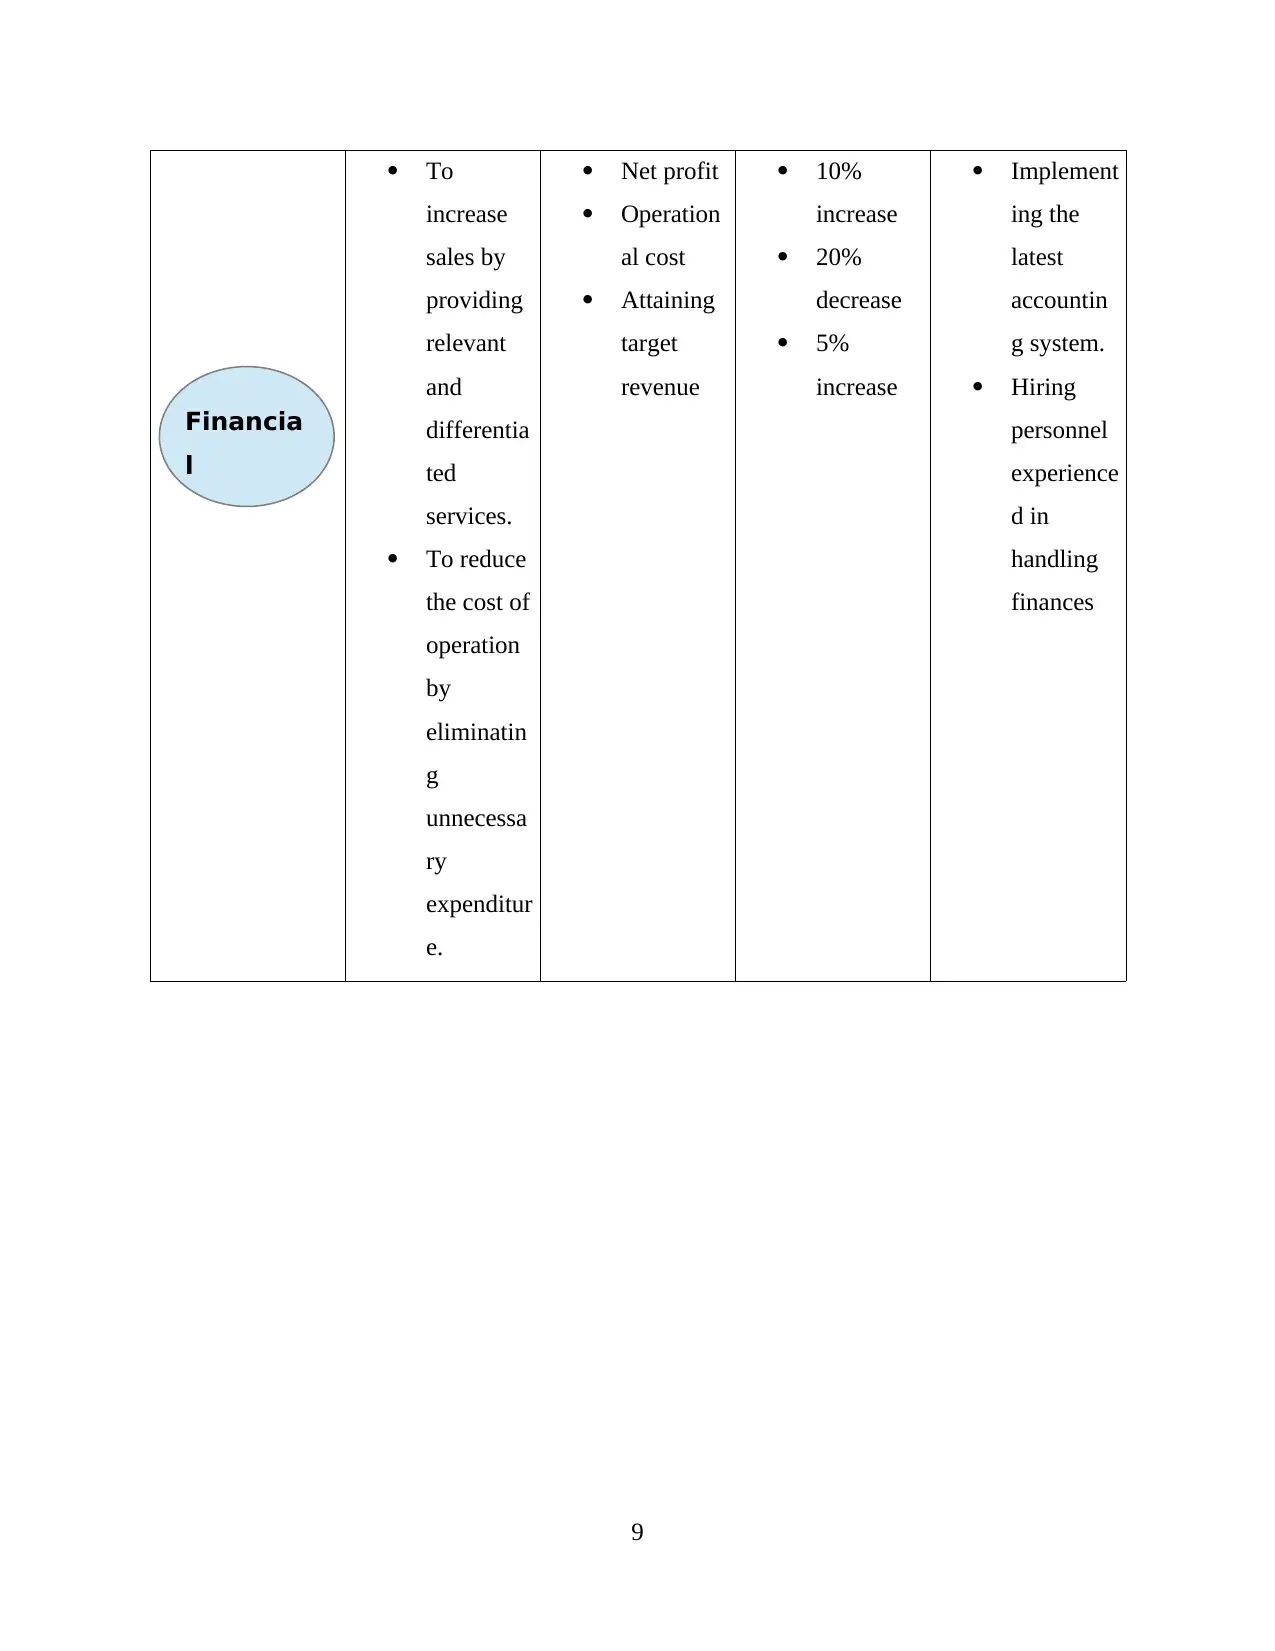
To
increase
sales by
providing
relevant
and
differentia
ted
services.
To reduce
the cost of
operation
by
eliminatin
g
unnecessa
ry
expenditur
e.
Net profit
Operation
al cost
Attaining
target
revenue
10%
increase
20%
decrease
5%
increase
Implement
ing the
latest
accountin
g system.
Hiring
personnel
experience
d in
handling
finances
9
Financia
l
increase
sales by
providing
relevant
and
differentia
ted
services.
To reduce
the cost of
operation
by
eliminatin
g
unnecessa
ry
expenditur
e.
Net profit
Operation
al cost
Attaining
target
revenue
10%
increase
20%
decrease
5%
increase
Implement
ing the
latest
accountin
g system.
Hiring
personnel
experience
d in
handling
finances
9
Financia
l
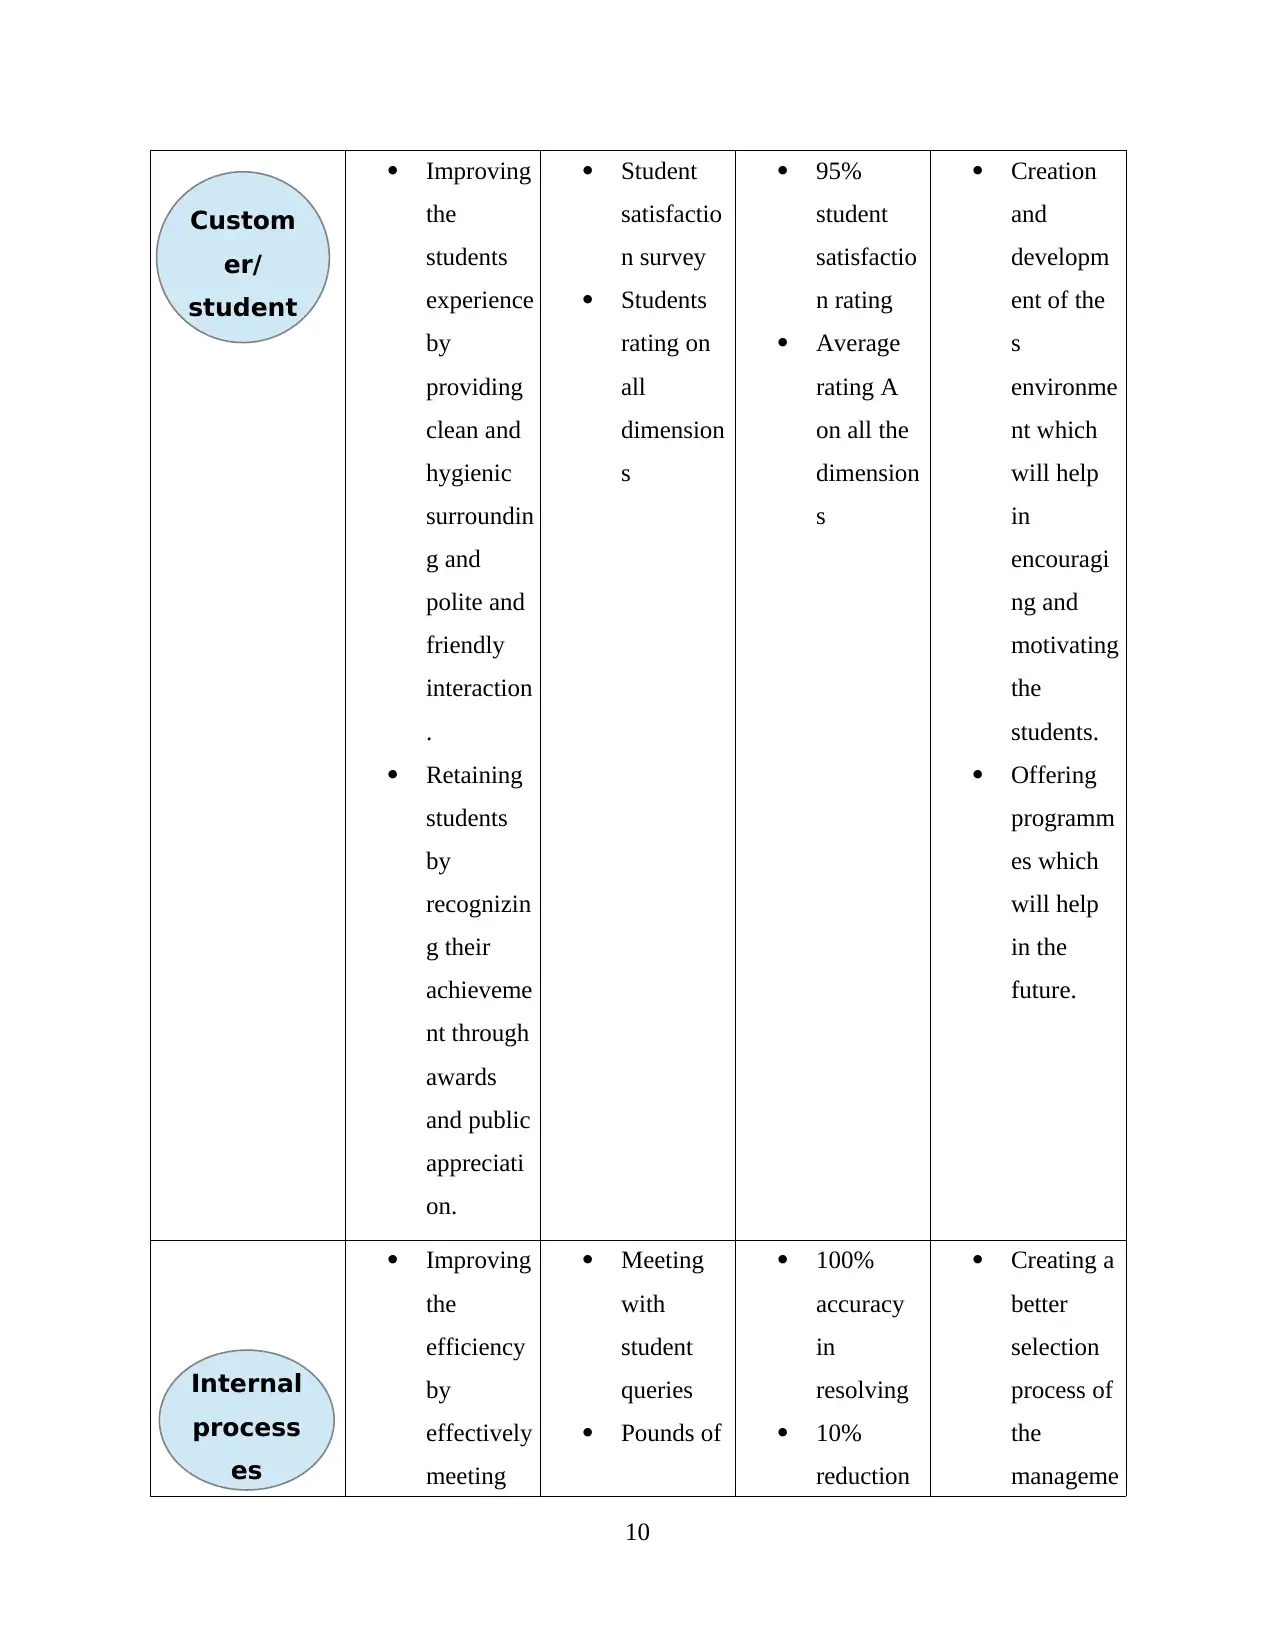
Improving
the
students
experience
by
providing
clean and
hygienic
surroundin
g and
polite and
friendly
interaction
.
Retaining
students
by
recognizin
g their
achieveme
nt through
awards
and public
appreciati
on.
Student
satisfactio
n survey
Students
rating on
all
dimension
s
95%
student
satisfactio
n rating
Average
rating A
on all the
dimension
s
Creation
and
developm
ent of the
s
environme
nt which
will help
in
encouragi
ng and
motivating
the
students.
Offering
programm
es which
will help
in the
future.
Improving
the
efficiency
by
effectively
meeting
Meeting
with
student
queries
Pounds of
100%
accuracy
in
resolving
10%
reduction
Creating a
better
selection
process of
the
manageme
10
Custom
er/
student
Internal
process
es
the
students
experience
by
providing
clean and
hygienic
surroundin
g and
polite and
friendly
interaction
.
Retaining
students
by
recognizin
g their
achieveme
nt through
awards
and public
appreciati
on.
Student
satisfactio
n survey
Students
rating on
all
dimension
s
95%
student
satisfactio
n rating
Average
rating A
on all the
dimension
s
Creation
and
developm
ent of the
s
environme
nt which
will help
in
encouragi
ng and
motivating
the
students.
Offering
programm
es which
will help
in the
future.
Improving
the
efficiency
by
effectively
meeting
Meeting
with
student
queries
Pounds of
100%
accuracy
in
resolving
10%
reduction
Creating a
better
selection
process of
the
manageme
10
Custom
er/
student
Internal
process
es
⊘ This is a preview!⊘
Do you want full access?
Subscribe today to unlock all pages.
Trusted by 1+ million students worldwide
1 out of 16
Related Documents


Your All-in-One AI-Powered Toolkit for Academic Success.
+13062052269
info@desklib.com
Available 24*7 on WhatsApp / Email
![[object Object]](/_next/static/media/star-bottom.7253800d.svg)
Unlock your academic potential
Copyright © 2020–2026 A2Z Services. All Rights Reserved. Developed and managed by ZUCOL.