Management Accounting Assignment: Budgeting and Financial Statements
VerifiedAdded on  2020/01/23
|8
|845
|88
Homework Assignment
AI Summary
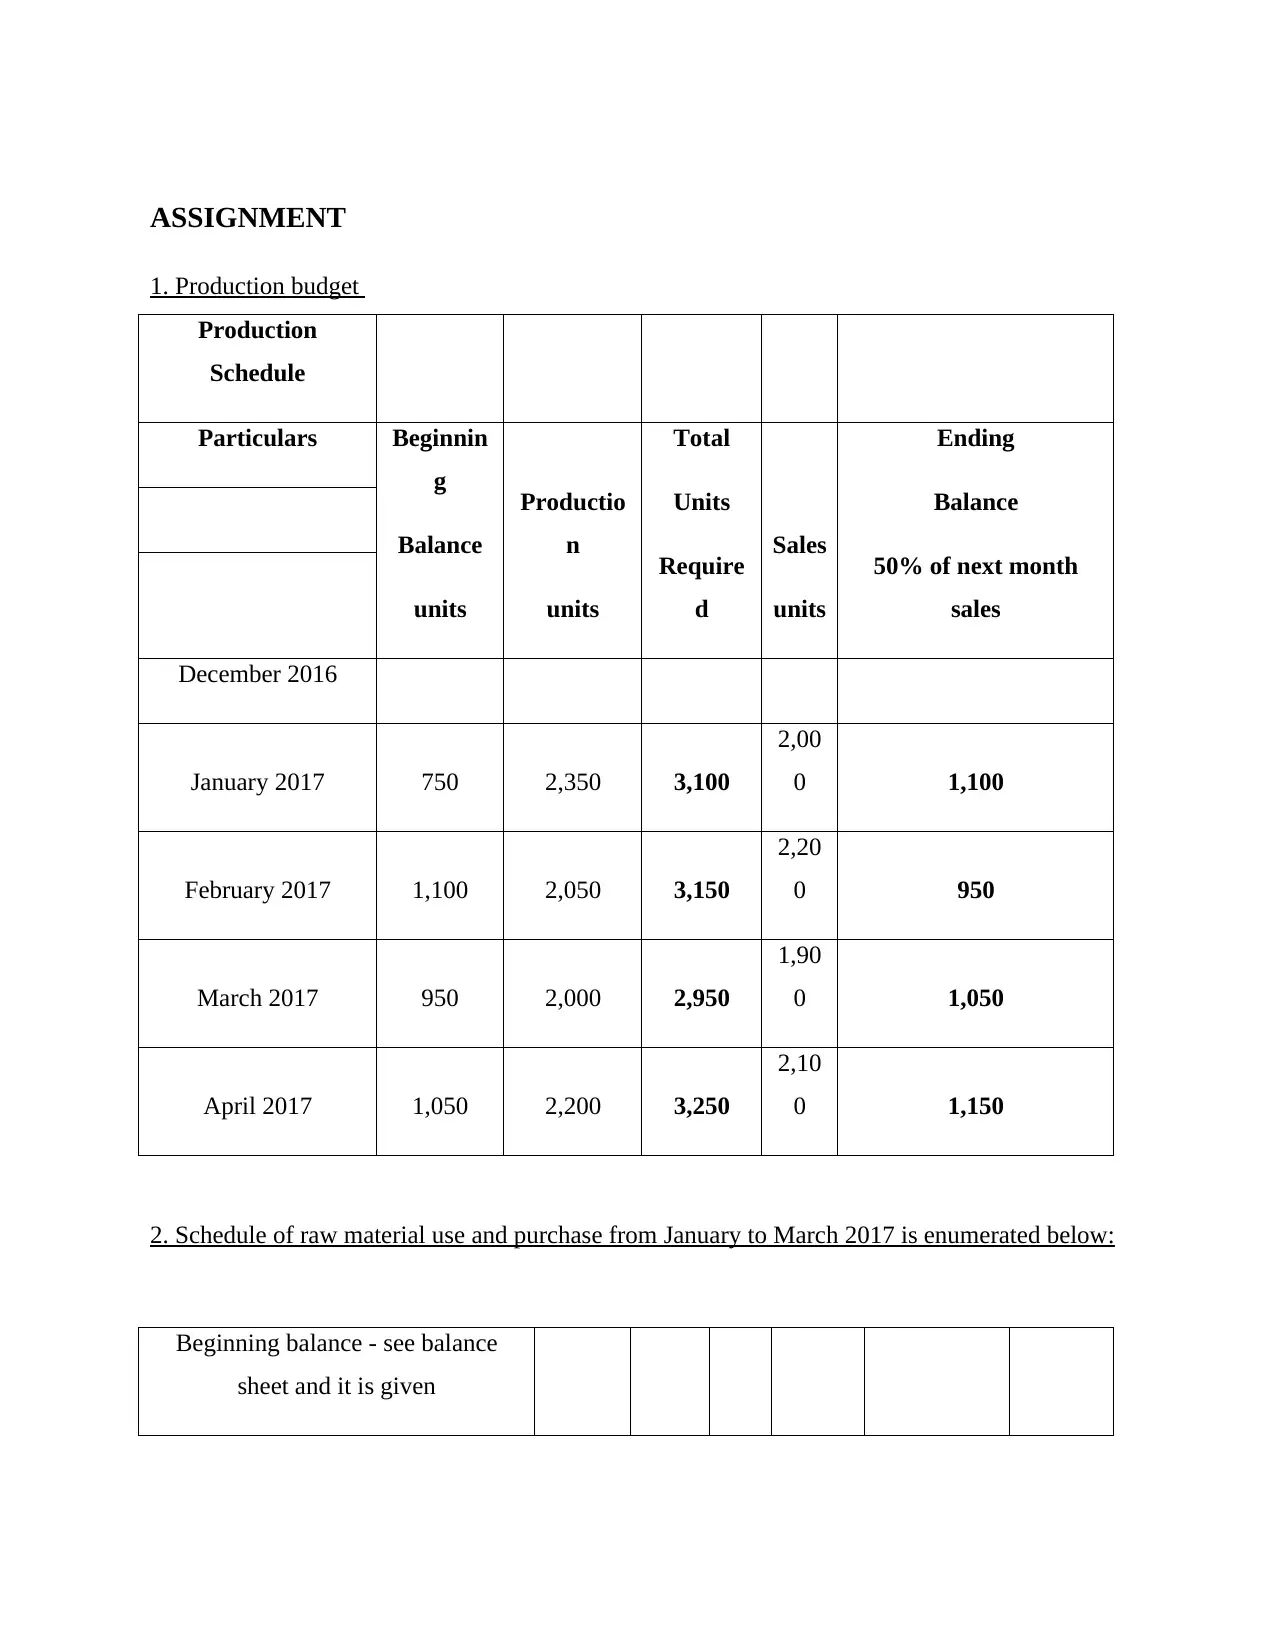
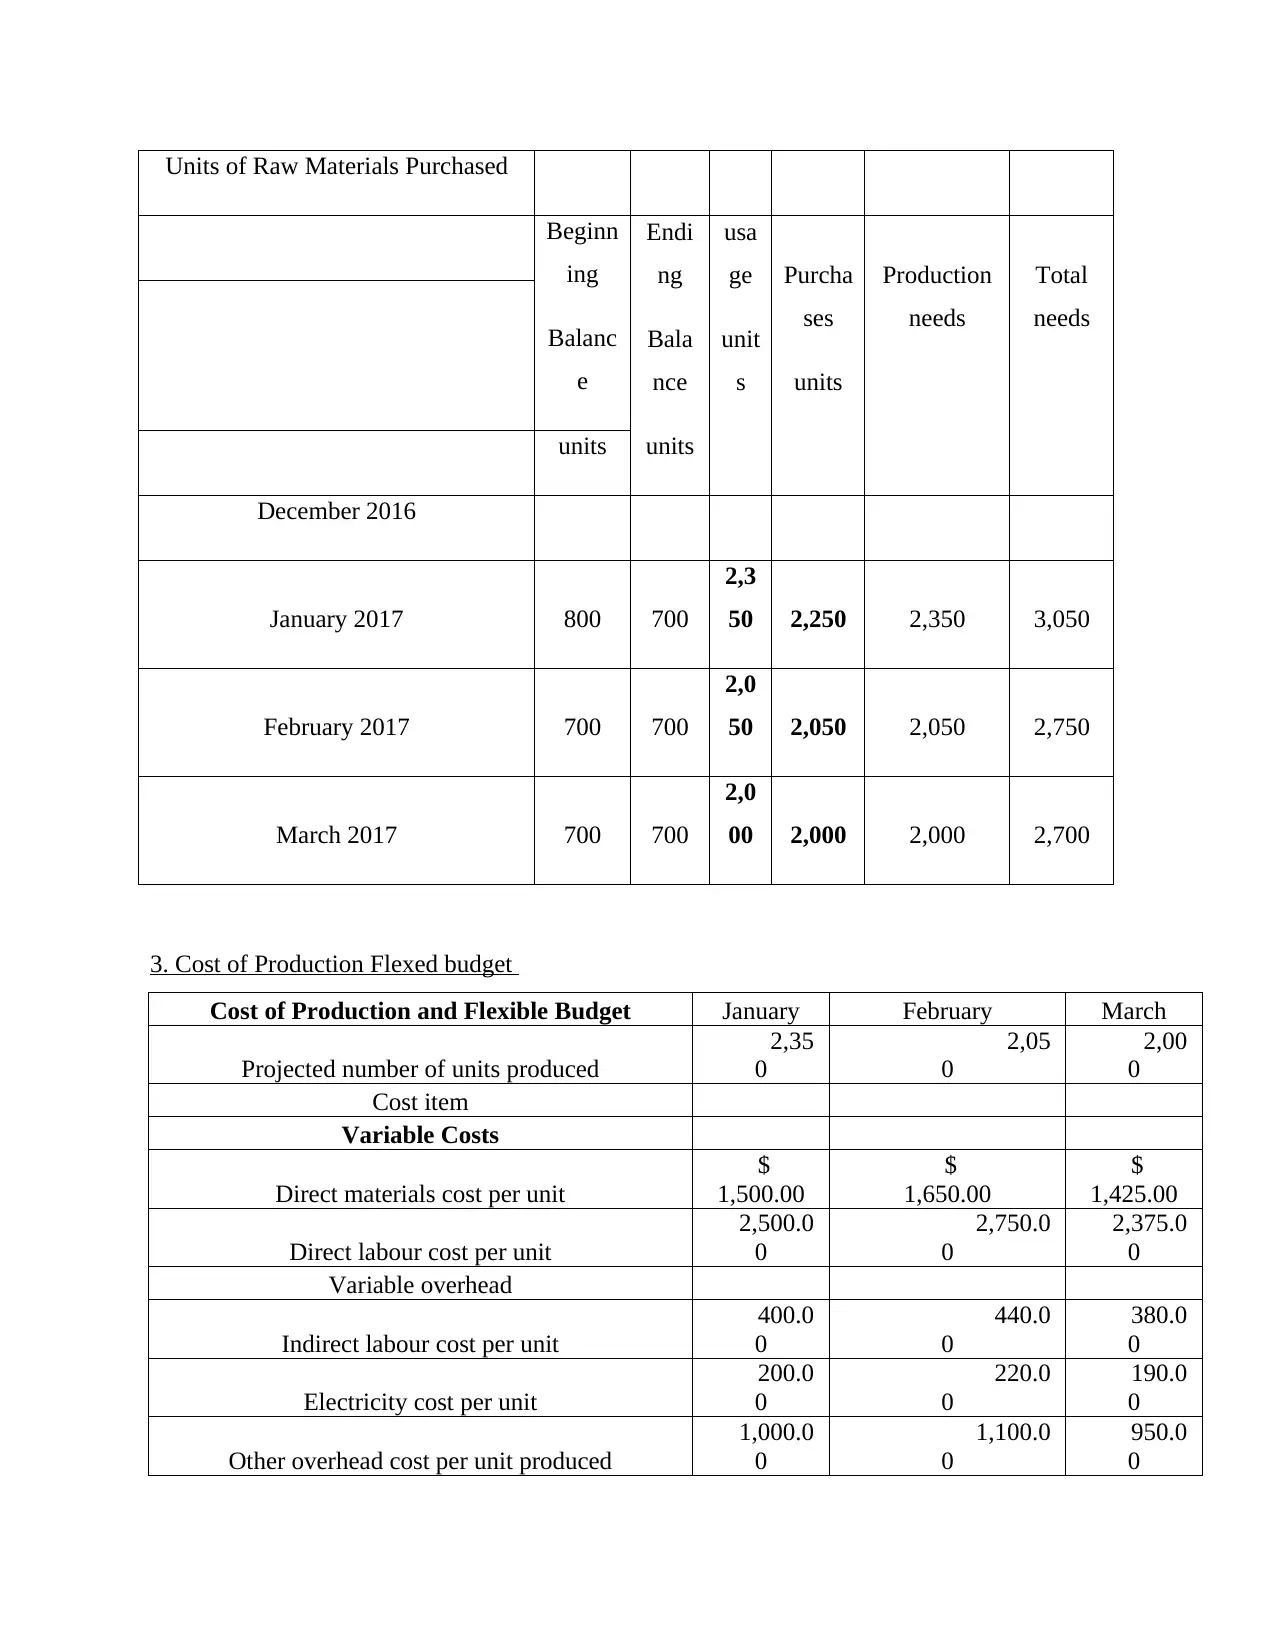
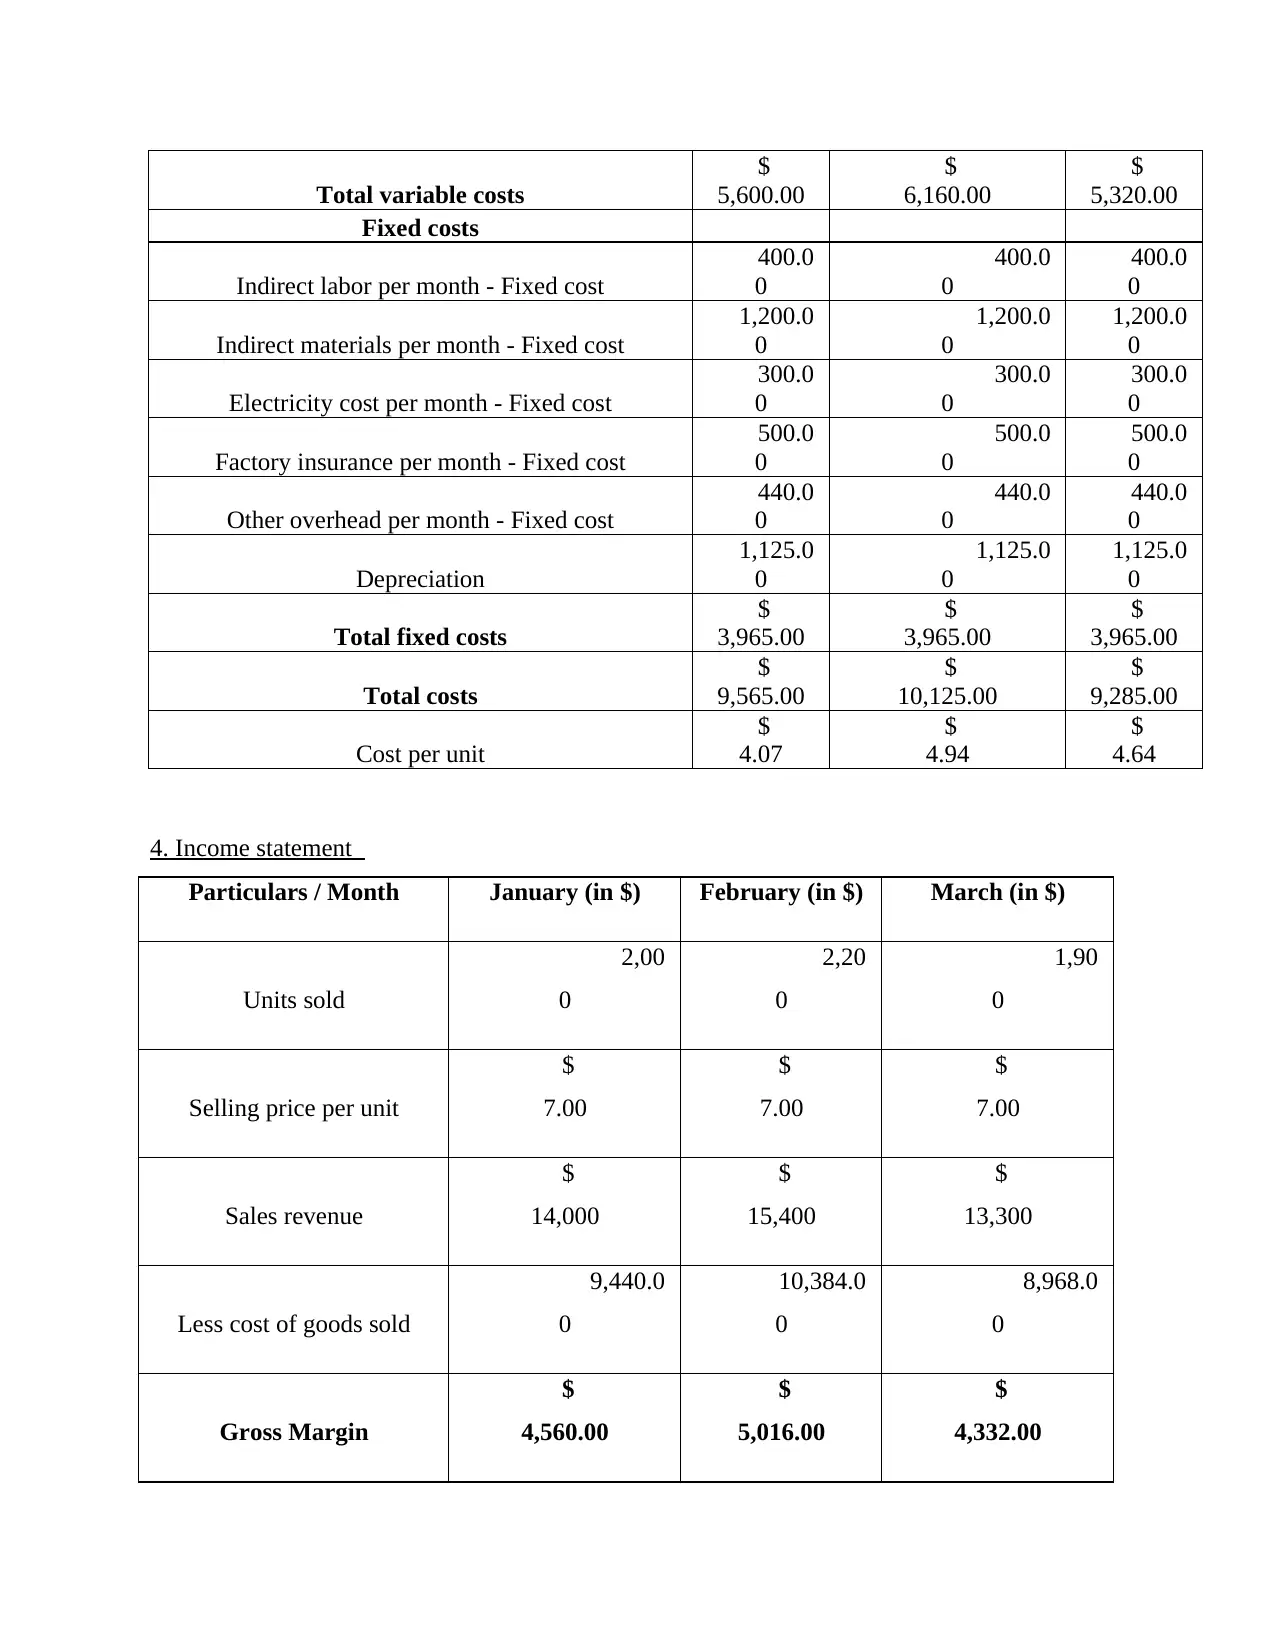
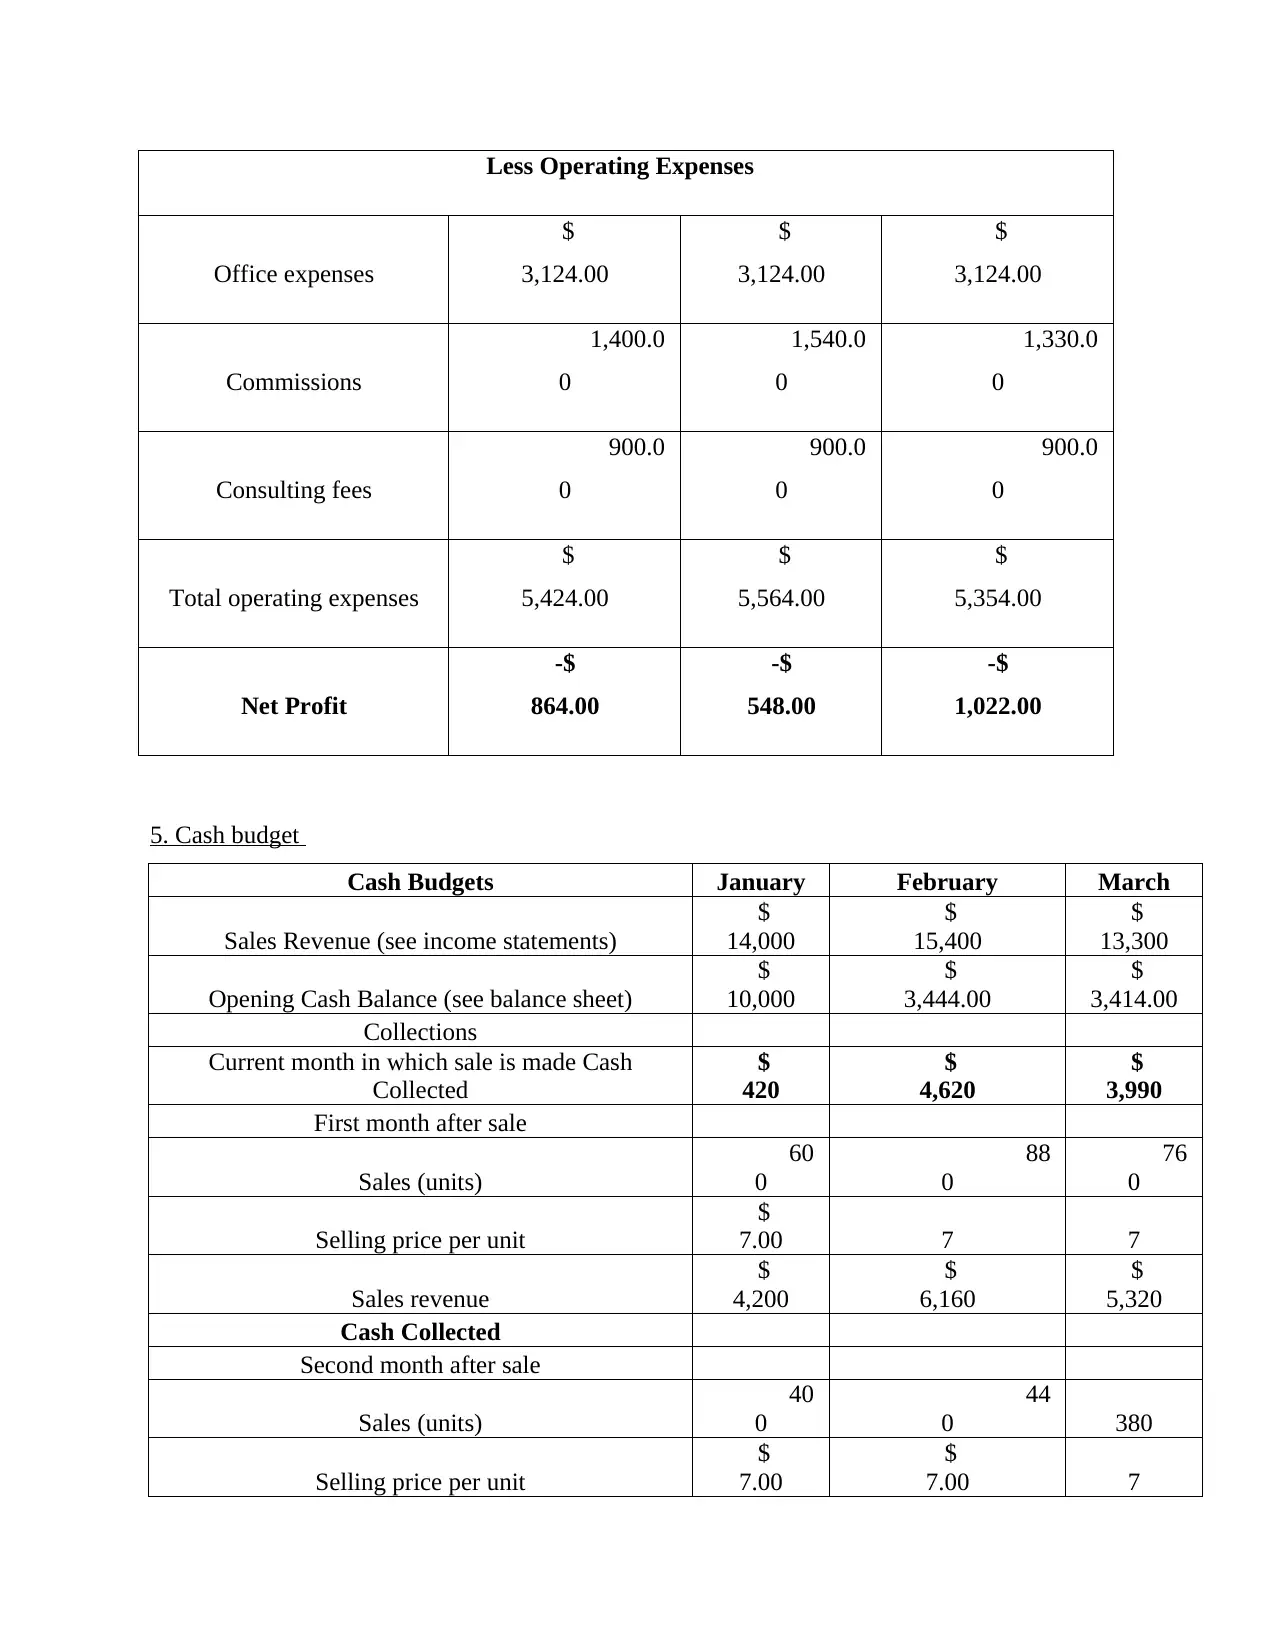
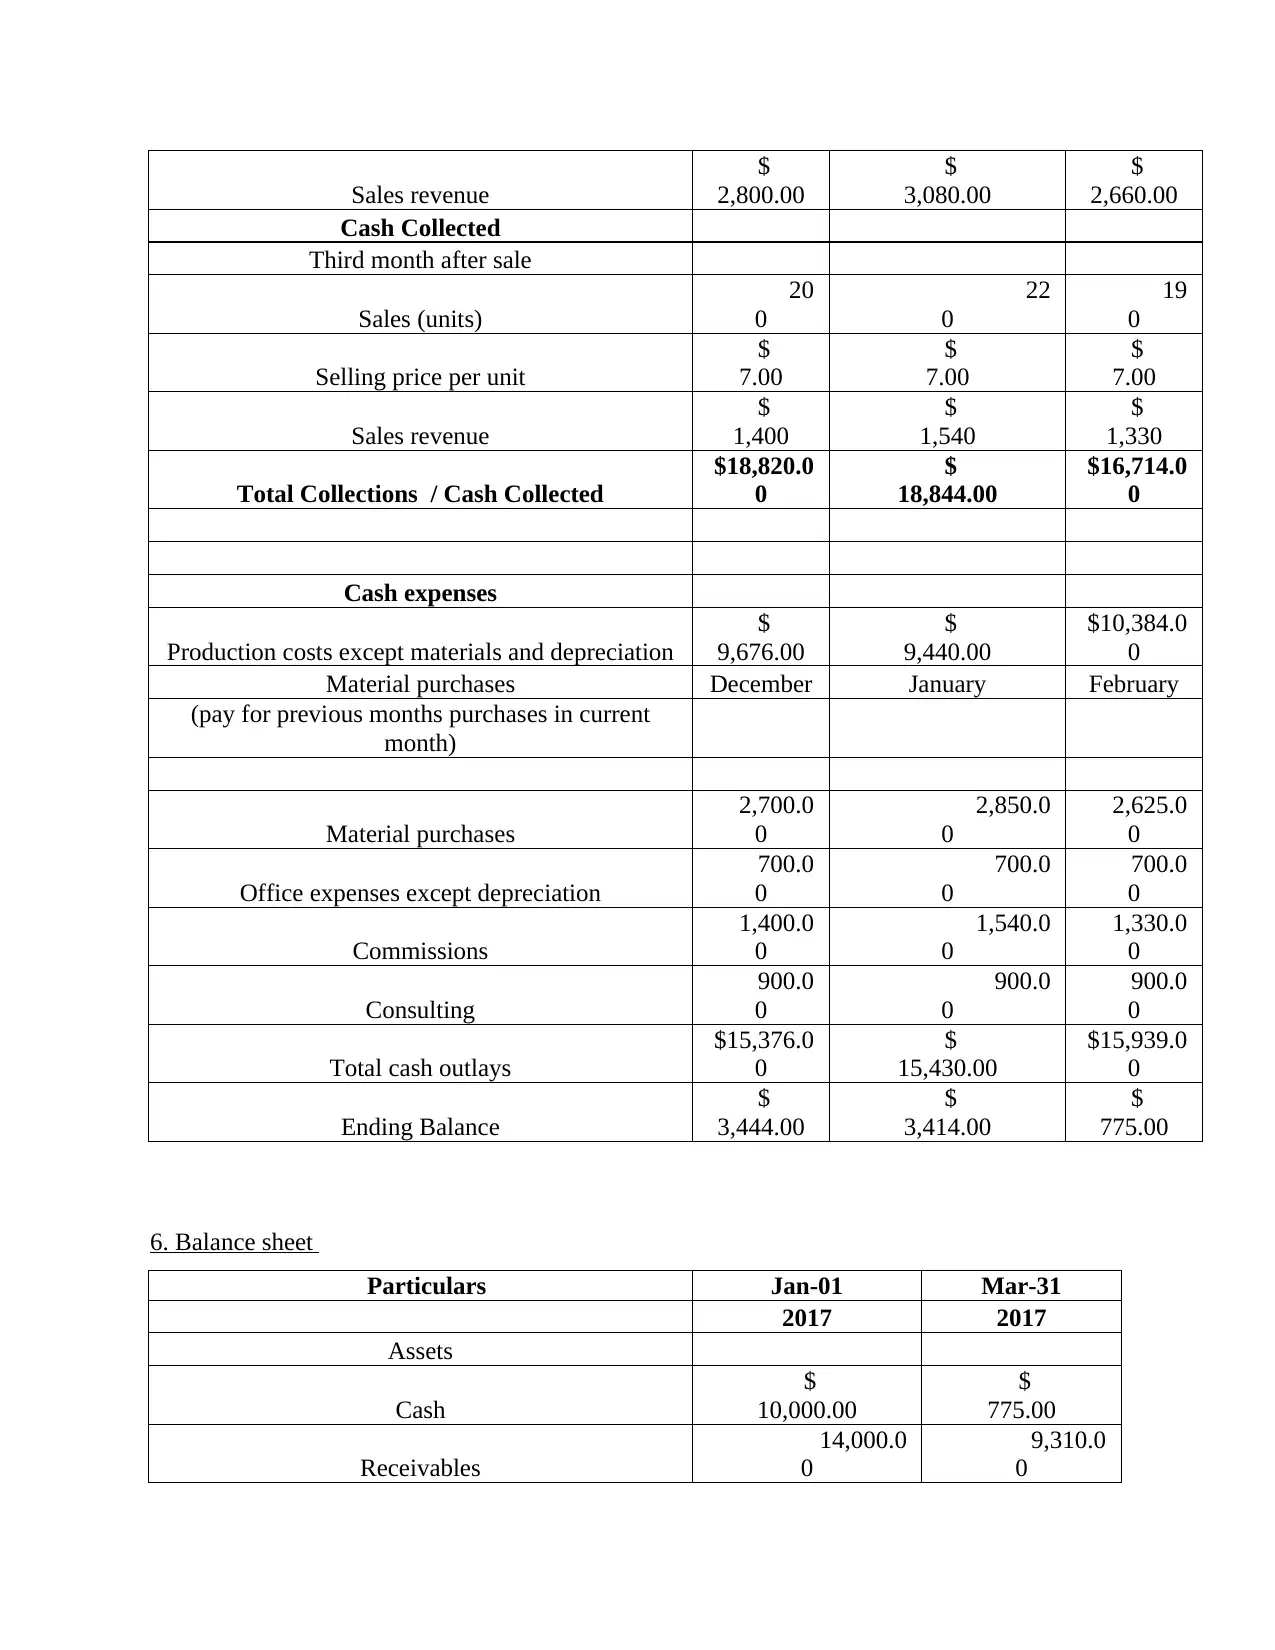
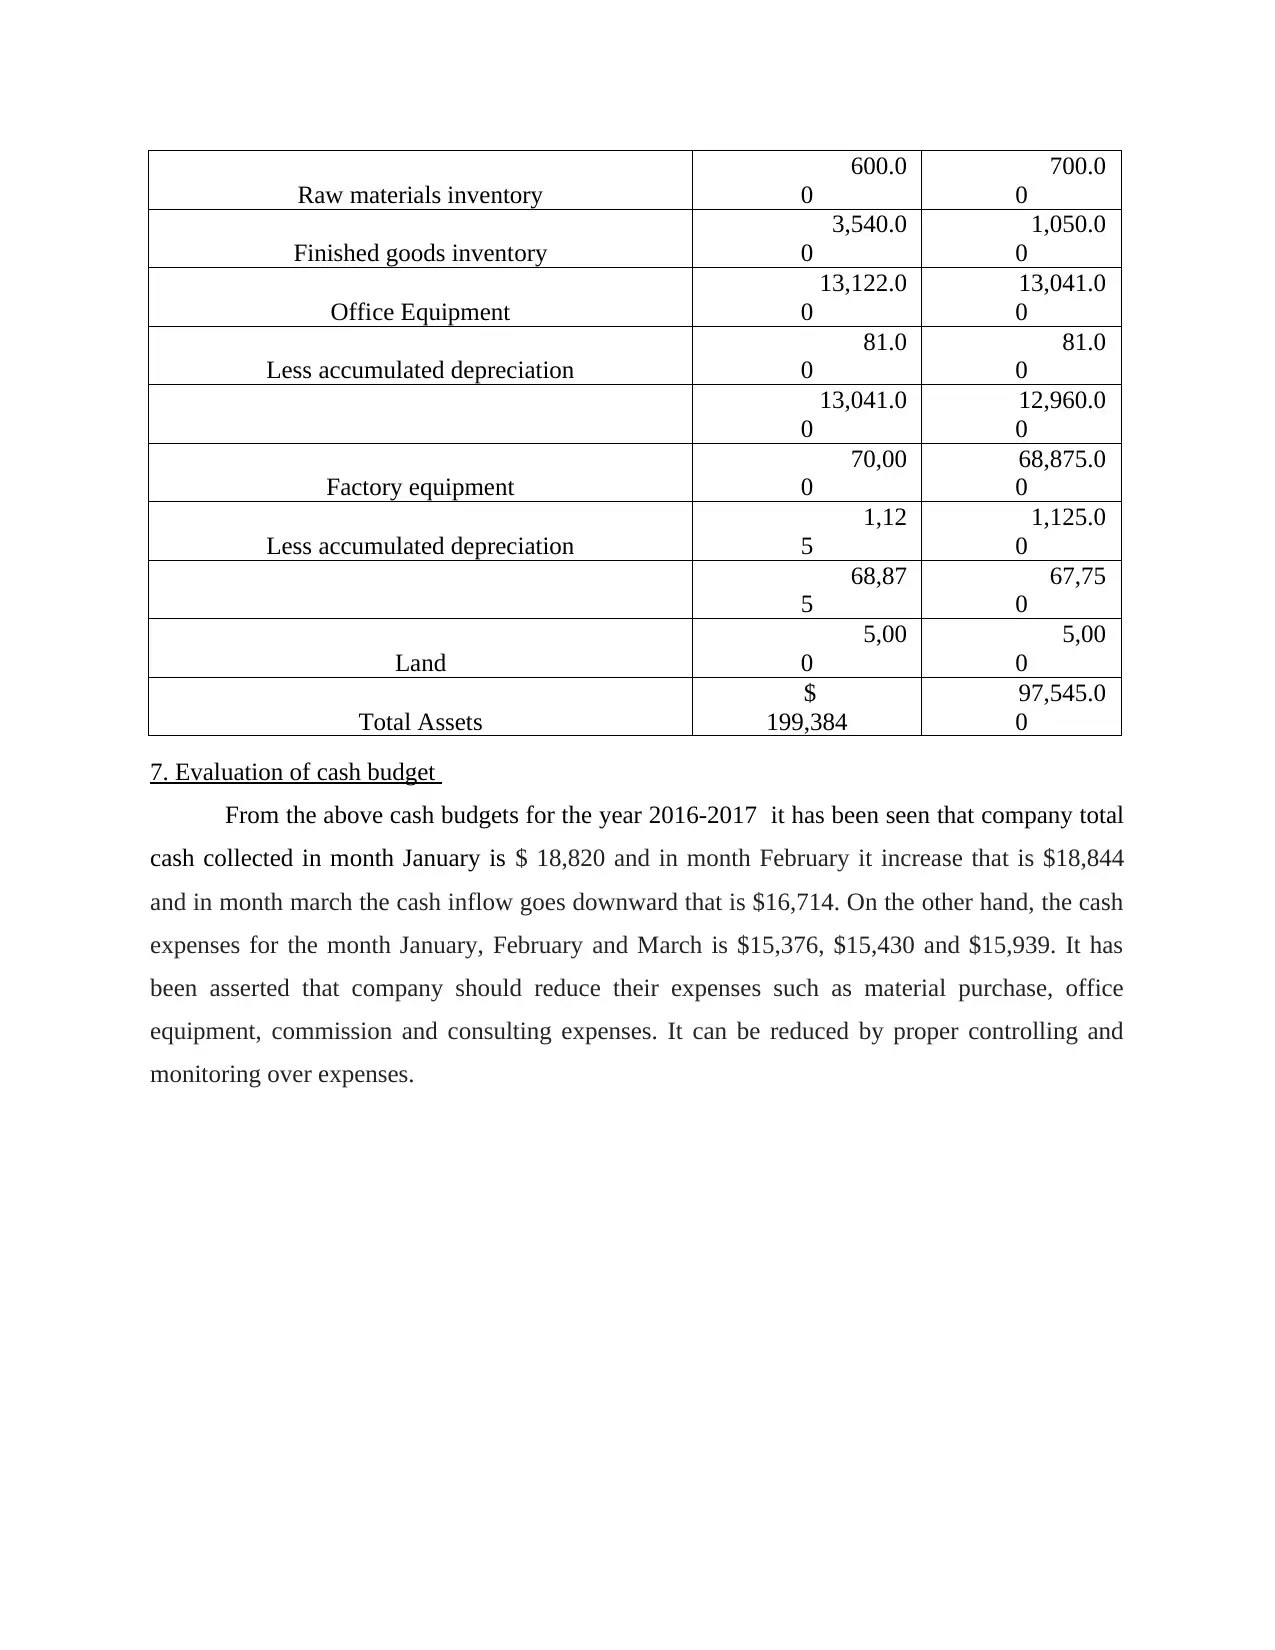
This management accounting assignment presents a comprehensive analysis of a company's financial performance from January to March 2017. It includes a detailed production budget, outlining production schedules and unit requirements. A schedule of raw material use and purchases is provided, along with a cost of production analysis, utilizing a flexed budget approach. The assignment further incorporates an income statement, cash budget, and balance sheet, offering a holistic view of the company's financial position. The cash budget is evaluated, and the document concludes with recommendations for expense reduction. The assignment covers key aspects of management accounting, providing valuable insights into budgeting, financial statement analysis, and cost management.

Management Accounting
Paraphrase This Document
Need a fresh take? Get an instant paraphrase of this document with our AI Paraphraser

Table of Contents
ASSIGNMENT................................................................................................................................3
1. Production budget....................................................................................................................3
2. Schedule of raw material use and purchase from January to March 2017 is enumerated
below:..........................................................................................................................................3
3. Cost of Production Flexed budget...........................................................................................4
4. Income statement.....................................................................................................................5
5. Cash budget.............................................................................................................................6
6. Balance sheet...........................................................................................................................7
7. Evaluation of cash budget........................................................................................................8

ASSIGNMENT
1. Production budget
Production
Schedule
Particulars Beginnin
g
Balance
units
Productio
n
units
Total
Units
Require
d
Sales
units
Ending
Balance
50% of next month
sales
December 2016
January 2017 750 2,350 3,100
2,00
0 1,100
February 2017 1,100 2,050 3,150
2,20
0 950
March 2017 950 2,000 2,950
1,90
0 1,050
April 2017 1,050 2,200 3,250
2,10
0 1,150
2. Schedule of raw material use and purchase from January to March 2017 is enumerated below:
Beginning balance - see balance
sheet and it is given
⊘ This is a preview!⊘
Do you want full access?
Subscribe today to unlock all pages.

Trusted by 1+ million students worldwide

Units of Raw Materials Purchased
Beginn
ing
Balanc
e
Endi
ng
Bala
nce
units
usa
ge
unit
s
Purcha
ses
units
Production
needs
Total
needs
units
December 2016
January 2017 800 700
2,3
50 2,250 2,350 3,050
February 2017 700 700
2,0
50 2,050 2,050 2,750
March 2017 700 700
2,0
00 2,000 2,000 2,700
3. Cost of Production Flexed budget
Cost of Production and Flexible Budget January February March
Projected number of units produced
2,35
0
2,05
0
2,00
0
Cost item
Variable Costs
Direct materials cost per unit
$
1,500.00
$
1,650.00
$
1,425.00
Direct labour cost per unit
2,500.0
0
2,750.0
0
2,375.0
0
Variable overhead
Indirect labour cost per unit
400.0
0
440.0
0
380.0
0
Electricity cost per unit
200.0
0
220.0
0
190.0
0
Other overhead cost per unit produced
1,000.0
0
1,100.0
0
950.0
0
Paraphrase This Document
Need a fresh take? Get an instant paraphrase of this document with our AI Paraphraser

Total variable costs
$
5,600.00
$
6,160.00
$
5,320.00
Fixed costs
Indirect labor per month - Fixed cost
400.0
0
400.0
0
400.0
0
Indirect materials per month - Fixed cost
1,200.0
0
1,200.0
0
1,200.0
0
Electricity cost per month - Fixed cost
300.0
0
300.0
0
300.0
0
Factory insurance per month - Fixed cost
500.0
0
500.0
0
500.0
0
Other overhead per month - Fixed cost
440.0
0
440.0
0
440.0
0
Depreciation
1,125.0
0
1,125.0
0
1,125.0
0
Total fixed costs
$
3,965.00
$
3,965.00
$
3,965.00
Total costs
$
9,565.00
$
10,125.00
$
9,285.00
Cost per unit
$
4.07
$
4.94
$
4.64
4. Income statement
Particulars / Month January (in $) February (in $) March (in $)
Units sold
2,00
0
2,20
0
1,90
0
Selling price per unit
$
7.00
$
7.00
$
7.00
Sales revenue
$
14,000
$
15,400
$
13,300
Less cost of goods sold
9,440.0
0
10,384.0
0
8,968.0
0
Gross Margin
$
4,560.00
$
5,016.00
$
4,332.00
$
5,600.00
$
6,160.00
$
5,320.00
Fixed costs
Indirect labor per month - Fixed cost
400.0
0
400.0
0
400.0
0
Indirect materials per month - Fixed cost
1,200.0
0
1,200.0
0
1,200.0
0
Electricity cost per month - Fixed cost
300.0
0
300.0
0
300.0
0
Factory insurance per month - Fixed cost
500.0
0
500.0
0
500.0
0
Other overhead per month - Fixed cost
440.0
0
440.0
0
440.0
0
Depreciation
1,125.0
0
1,125.0
0
1,125.0
0
Total fixed costs
$
3,965.00
$
3,965.00
$
3,965.00
Total costs
$
9,565.00
$
10,125.00
$
9,285.00
Cost per unit
$
4.07
$
4.94
$
4.64
4. Income statement
Particulars / Month January (in $) February (in $) March (in $)
Units sold
2,00
0
2,20
0
1,90
0
Selling price per unit
$
7.00
$
7.00
$
7.00
Sales revenue
$
14,000
$
15,400
$
13,300
Less cost of goods sold
9,440.0
0
10,384.0
0
8,968.0
0
Gross Margin
$
4,560.00
$
5,016.00
$
4,332.00

Less Operating Expenses
Office expenses
$
3,124.00
$
3,124.00
$
3,124.00
Commissions
1,400.0
0
1,540.0
0
1,330.0
0
Consulting fees
900.0
0
900.0
0
900.0
0
Total operating expenses
$
5,424.00
$
5,564.00
$
5,354.00
Net Profit
-$
864.00
-$
548.00
-$
1,022.00
5. Cash budget
Cash Budgets January February March
Sales Revenue (see income statements)
$
14,000
$
15,400
$
13,300
Opening Cash Balance (see balance sheet)
$
10,000
$
3,444.00
$
3,414.00
Collections
Current month in which sale is made Cash
Collected
$
420
$
4,620
$
3,990
First month after sale
Sales (units)
60
0
88
0
76
0
Selling price per unit
$
7.00 7 7
Sales revenue
$
4,200
$
6,160
$
5,320
Cash Collected
Second month after sale
Sales (units)
40
0
44
0 380
Selling price per unit
$
7.00
$
7.00 7
⊘ This is a preview!⊘
Do you want full access?
Subscribe today to unlock all pages.

Trusted by 1+ million students worldwide

Sales revenue
$
2,800.00
$
3,080.00
$
2,660.00
Cash Collected
Third month after sale
Sales (units)
20
0
22
0
19
0
Selling price per unit
$
7.00
$
7.00
$
7.00
Sales revenue
$
1,400
$
1,540
$
1,330
Total Collections / Cash Collected
$18,820.0
0
$
18,844.00
$16,714.0
0
Cash expenses
Production costs except materials and depreciation
$
9,676.00
$
9,440.00
$10,384.0
0
Material purchases December January February
(pay for previous months purchases in current
month)
Material purchases
2,700.0
0
2,850.0
0
2,625.0
0
Office expenses except depreciation
700.0
0
700.0
0
700.0
0
Commissions
1,400.0
0
1,540.0
0
1,330.0
0
Consulting
900.0
0
900.0
0
900.0
0
Total cash outlays
$15,376.0
0
$
15,430.00
$15,939.0
0
Ending Balance
$
3,444.00
$
3,414.00
$
775.00
6. Balance sheet
Particulars Jan-01 Mar-31
2017 2017
Assets
Cash
$
10,000.00
$
775.00
Receivables
14,000.0
0
9,310.0
0
$
2,800.00
$
3,080.00
$
2,660.00
Cash Collected
Third month after sale
Sales (units)
20
0
22
0
19
0
Selling price per unit
$
7.00
$
7.00
$
7.00
Sales revenue
$
1,400
$
1,540
$
1,330
Total Collections / Cash Collected
$18,820.0
0
$
18,844.00
$16,714.0
0
Cash expenses
Production costs except materials and depreciation
$
9,676.00
$
9,440.00
$10,384.0
0
Material purchases December January February
(pay for previous months purchases in current
month)
Material purchases
2,700.0
0
2,850.0
0
2,625.0
0
Office expenses except depreciation
700.0
0
700.0
0
700.0
0
Commissions
1,400.0
0
1,540.0
0
1,330.0
0
Consulting
900.0
0
900.0
0
900.0
0
Total cash outlays
$15,376.0
0
$
15,430.00
$15,939.0
0
Ending Balance
$
3,444.00
$
3,414.00
$
775.00
6. Balance sheet
Particulars Jan-01 Mar-31
2017 2017
Assets
Cash
$
10,000.00
$
775.00
Receivables
14,000.0
0
9,310.0
0
Paraphrase This Document
Need a fresh take? Get an instant paraphrase of this document with our AI Paraphraser

Raw materials inventory
600.0
0
700.0
0
Finished goods inventory
3,540.0
0
1,050.0
0
Office Equipment
13,122.0
0
13,041.0
0
Less accumulated depreciation
81.0
0
81.0
0
13,041.0
0
12,960.0
0
Factory equipment
70,00
0
68,875.0
0
Less accumulated depreciation
1,12
5
1,125.0
0
68,87
5
67,75
0
Land
5,00
0
5,00
0
Total Assets
$
199,384
97,545.0
0
7. Evaluation of cash budget
From the above cash budgets for the year 2016-2017 it has been seen that company total
cash collected in month January is $ 18,820 and in month February it increase that is $18,844
and in month march the cash inflow goes downward that is $16,714. On the other hand, the cash
expenses for the month January, February and March is $15,376, $15,430 and $15,939. It has
been asserted that company should reduce their expenses such as material purchase, office
equipment, commission and consulting expenses. It can be reduced by proper controlling and
monitoring over expenses.
1 out of 8

Your All-in-One AI-Powered Toolkit for Academic Success.
 +13062052269
info@desklib.com
Available 24*7 on WhatsApp / Email
Unlock your academic potential
Copyright © 2020–2025 A2Z Services. All Rights Reserved. Developed and managed by ZUCOL.