Management Accounting Assignment: Value Chain & Budgeting
VerifiedAdded on 2022/12/28
|16
|3320
|24
Homework Assignment
AI Summary
This assignment delves into the core principles of management accounting, focusing on value chain analysis and budgeting techniques. The first part of the assignment examines the value chain concept within the context of Sydney Ferries, an Australian transportation service, analyzing its competitive strategies such as cost leadership and differentiation. It identifies the key stages of the value chain, including inbound and outbound logistics, and marketing. The second part focuses on Takulah company, preparing a comprehensive master budget for the third quarter ending September. This includes sales, production, direct materials, direct labor, manufacturing overhead, finished goods inventory, and selling and administrative expenses budgets. The assignment also covers expected cash collections, providing a detailed overview of planning and controlling business operations through financial forecasting and analysis.
MANAGEMENT
ACCOUNTING BACHELOR
OF PROFESSIONAL
ACCOUNTING
ACCOUNTING BACHELOR
OF PROFESSIONAL
ACCOUNTING
Paraphrase This Document
Need a fresh take? Get an instant paraphrase of this document with our AI Paraphraser
Table of Contents
INTRODUCTION...........................................................................................................................3
MAIN BODY...................................................................................................................................3
Question: 1...................................................................................................................................3
Question: 2...................................................................................................................................6
CONCLUSION..............................................................................................................................13
REFERENCES............................................................................................................................1
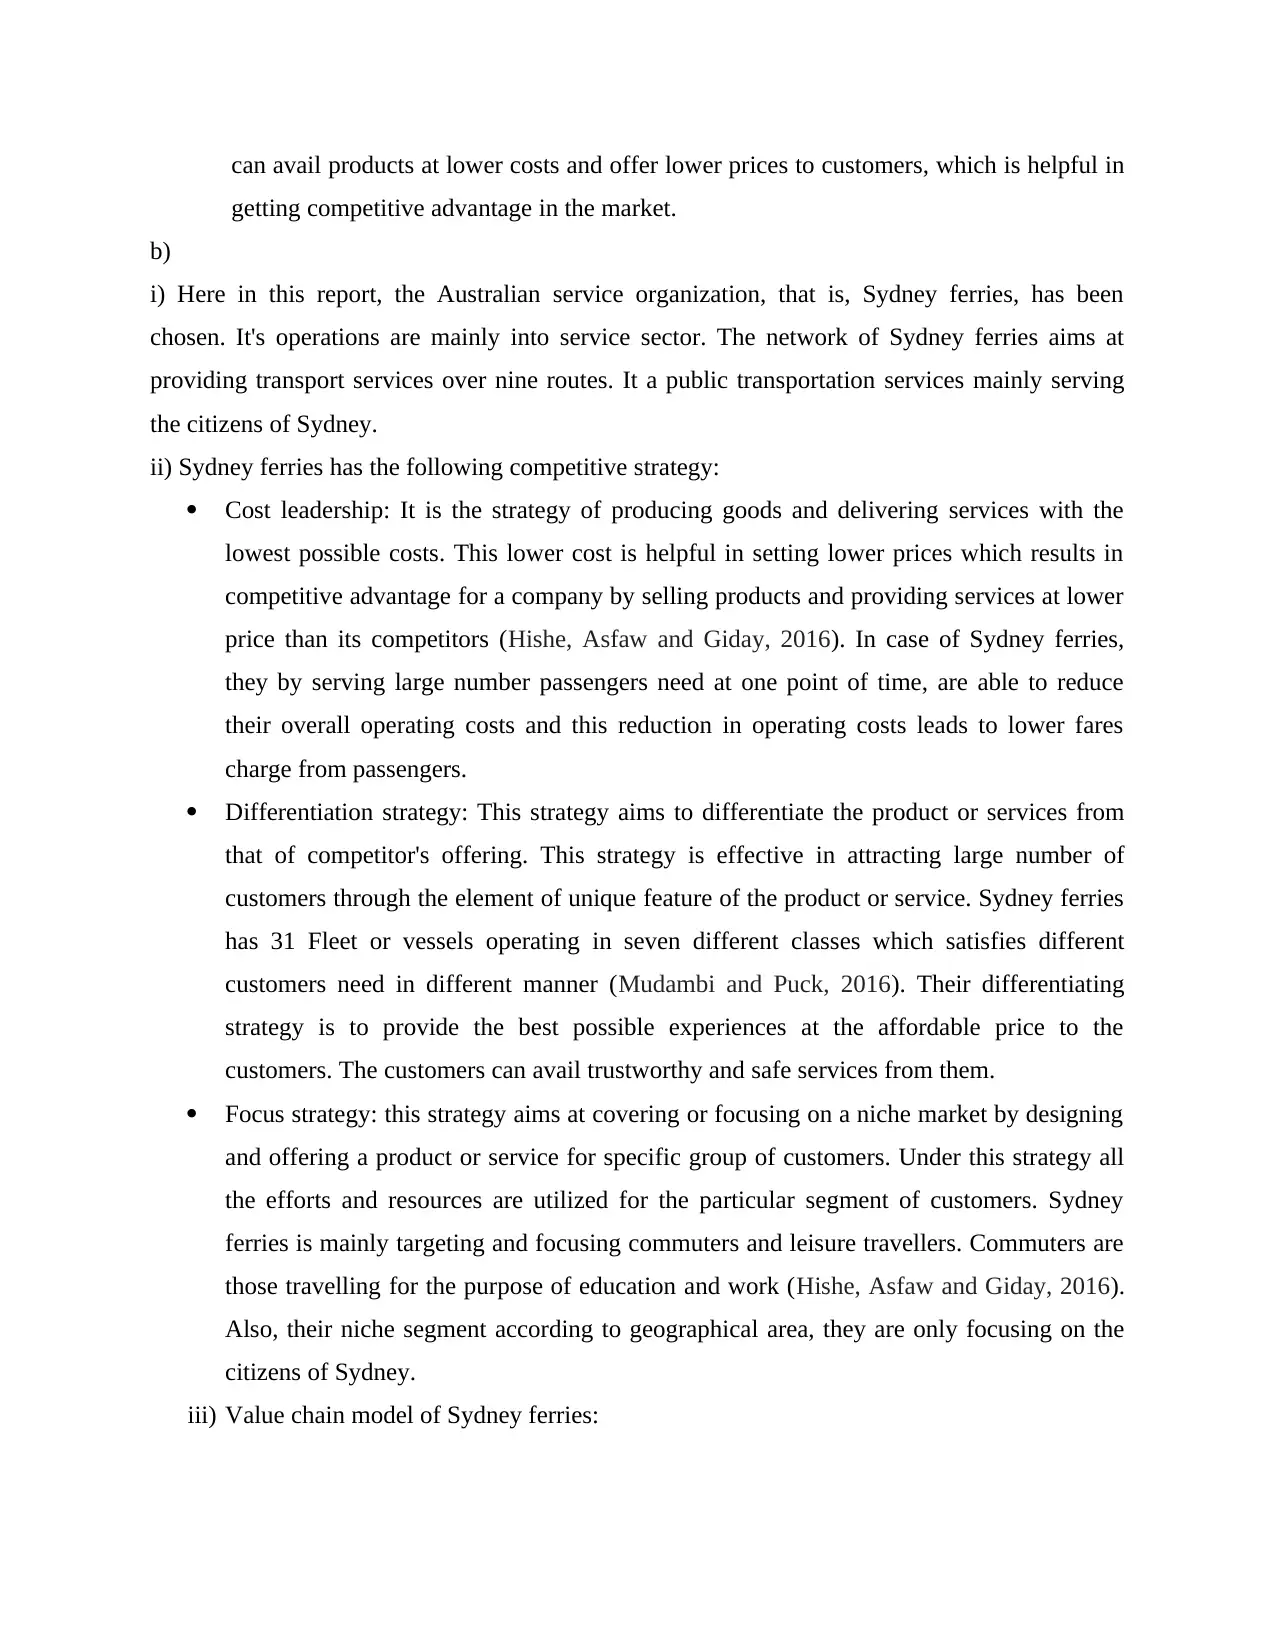
INTRODUCTION
The concept of management accounting refers to the responsibilities of management accountant,
which involves planning and controlling business activities and then making wise decisions for
efficiently and effectively achieving the organizational goals (Schwartz, 2016). Management
accounting is one of the division of accounting which involves measurement, analysing,
interpretation and informing managers about business status to the concerned managers with the
help of preparation of various budgets and reports relation to various business activity. The
present report has two parts where first part is based on value chain concept with reference to
Australian service organization, that is, Sydney ferries which is an Australian based
transportation service network. The second part of this report is based on budget preparation for
the third quarter ending 30th September for Takulah company in order to plan and control their
business operations.
MAIN BODY
Question: 1
a) Value chain is an important concept in every manufacturing and service organization which
indicated a comprehensive range of activities that is being performed for producing a unit of
product or delivering service (Zamora, 2016). It is referred to as value chain because the set of
activities so undertaken are meant for adding value to the product or service. By performing each
and every activity of the value chain, a producer can enhance its product's value. As per Michael
Porter's value chain analysis, there are five stages in value creating chain, that is, inbound
logistics, operational activities, outbound logistics, sales and marketing activities and after sale
service.
Benefits of value chain
With the help of value chain, the overall production activities can be bifurcated into
various stages which helps in saving costs by identifying the most expensive activities of
producing products and services and taking steps for minimizing these costly affairs.
Through value chain, a producer can minimize wasteful activities and enhance
profitability by looking into its supply chain, and identifying ways for minimizing
wastages in order to achieve efficiency (Jaligot and et.al., 2016).
For example, when a company recognizes that their subsidiary can produce a product at
lower costs, then they may go for outsourcing the product to its subsidiary, where they
⊘ This is a preview!⊘
Do you want full access?
Subscribe today to unlock all pages.
Trusted by 1+ million students worldwide
can avail products at lower costs and offer lower prices to customers, which is helpful in
getting competitive advantage in the market.
b)
i) Here in this report, the Australian service organization, that is, Sydney ferries, has been
chosen. It's operations are mainly into service sector. The network of Sydney ferries aims at
providing transport services over nine routes. It a public transportation services mainly serving
the citizens of Sydney.
ii) Sydney ferries has the following competitive strategy:
Cost leadership: It is the strategy of producing goods and delivering services with the
lowest possible costs. This lower cost is helpful in setting lower prices which results in
competitive advantage for a company by selling products and providing services at lower
price than its competitors (Hishe, Asfaw and Giday, 2016). In case of Sydney ferries,
they by serving large number passengers need at one point of time, are able to reduce
their overall operating costs and this reduction in operating costs leads to lower fares
charge from passengers.
Differentiation strategy: This strategy aims to differentiate the product or services from
that of competitor's offering. This strategy is effective in attracting large number of
customers through the element of unique feature of the product or service. Sydney ferries
has 31 Fleet or vessels operating in seven different classes which satisfies different
customers need in different manner (Mudambi and Puck, 2016). Their differentiating
strategy is to provide the best possible experiences at the affordable price to the
customers. The customers can avail trustworthy and safe services from them.
Focus strategy: this strategy aims at covering or focusing on a niche market by designing
and offering a product or service for specific group of customers. Under this strategy all
the efforts and resources are utilized for the particular segment of customers. Sydney
ferries is mainly targeting and focusing commuters and leisure travellers. Commuters are
those travelling for the purpose of education and work (Hishe, Asfaw and Giday, 2016).
Also, their niche segment according to geographical area, they are only focusing on the
citizens of Sydney.
iii) Value chain model of Sydney ferries:
Paraphrase This Document
Need a fresh take? Get an instant paraphrase of this document with our AI Paraphraser
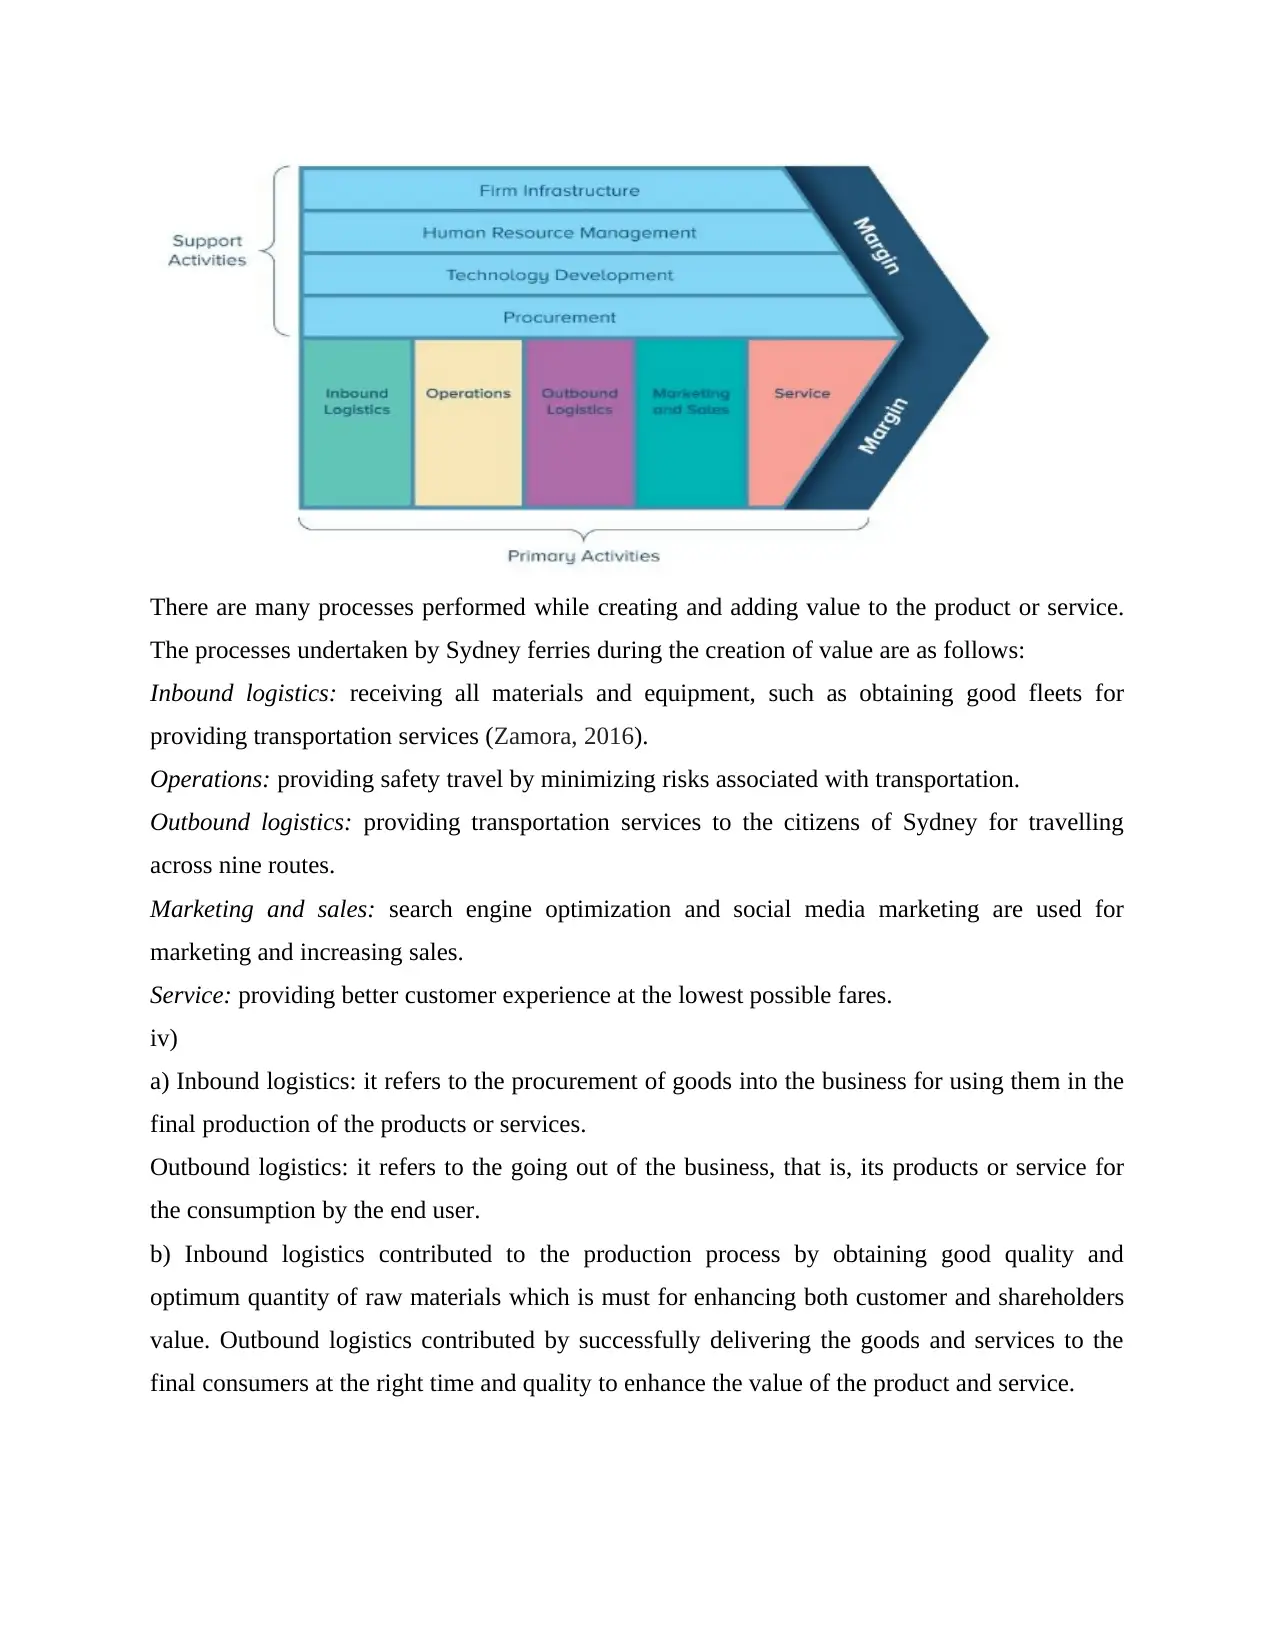
There are many processes performed while creating and adding value to the product or service.
The processes undertaken by Sydney ferries during the creation of value are as follows:
Inbound logistics: receiving all materials and equipment, such as obtaining good fleets for
providing transportation services (Zamora, 2016).
Operations: providing safety travel by minimizing risks associated with transportation.
Outbound logistics: providing transportation services to the citizens of Sydney for travelling
across nine routes.
Marketing and sales: search engine optimization and social media marketing are used for
marketing and increasing sales.
Service: providing better customer experience at the lowest possible fares.
iv)
a) Inbound logistics: it refers to the procurement of goods into the business for using them in the
final production of the products or services.
Outbound logistics: it refers to the going out of the business, that is, its products or service for
the consumption by the end user.
b) Inbound logistics contributed to the production process by obtaining good quality and
optimum quantity of raw materials which is must for enhancing both customer and shareholders
value. Outbound logistics contributed by successfully delivering the goods and services to the
final consumers at the right time and quality to enhance the value of the product and service.
c) For inbound logistics, direct material budget is prepared on a monthly or quarterly basis and
submitted to finance manager while for outbound logistics, selling and distribution budget is
prepared on a quarterly basis and submitted to marketing manager.
Question: 2
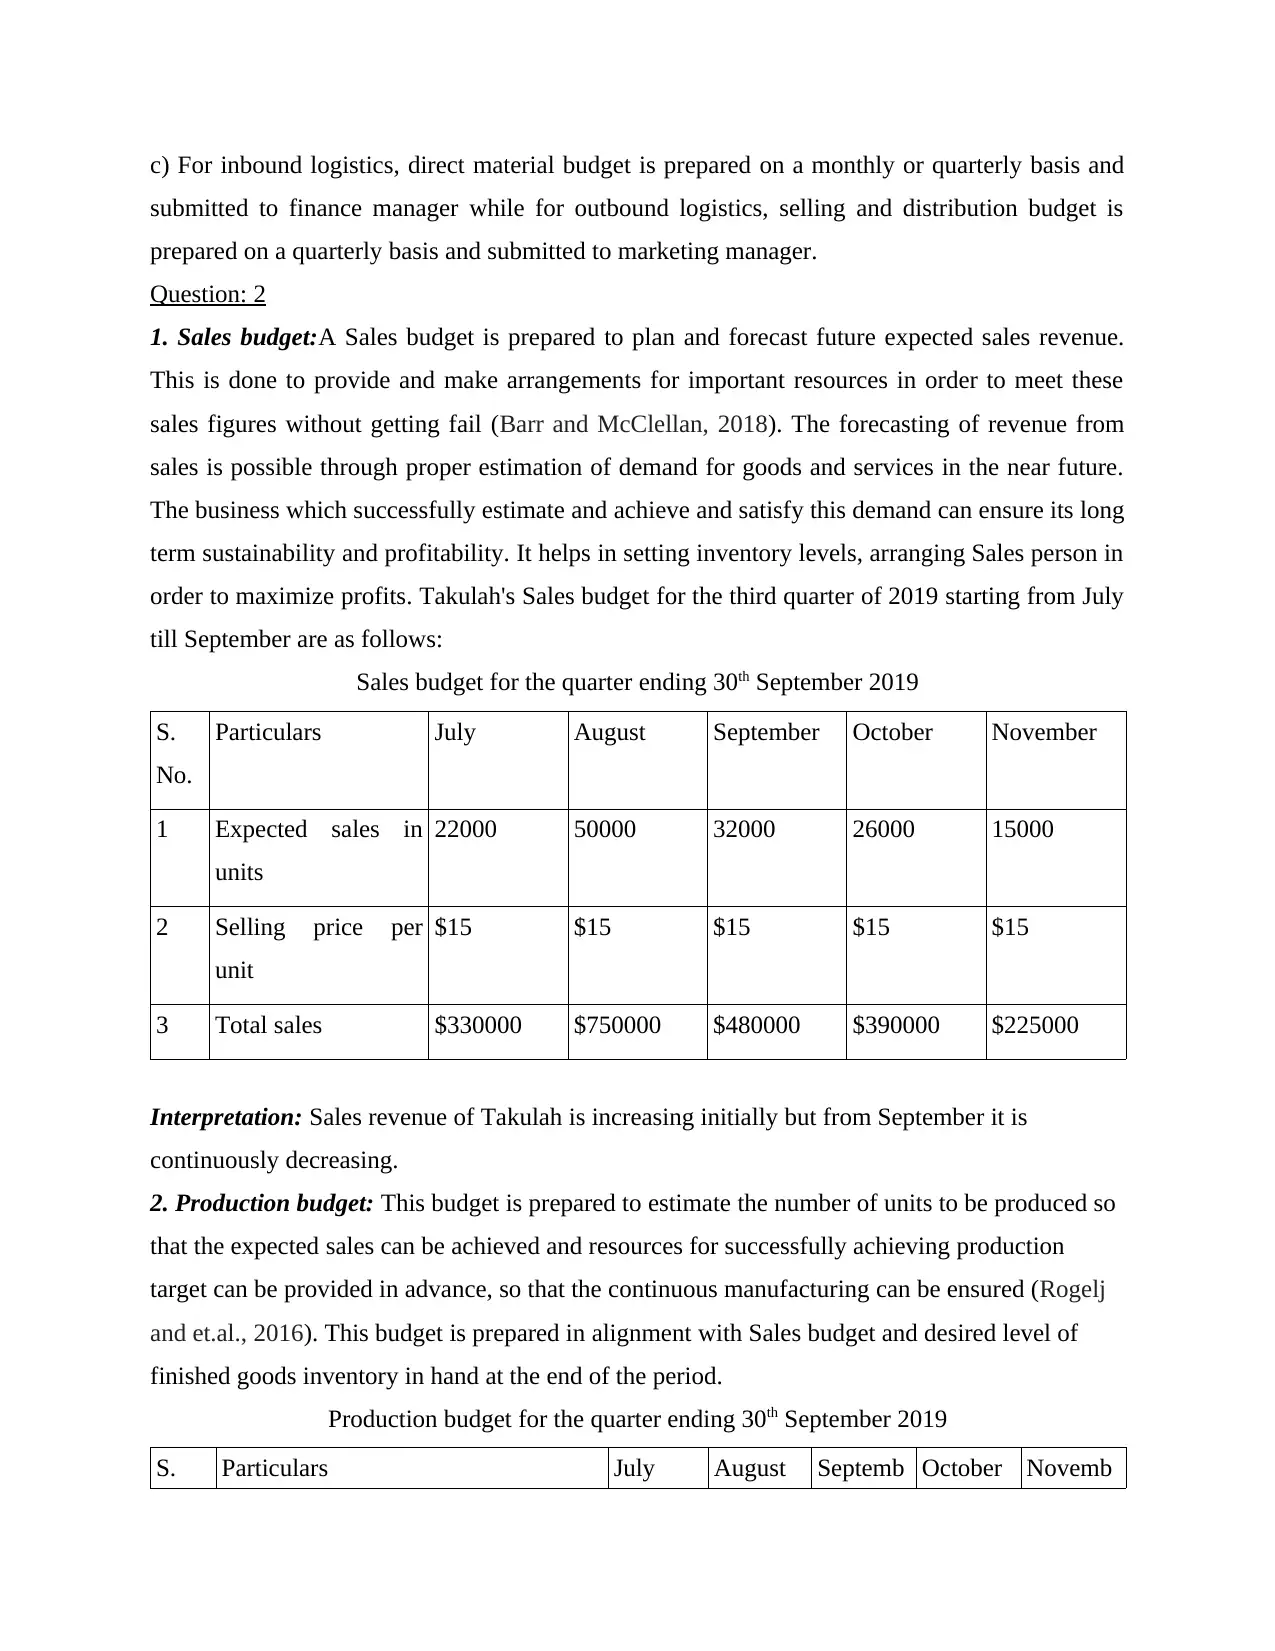
1. Sales budget:A Sales budget is prepared to plan and forecast future expected sales revenue.
This is done to provide and make arrangements for important resources in order to meet these
sales figures without getting fail (Barr and McClellan, 2018). The forecasting of revenue from
sales is possible through proper estimation of demand for goods and services in the near future.
The business which successfully estimate and achieve and satisfy this demand can ensure its long
term sustainability and profitability. It helps in setting inventory levels, arranging Sales person in
order to maximize profits. Takulah's Sales budget for the third quarter of 2019 starting from July
till September are as follows:
Sales budget for the quarter ending 30th September 2019
S.
No.
Particulars July August September October November
1 Expected sales in
units
22000 50000 32000 26000 15000
2 Selling price per
unit
$15 $15 $15 $15 $15
3 Total sales $330000 $750000 $480000 $390000 $225000
Interpretation: Sales revenue of Takulah is increasing initially but from September it is
continuously decreasing.
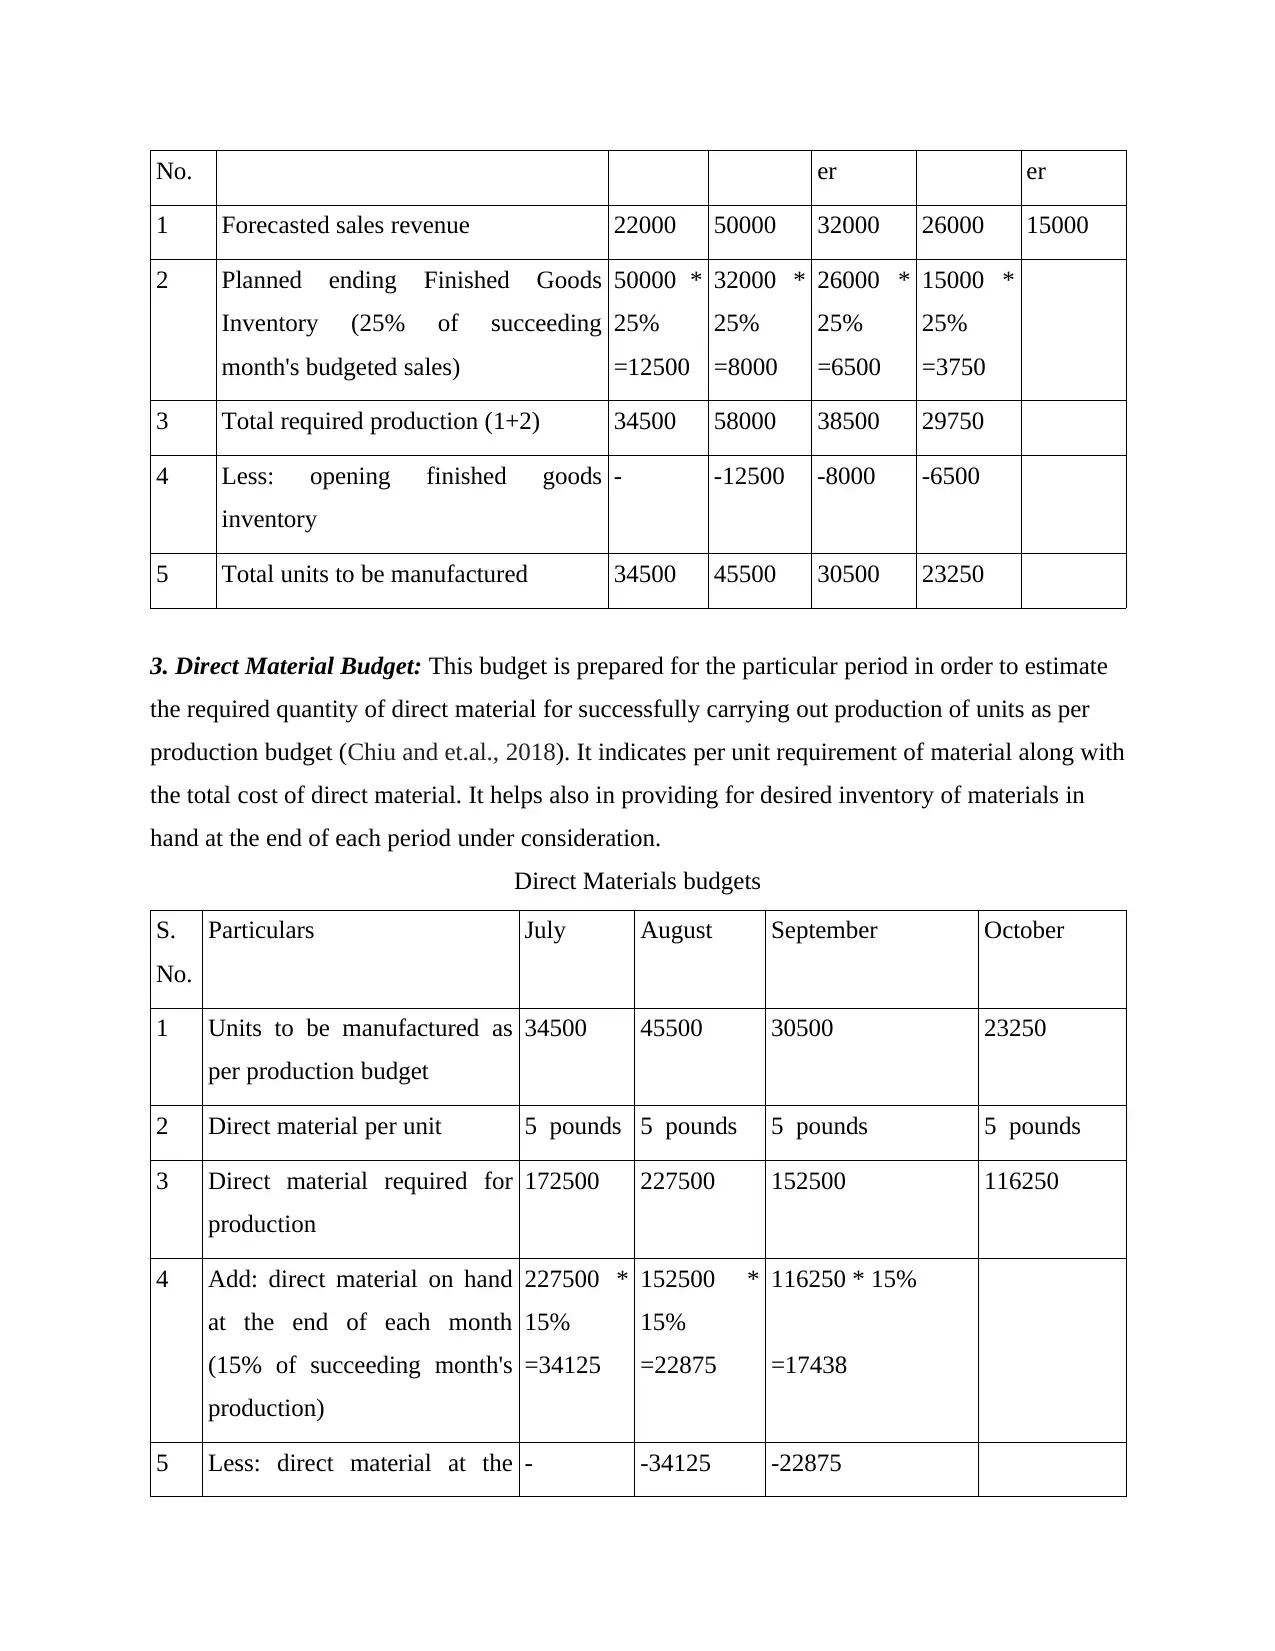
2. Production budget: This budget is prepared to estimate the number of units to be produced so
that the expected sales can be achieved and resources for successfully achieving production
target can be provided in advance, so that the continuous manufacturing can be ensured (Rogelj
and et.al., 2016). This budget is prepared in alignment with Sales budget and desired level of
finished goods inventory in hand at the end of the period.
Production budget for the quarter ending 30th September 2019
S. Particulars July August Septemb October Novemb
submitted to finance manager while for outbound logistics, selling and distribution budget is
prepared on a quarterly basis and submitted to marketing manager.
Question: 2
1. Sales budget:A Sales budget is prepared to plan and forecast future expected sales revenue.
This is done to provide and make arrangements for important resources in order to meet these
sales figures without getting fail (Barr and McClellan, 2018). The forecasting of revenue from
sales is possible through proper estimation of demand for goods and services in the near future.
The business which successfully estimate and achieve and satisfy this demand can ensure its long
term sustainability and profitability. It helps in setting inventory levels, arranging Sales person in
order to maximize profits. Takulah's Sales budget for the third quarter of 2019 starting from July
till September are as follows:
Sales budget for the quarter ending 30th September 2019
S.
No.
Particulars July August September October November
1 Expected sales in
units
22000 50000 32000 26000 15000
2 Selling price per
unit
$15 $15 $15 $15 $15
3 Total sales $330000 $750000 $480000 $390000 $225000
Interpretation: Sales revenue of Takulah is increasing initially but from September it is
continuously decreasing.
2. Production budget: This budget is prepared to estimate the number of units to be produced so
that the expected sales can be achieved and resources for successfully achieving production
target can be provided in advance, so that the continuous manufacturing can be ensured (Rogelj
and et.al., 2016). This budget is prepared in alignment with Sales budget and desired level of
finished goods inventory in hand at the end of the period.
Production budget for the quarter ending 30th September 2019
S. Particulars July August Septemb October Novemb
⊘ This is a preview!⊘
Do you want full access?
Subscribe today to unlock all pages.
Trusted by 1+ million students worldwide
No. er er
1 Forecasted sales revenue 22000 50000 32000 26000 15000
2 Planned ending Finished Goods
Inventory (25% of succeeding
month's budgeted sales)
50000 *
25%
=12500
32000 *
25%
=8000
26000 *
25%
=6500
15000 *
25%
=3750
3 Total required production (1+2) 34500 58000 38500 29750
4 Less: opening finished goods
inventory
- -12500 -8000 -6500
5 Total units to be manufactured 34500 45500 30500 23250
3. Direct Material Budget: This budget is prepared for the particular period in order to estimate
the required quantity of direct material for successfully carrying out production of units as per
production budget (Chiu and et.al., 2018). It indicates per unit requirement of material along with
the total cost of direct material. It helps also in providing for desired inventory of materials in
hand at the end of each period under consideration.
Direct Materials budgets
S.
No.
Particulars July August September October
1 Units to be manufactured as
per production budget
34500 45500 30500 23250
2 Direct material per unit 5 pounds 5 pounds 5 pounds 5 pounds
3 Direct material required for
production
172500 227500 152500 116250
4 Add: direct material on hand
at the end of each month
(15% of succeeding month's
production)
227500 *
15%
=34125
152500 *
15%
=22875
116250 * 15%
=17438
5 Less: direct material at the - -34125 -22875
Paraphrase This Document
Need a fresh take? Get an instant paraphrase of this document with our AI Paraphraser
beginning of each month
6 Required purchase of direct
material in pounds (3+4-5)
206625 216250 147063
7 Material cost per pound $0.5 $0.5 $0.5
8 Total Direct material cost $103313 $108125 $73532
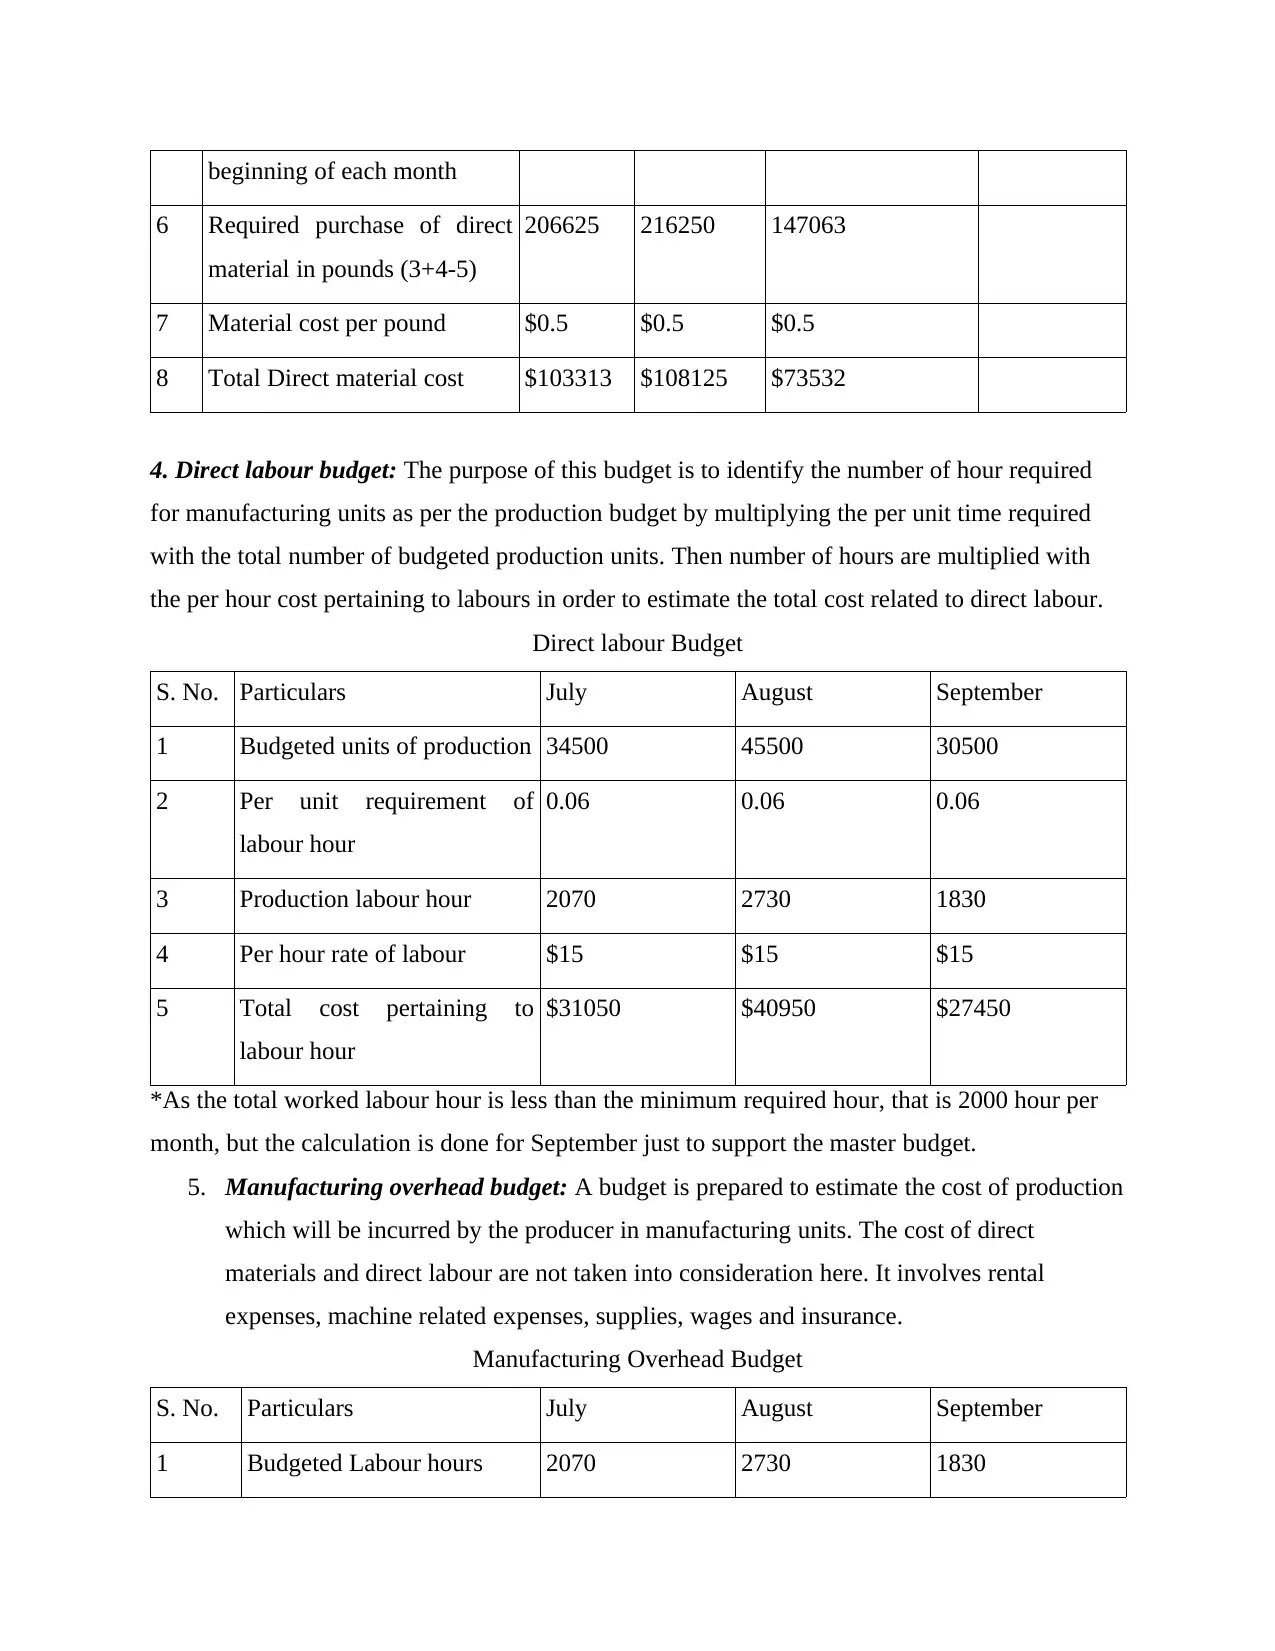
4. Direct labour budget: The purpose of this budget is to identify the number of hour required
for manufacturing units as per the production budget by multiplying the per unit time required
with the total number of budgeted production units. Then number of hours are multiplied with
the per hour cost pertaining to labours in order to estimate the total cost related to direct labour.
Direct labour Budget
S. No. Particulars July August September
1 Budgeted units of production 34500 45500 30500
2 Per unit requirement of
labour hour
0.06 0.06 0.06
3 Production labour hour 2070 2730 1830
4 Per hour rate of labour $15 $15 $15
5 Total cost pertaining to
labour hour
$31050 $40950 $27450
*As the total worked labour hour is less than the minimum required hour, that is 2000 hour per
month, but the calculation is done for September just to support the master budget.
5. Manufacturing overhead budget: A budget is prepared to estimate the cost of production
which will be incurred by the producer in manufacturing units. The cost of direct
materials and direct labour are not taken into consideration here. It involves rental
expenses, machine related expenses, supplies, wages and insurance.
Manufacturing Overhead Budget
S. No. Particulars July August September
1 Budgeted Labour hours 2070 2730 1830
6 Required purchase of direct
material in pounds (3+4-5)
206625 216250 147063
7 Material cost per pound $0.5 $0.5 $0.5
8 Total Direct material cost $103313 $108125 $73532
4. Direct labour budget: The purpose of this budget is to identify the number of hour required
for manufacturing units as per the production budget by multiplying the per unit time required
with the total number of budgeted production units. Then number of hours are multiplied with
the per hour cost pertaining to labours in order to estimate the total cost related to direct labour.
Direct labour Budget
S. No. Particulars July August September
1 Budgeted units of production 34500 45500 30500
2 Per unit requirement of
labour hour
0.06 0.06 0.06
3 Production labour hour 2070 2730 1830
4 Per hour rate of labour $15 $15 $15
5 Total cost pertaining to
labour hour
$31050 $40950 $27450
*As the total worked labour hour is less than the minimum required hour, that is 2000 hour per
month, but the calculation is done for September just to support the master budget.
5. Manufacturing overhead budget: A budget is prepared to estimate the cost of production
which will be incurred by the producer in manufacturing units. The cost of direct
materials and direct labour are not taken into consideration here. It involves rental
expenses, machine related expenses, supplies, wages and insurance.
Manufacturing Overhead Budget
S. No. Particulars July August September
1 Budgeted Labour hours 2070 2730 1830
2 Budgeted Variable
manufacturing overhead rate
$25 $25 $25
3 Total variable overhead $51750 $68250 $45750
4 Fixed overhead budgeted $40000 $40000 $40000
5 Total manufacturing
overhead
$91750 $108250 $85750
6 Overhead recovery rate 91750/34500
= $2.66
108250/45500
=$2.38
85750/30500
=$2.81
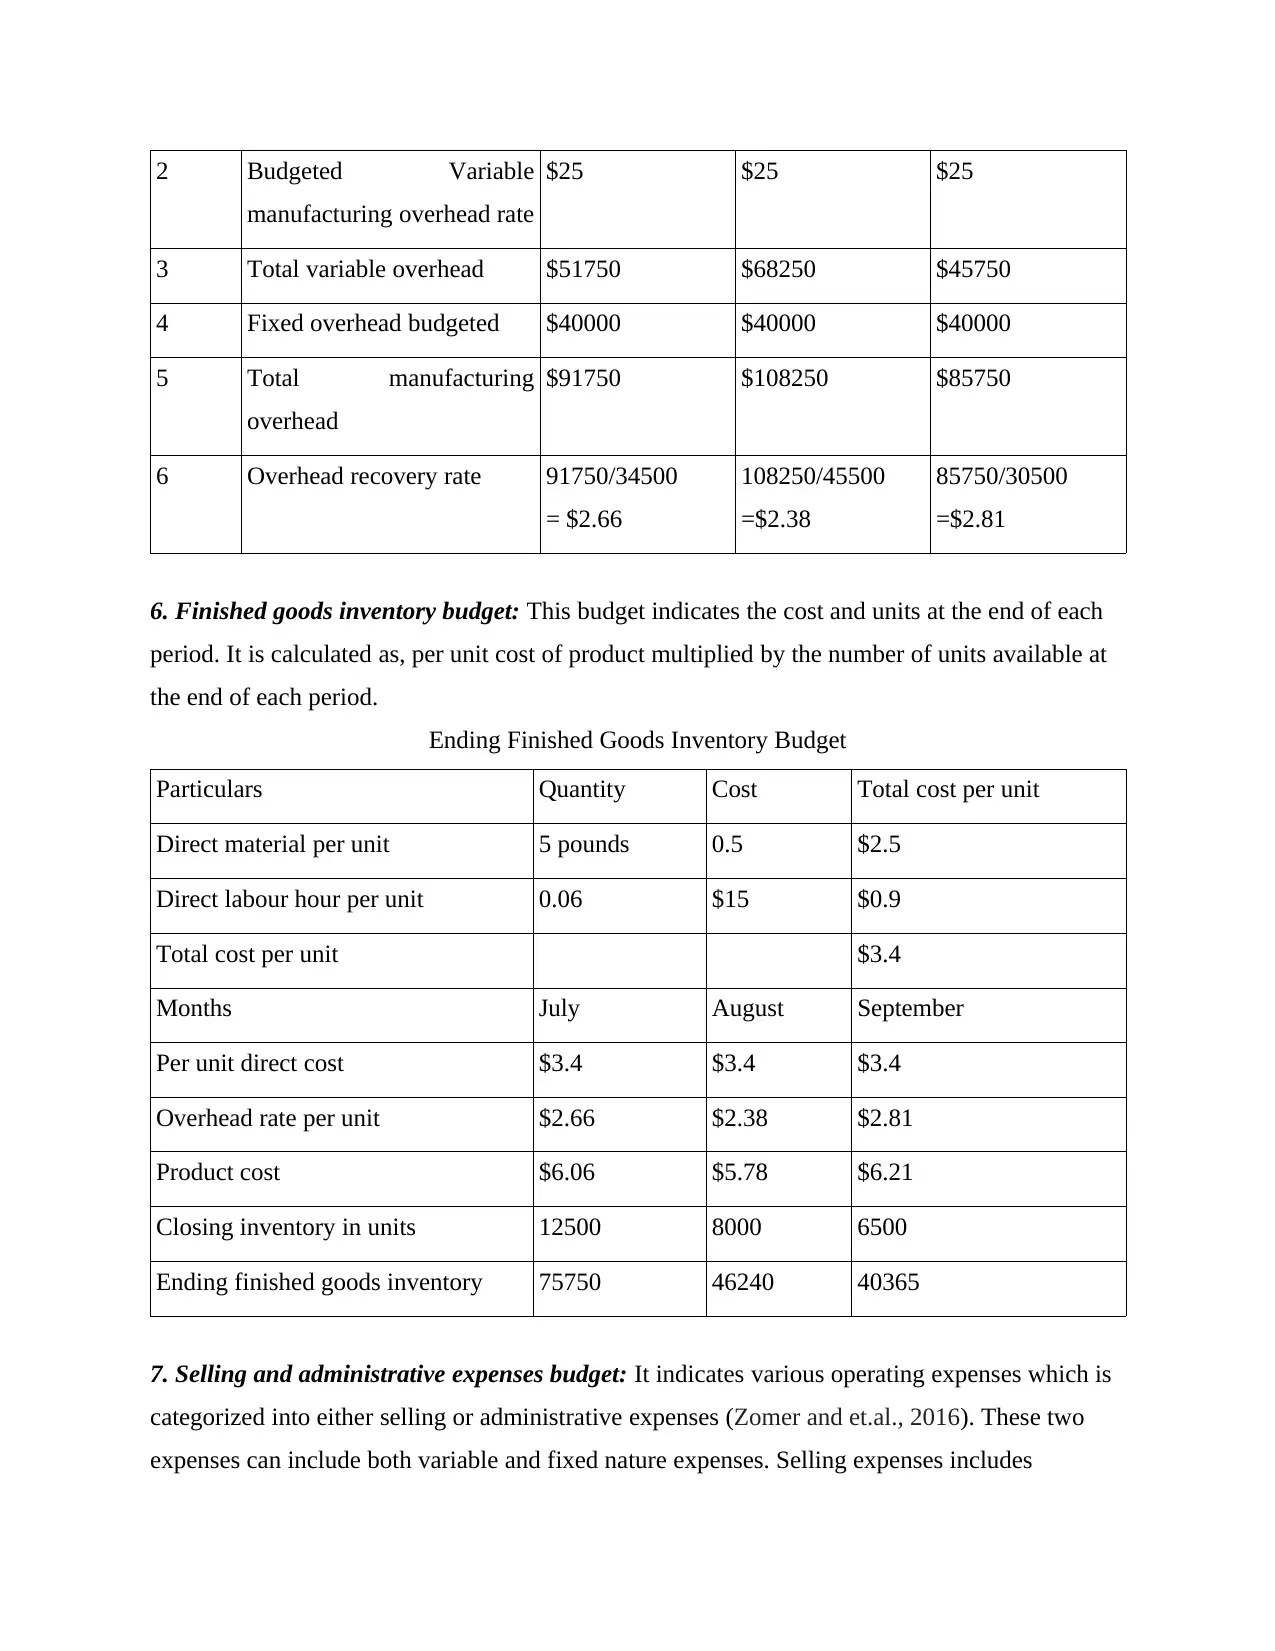
6. Finished goods inventory budget: This budget indicates the cost and units at the end of each
period. It is calculated as, per unit cost of product multiplied by the number of units available at
the end of each period.
Ending Finished Goods Inventory Budget
Particulars Quantity Cost Total cost per unit
Direct material per unit 5 pounds 0.5 $2.5
Direct labour hour per unit 0.06 $15 $0.9
Total cost per unit $3.4
Months July August September
Per unit direct cost $3.4 $3.4 $3.4
Overhead rate per unit $2.66 $2.38 $2.81
Product cost $6.06 $5.78 $6.21
Closing inventory in units 12500 8000 6500
Ending finished goods inventory 75750 46240 40365
7. Selling and administrative expenses budget: It indicates various operating expenses which is
categorized into either selling or administrative expenses (Zomer and et.al., 2016). These two
expenses can include both variable and fixed nature expenses. Selling expenses includes
manufacturing overhead rate
$25 $25 $25
3 Total variable overhead $51750 $68250 $45750
4 Fixed overhead budgeted $40000 $40000 $40000
5 Total manufacturing
overhead
$91750 $108250 $85750
6 Overhead recovery rate 91750/34500
= $2.66
108250/45500
=$2.38
85750/30500
=$2.81
6. Finished goods inventory budget: This budget indicates the cost and units at the end of each
period. It is calculated as, per unit cost of product multiplied by the number of units available at
the end of each period.
Ending Finished Goods Inventory Budget
Particulars Quantity Cost Total cost per unit
Direct material per unit 5 pounds 0.5 $2.5
Direct labour hour per unit 0.06 $15 $0.9
Total cost per unit $3.4
Months July August September
Per unit direct cost $3.4 $3.4 $3.4
Overhead rate per unit $2.66 $2.38 $2.81
Product cost $6.06 $5.78 $6.21
Closing inventory in units 12500 8000 6500
Ending finished goods inventory 75750 46240 40365
7. Selling and administrative expenses budget: It indicates various operating expenses which is
categorized into either selling or administrative expenses (Zomer and et.al., 2016). These two
expenses can include both variable and fixed nature expenses. Selling expenses includes
⊘ This is a preview!⊘
Do you want full access?
Subscribe today to unlock all pages.
Trusted by 1+ million students worldwide
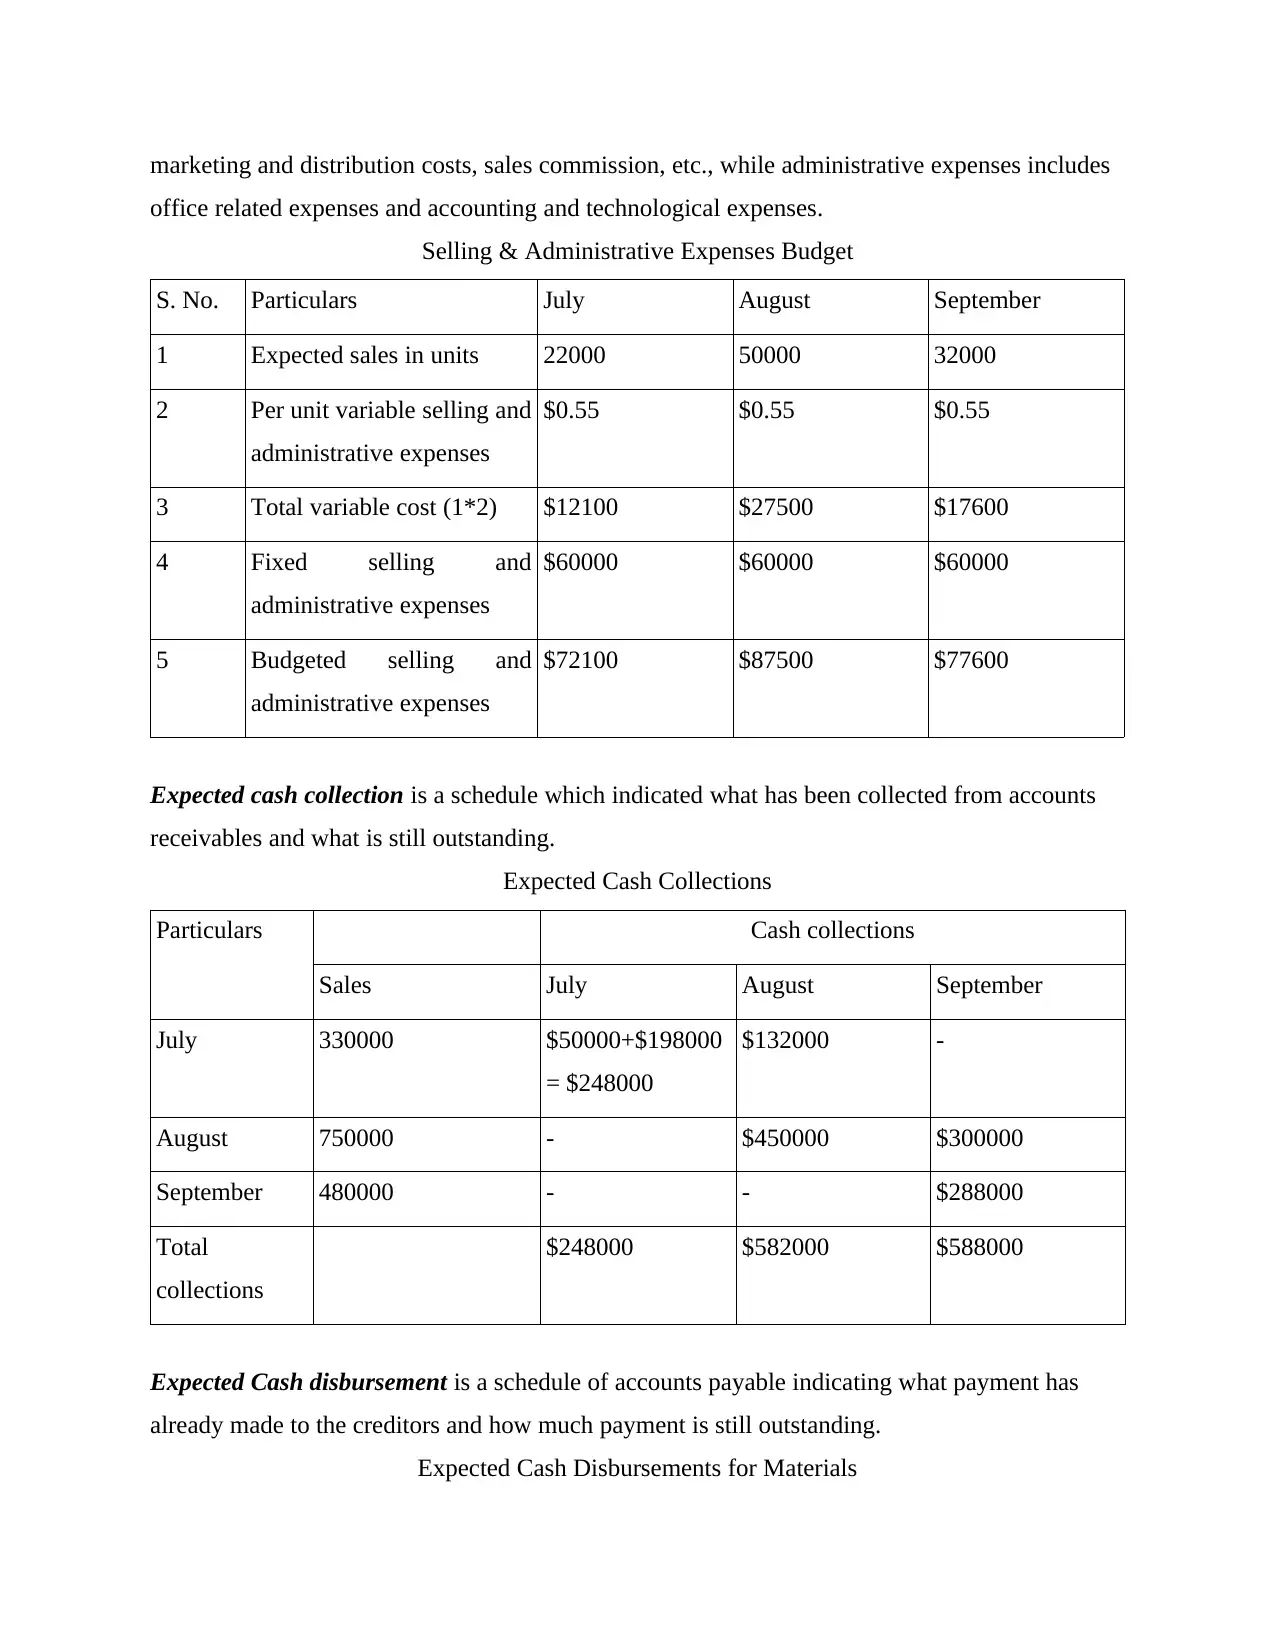
marketing and distribution costs, sales commission, etc., while administrative expenses includes
office related expenses and accounting and technological expenses.
Selling & Administrative Expenses Budget
S. No. Particulars July August September
1 Expected sales in units 22000 50000 32000
2 Per unit variable selling and
administrative expenses
$0.55 $0.55 $0.55
3 Total variable cost (1*2) $12100 $27500 $17600
4 Fixed selling and
administrative expenses
$60000 $60000 $60000
5 Budgeted selling and
administrative expenses
$72100 $87500 $77600
Expected cash collection is a schedule which indicated what has been collected from accounts
receivables and what is still outstanding.
Expected Cash Collections
Particulars Cash collections
Sales July August September
July 330000 $50000+$198000
= $248000
$132000 -
August 750000 - $450000 $300000
September 480000 - - $288000
Total
collections
$248000 $582000 $588000
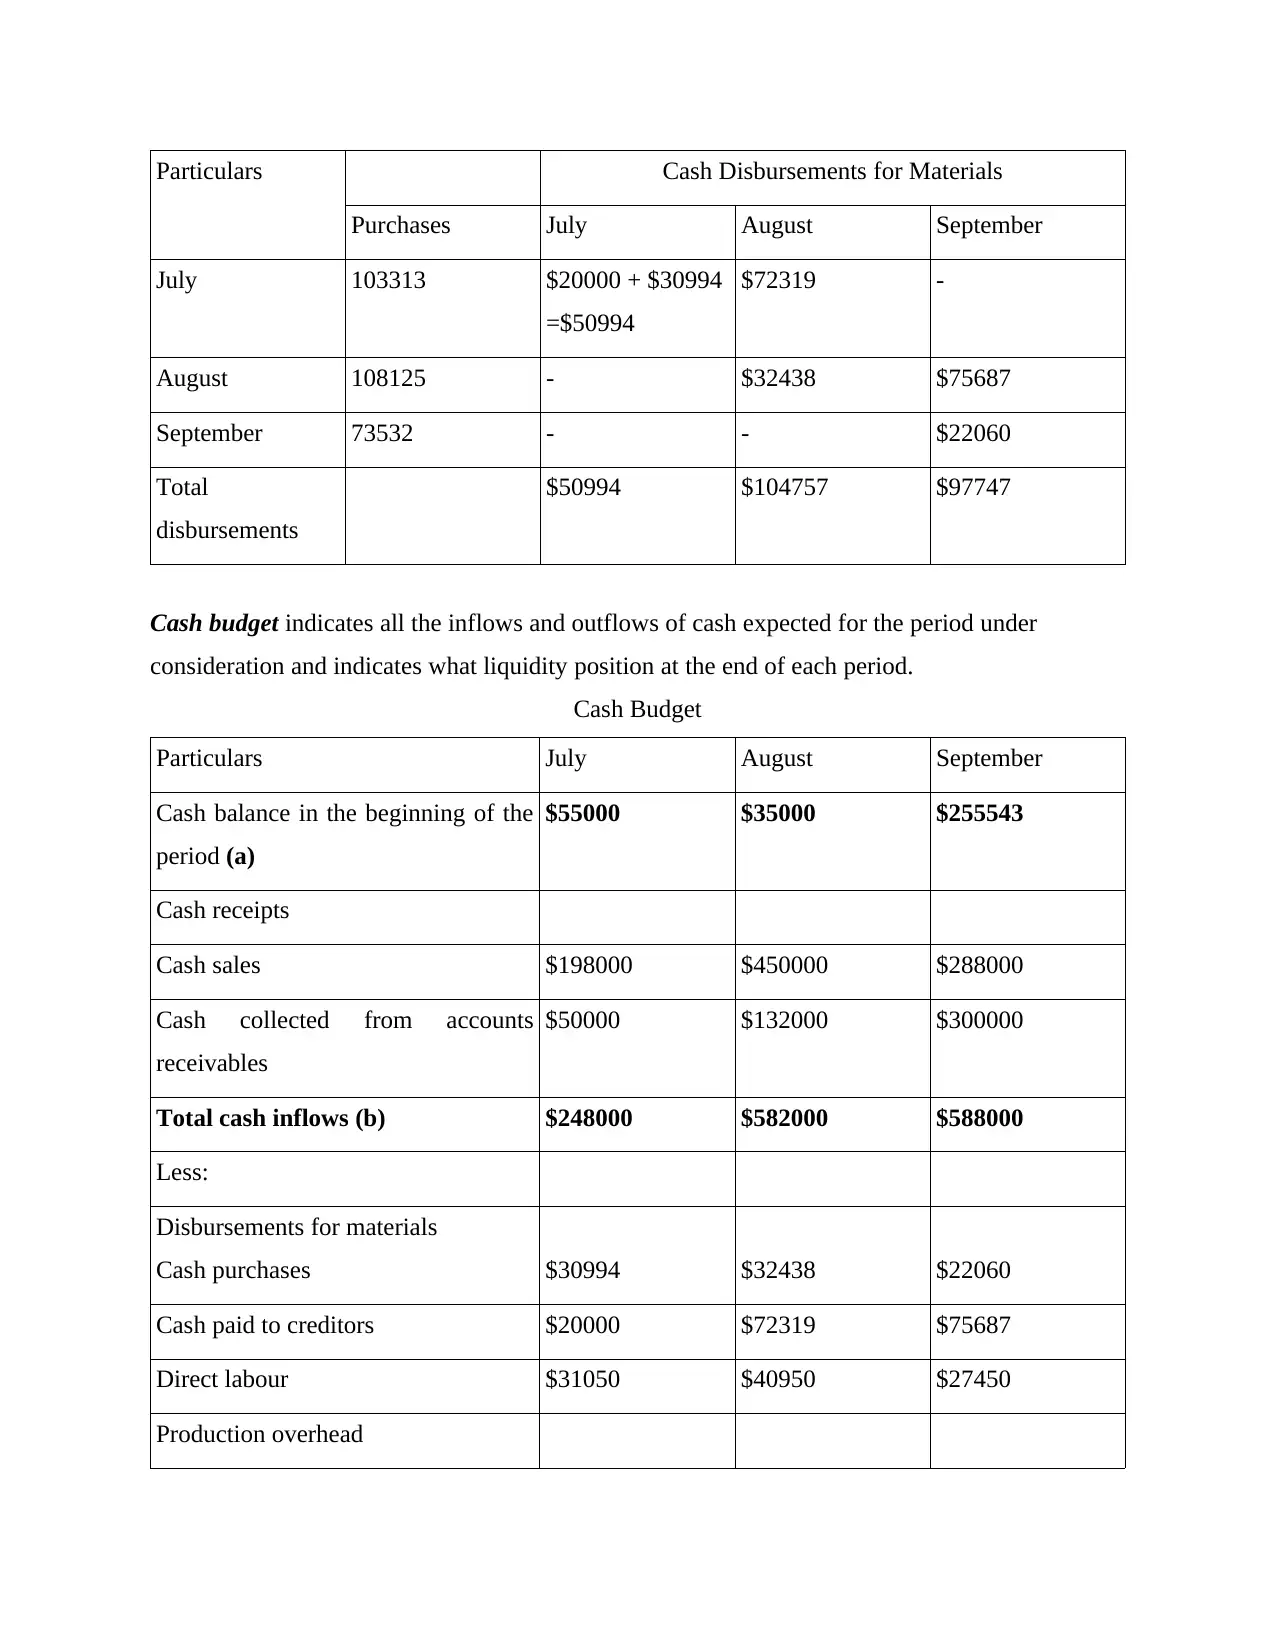
Expected Cash disbursement is a schedule of accounts payable indicating what payment has
already made to the creditors and how much payment is still outstanding.
Expected Cash Disbursements for Materials
office related expenses and accounting and technological expenses.
Selling & Administrative Expenses Budget
S. No. Particulars July August September
1 Expected sales in units 22000 50000 32000
2 Per unit variable selling and
administrative expenses
$0.55 $0.55 $0.55
3 Total variable cost (1*2) $12100 $27500 $17600
4 Fixed selling and
administrative expenses
$60000 $60000 $60000
5 Budgeted selling and
administrative expenses
$72100 $87500 $77600
Expected cash collection is a schedule which indicated what has been collected from accounts
receivables and what is still outstanding.
Expected Cash Collections
Particulars Cash collections
Sales July August September
July 330000 $50000+$198000
= $248000
$132000 -
August 750000 - $450000 $300000
September 480000 - - $288000
Total
collections
$248000 $582000 $588000
Expected Cash disbursement is a schedule of accounts payable indicating what payment has
already made to the creditors and how much payment is still outstanding.
Expected Cash Disbursements for Materials
Paraphrase This Document
Need a fresh take? Get an instant paraphrase of this document with our AI Paraphraser
Particulars Cash Disbursements for Materials
Purchases July August September
July 103313 $20000 + $30994
=$50994
$72319 -
August 108125 - $32438 $75687
September 73532 - - $22060
Total
disbursements
$50994 $104757 $97747
Cash budget indicates all the inflows and outflows of cash expected for the period under
consideration and indicates what liquidity position at the end of each period.
Cash Budget
Particulars July August September
Cash balance in the beginning of the
period (a)
$55000 $35000 $255543
Cash receipts
Cash sales $198000 $450000 $288000
Cash collected from accounts
receivables
$50000 $132000 $300000
Total cash inflows (b) $248000 $582000 $588000
Less:
Disbursements for materials
Cash purchases $30994 $32438 $22060
Cash paid to creditors $20000 $72319 $75687
Direct labour $31050 $40950 $27450
Production overhead
Variable $51750 $68250 $45750
Fixed (excluding non cash expenses) $30000 $30000 $30000
Selling and administrative expenses
Variable $12100 $27500 $17600
Fixed (excluding non cash expenses) $45000 $45000 $45000
Equipment purchase $155200 - $54800
Dividend paid - $45000 -
Repayment of loan $108094*
Interest @12% $1081
Total Cash Outflow (c) $376094 $361457 $427522
Closing Cash Balance(a+b-c) -$73094* $255543 $416021
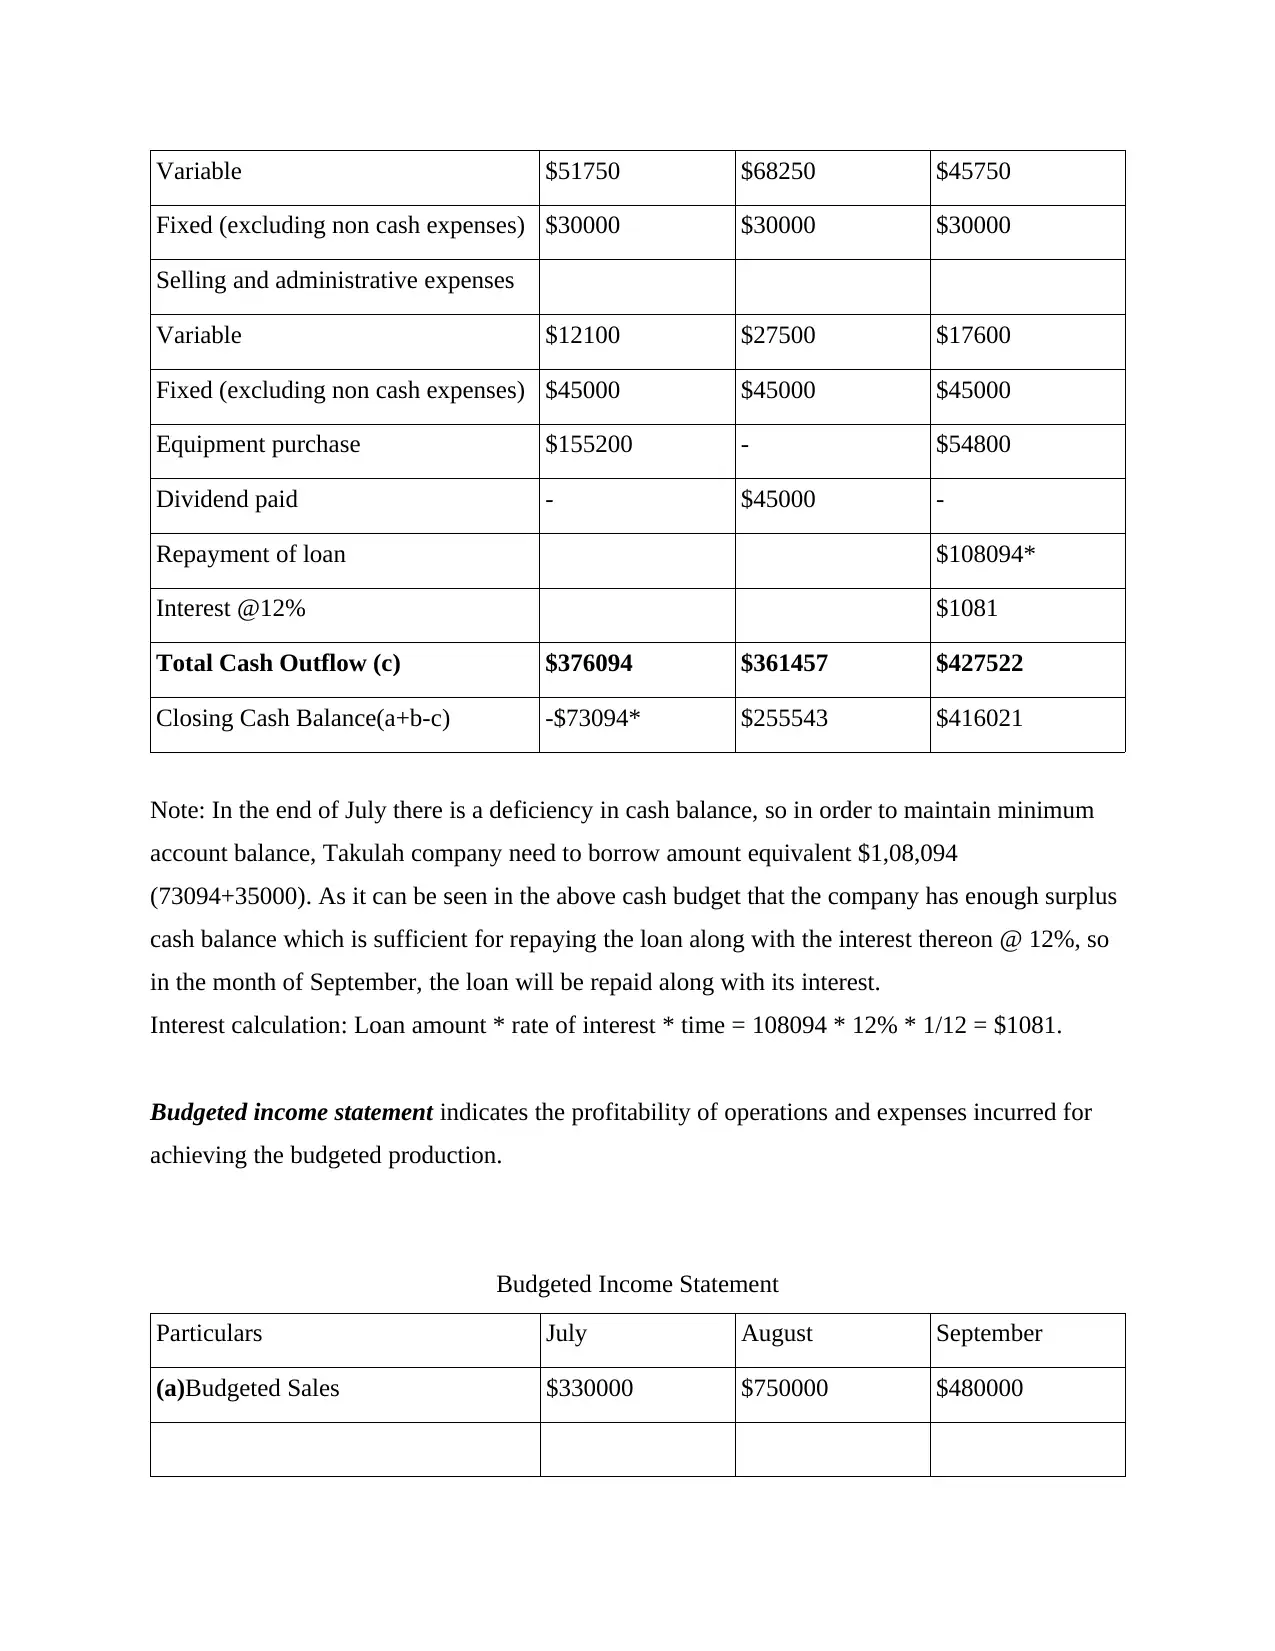
Note: In the end of July there is a deficiency in cash balance, so in order to maintain minimum
account balance, Takulah company need to borrow amount equivalent $1,08,094
(73094+35000). As it can be seen in the above cash budget that the company has enough surplus
cash balance which is sufficient for repaying the loan along with the interest thereon @ 12%, so
in the month of September, the loan will be repaid along with its interest.
Interest calculation: Loan amount * rate of interest * time = 108094 * 12% * 1/12 = $1081.
Budgeted income statement indicates the profitability of operations and expenses incurred for
achieving the budgeted production.
Budgeted Income Statement
Particulars July August September
(a)Budgeted Sales $330000 $750000 $480000
Fixed (excluding non cash expenses) $30000 $30000 $30000
Selling and administrative expenses
Variable $12100 $27500 $17600
Fixed (excluding non cash expenses) $45000 $45000 $45000
Equipment purchase $155200 - $54800
Dividend paid - $45000 -
Repayment of loan $108094*
Interest @12% $1081
Total Cash Outflow (c) $376094 $361457 $427522
Closing Cash Balance(a+b-c) -$73094* $255543 $416021
Note: In the end of July there is a deficiency in cash balance, so in order to maintain minimum
account balance, Takulah company need to borrow amount equivalent $1,08,094
(73094+35000). As it can be seen in the above cash budget that the company has enough surplus
cash balance which is sufficient for repaying the loan along with the interest thereon @ 12%, so
in the month of September, the loan will be repaid along with its interest.
Interest calculation: Loan amount * rate of interest * time = 108094 * 12% * 1/12 = $1081.
Budgeted income statement indicates the profitability of operations and expenses incurred for
achieving the budgeted production.
Budgeted Income Statement
Particulars July August September
(a)Budgeted Sales $330000 $750000 $480000
⊘ This is a preview!⊘
Do you want full access?
Subscribe today to unlock all pages.
Trusted by 1+ million students worldwide
1 out of 16
Related Documents


Your All-in-One AI-Powered Toolkit for Academic Success.
+13062052269
info@desklib.com
Available 24*7 on WhatsApp / Email
![[object Object]](/_next/static/media/star-bottom.7253800d.svg)
Unlock your academic potential
Copyright © 2020–2026 A2Z Services. All Rights Reserved. Developed and managed by ZUCOL.