Analysis of Management Accounting Concepts and Proposals
VerifiedAdded on 2023/06/06
|12
|1621
|318
Homework Assignment
AI Summary
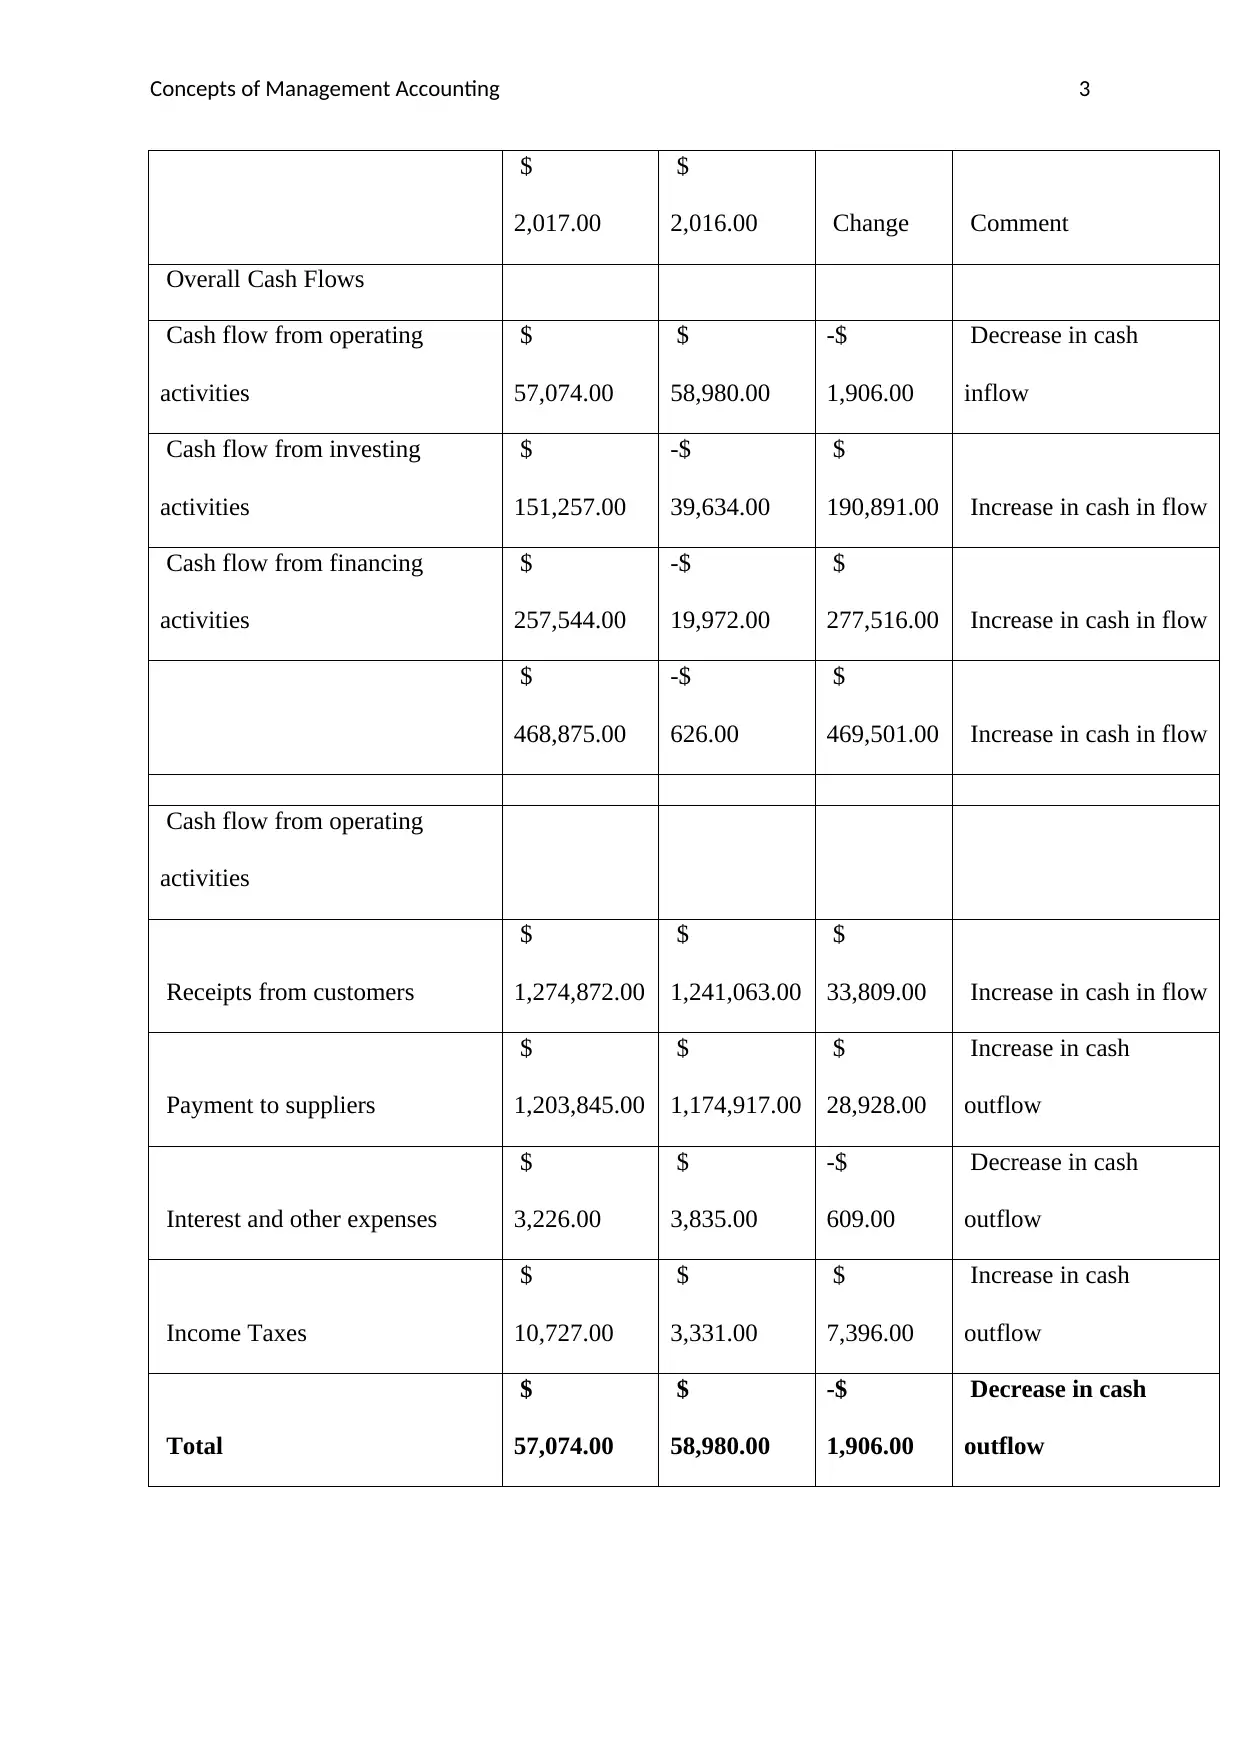
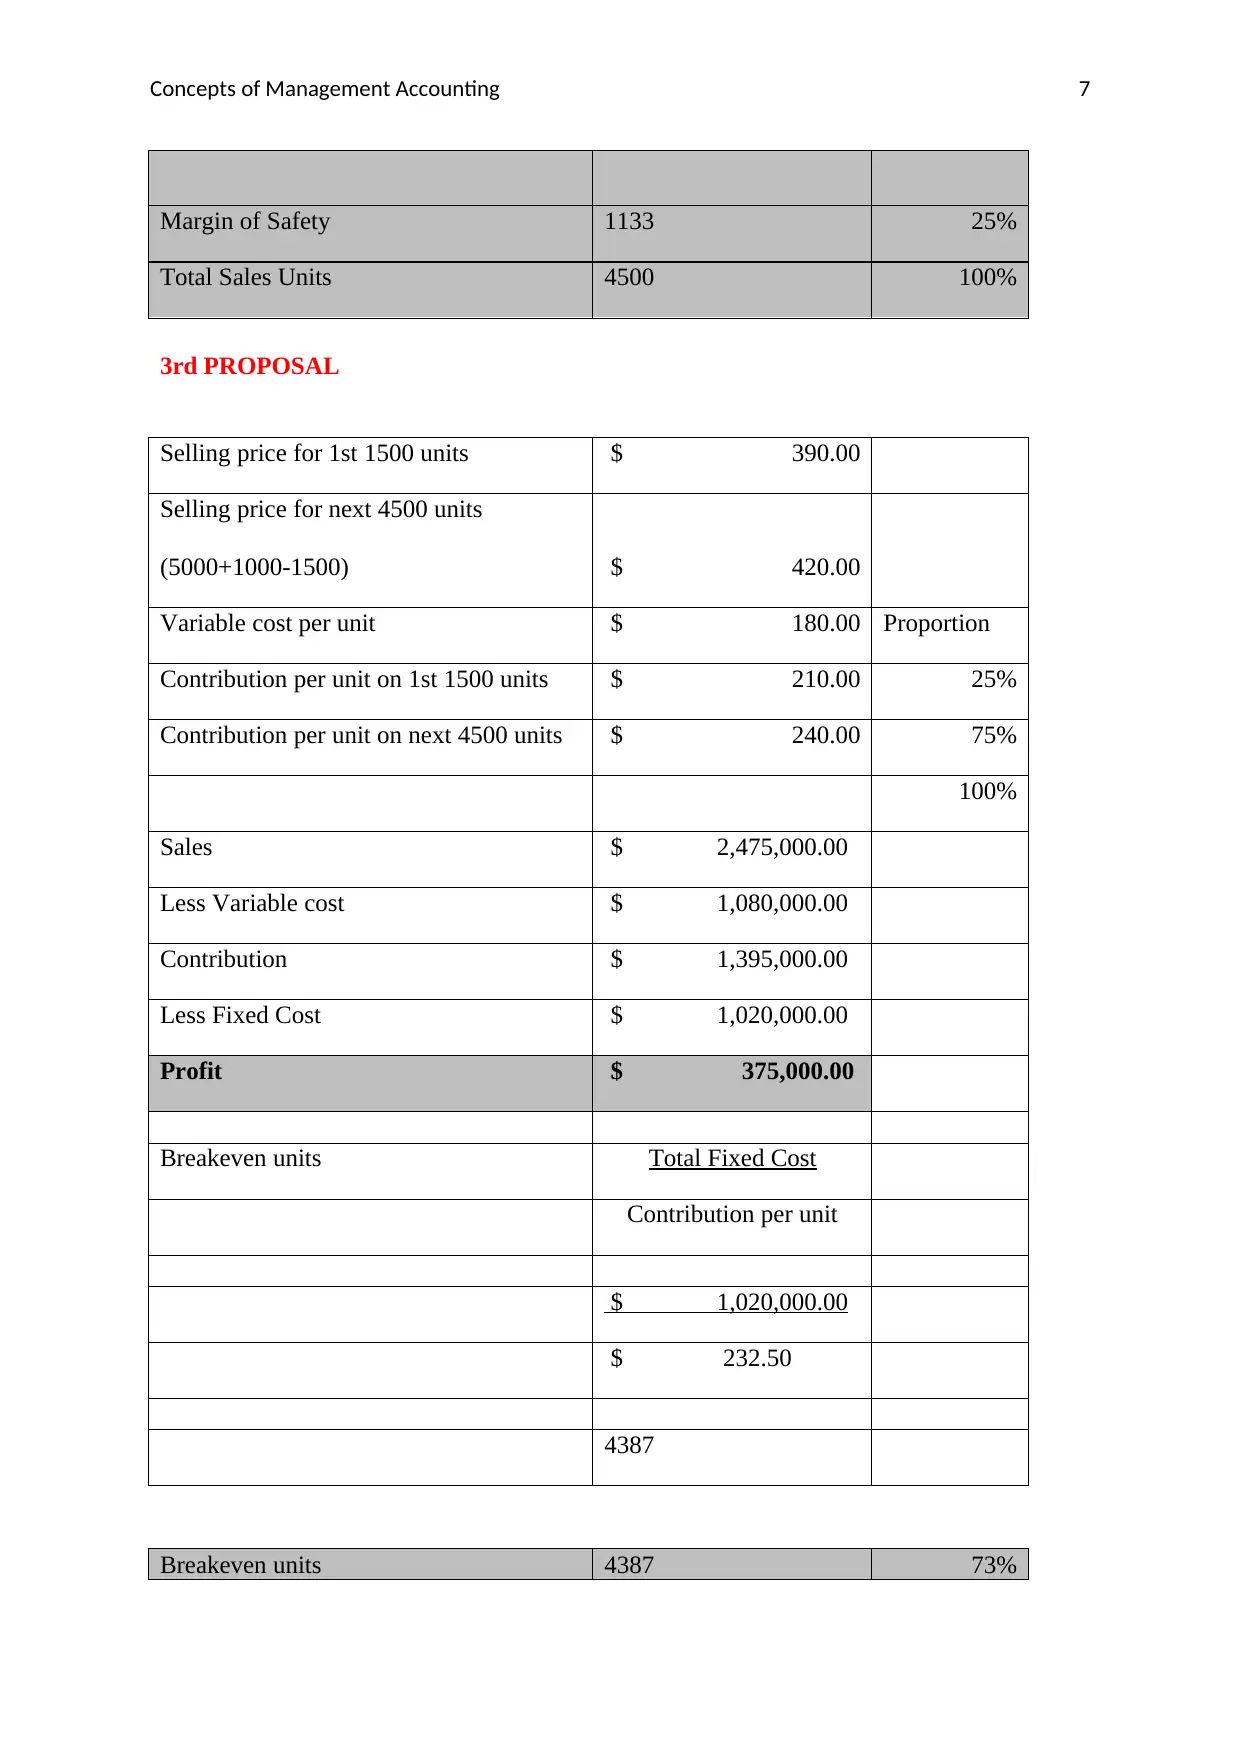
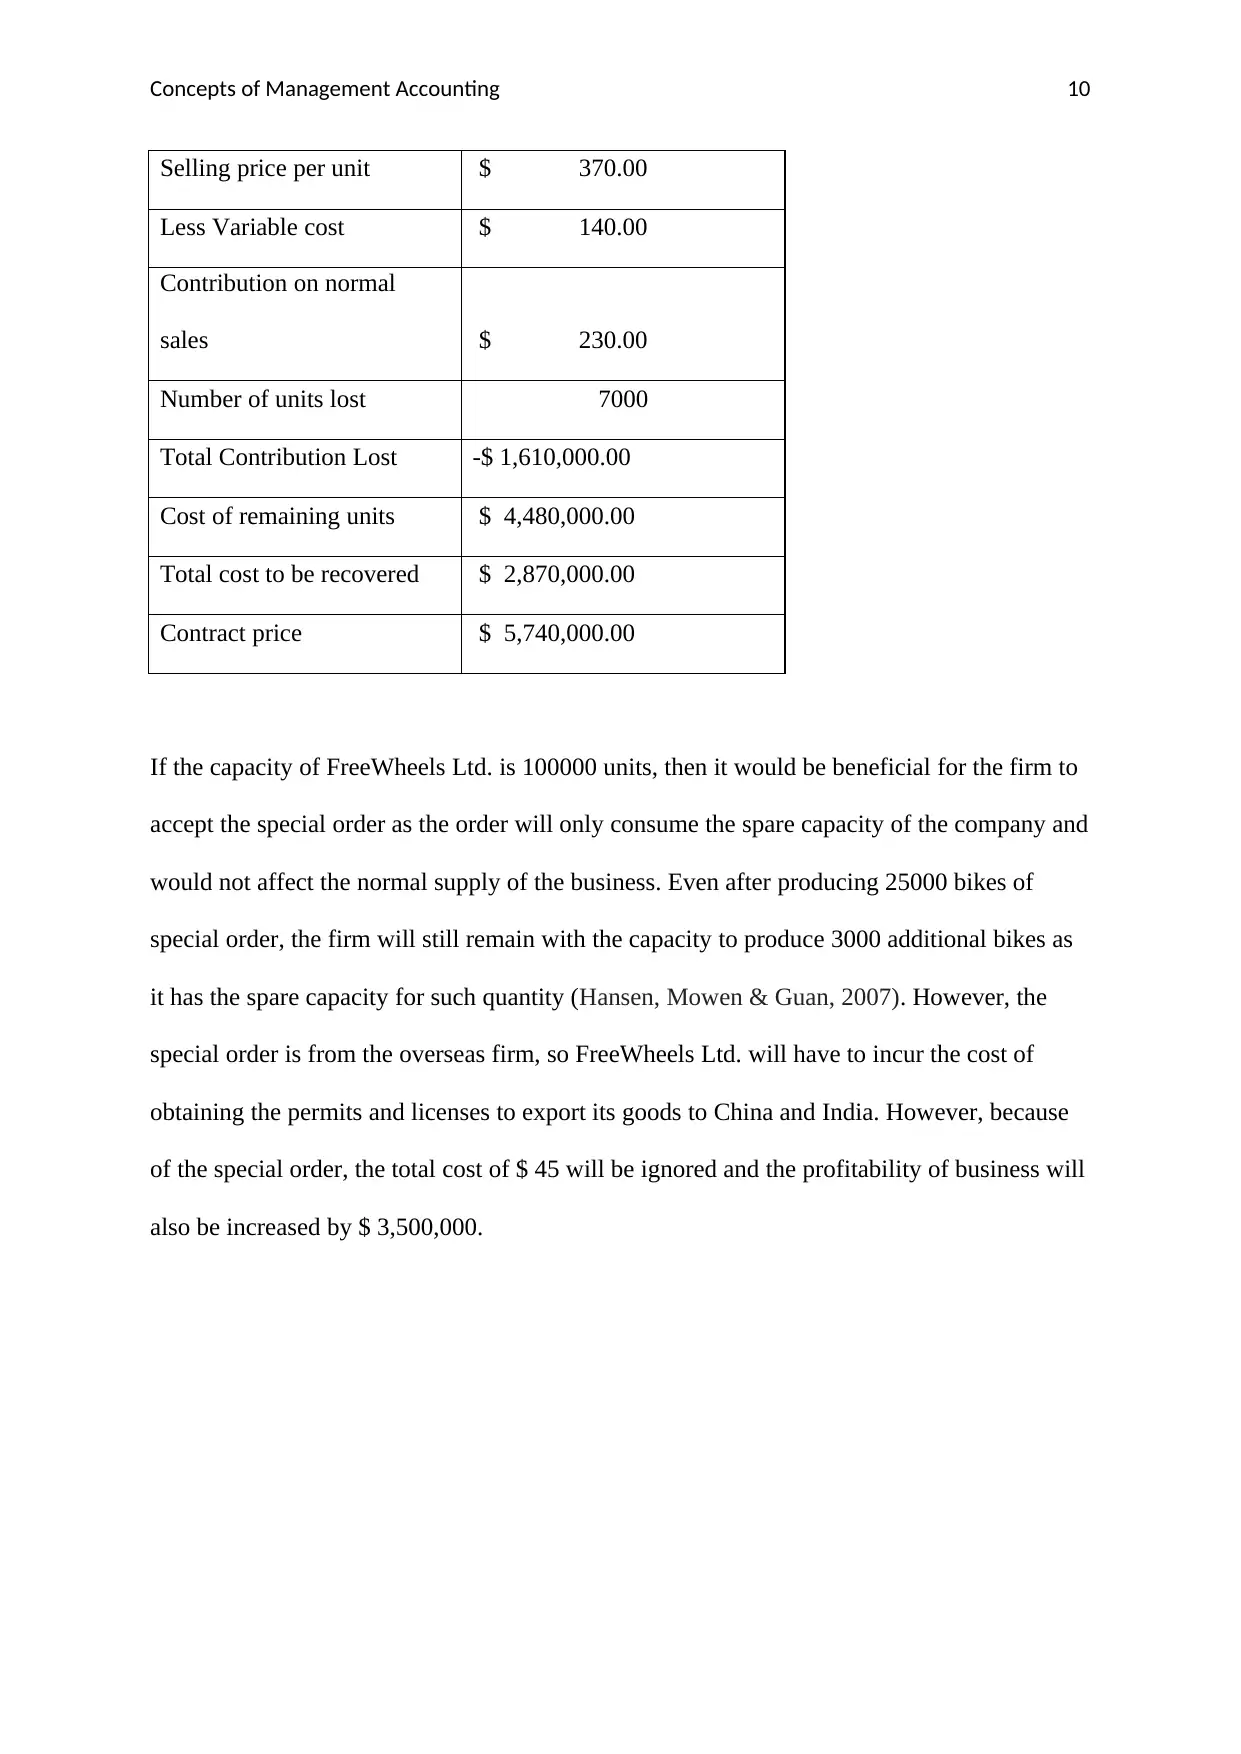
This assignment delves into core management accounting concepts through a comprehensive analysis of financial data and decision-making scenarios. It begins with an examination of the cash cycle, analyzing key metrics such as inventory days, collection days, and payable days over a five-year period to assess the company's liquidity and efficiency. The assignment then proceeds to evaluate different proposals for a business, calculating profitability, breakeven points, and margins of safety to determine the most financially advantageous option. Finally, it addresses a special order decision, considering capacity constraints, relevant costs, and the potential impact on overall profitability. The analysis includes references to annual reports and accounting literature to support the findings and conclusions.


1 out of 12
Related Documents


Your All-in-One AI-Powered Toolkit for Academic Success.
+13062052269
info@desklib.com
Available 24*7 on WhatsApp / Email
![[object Object]](/_next/static/media/star-bottom.7253800d.svg)
Copyright © 2020–2026 A2Z Services. All Rights Reserved. Developed and managed by ZUCOL.