Descriptive Statistics Analysis: Project 2A for Management Analytics
VerifiedAdded on 2021/01/02
|6
|1159
|246
Project
AI Summary
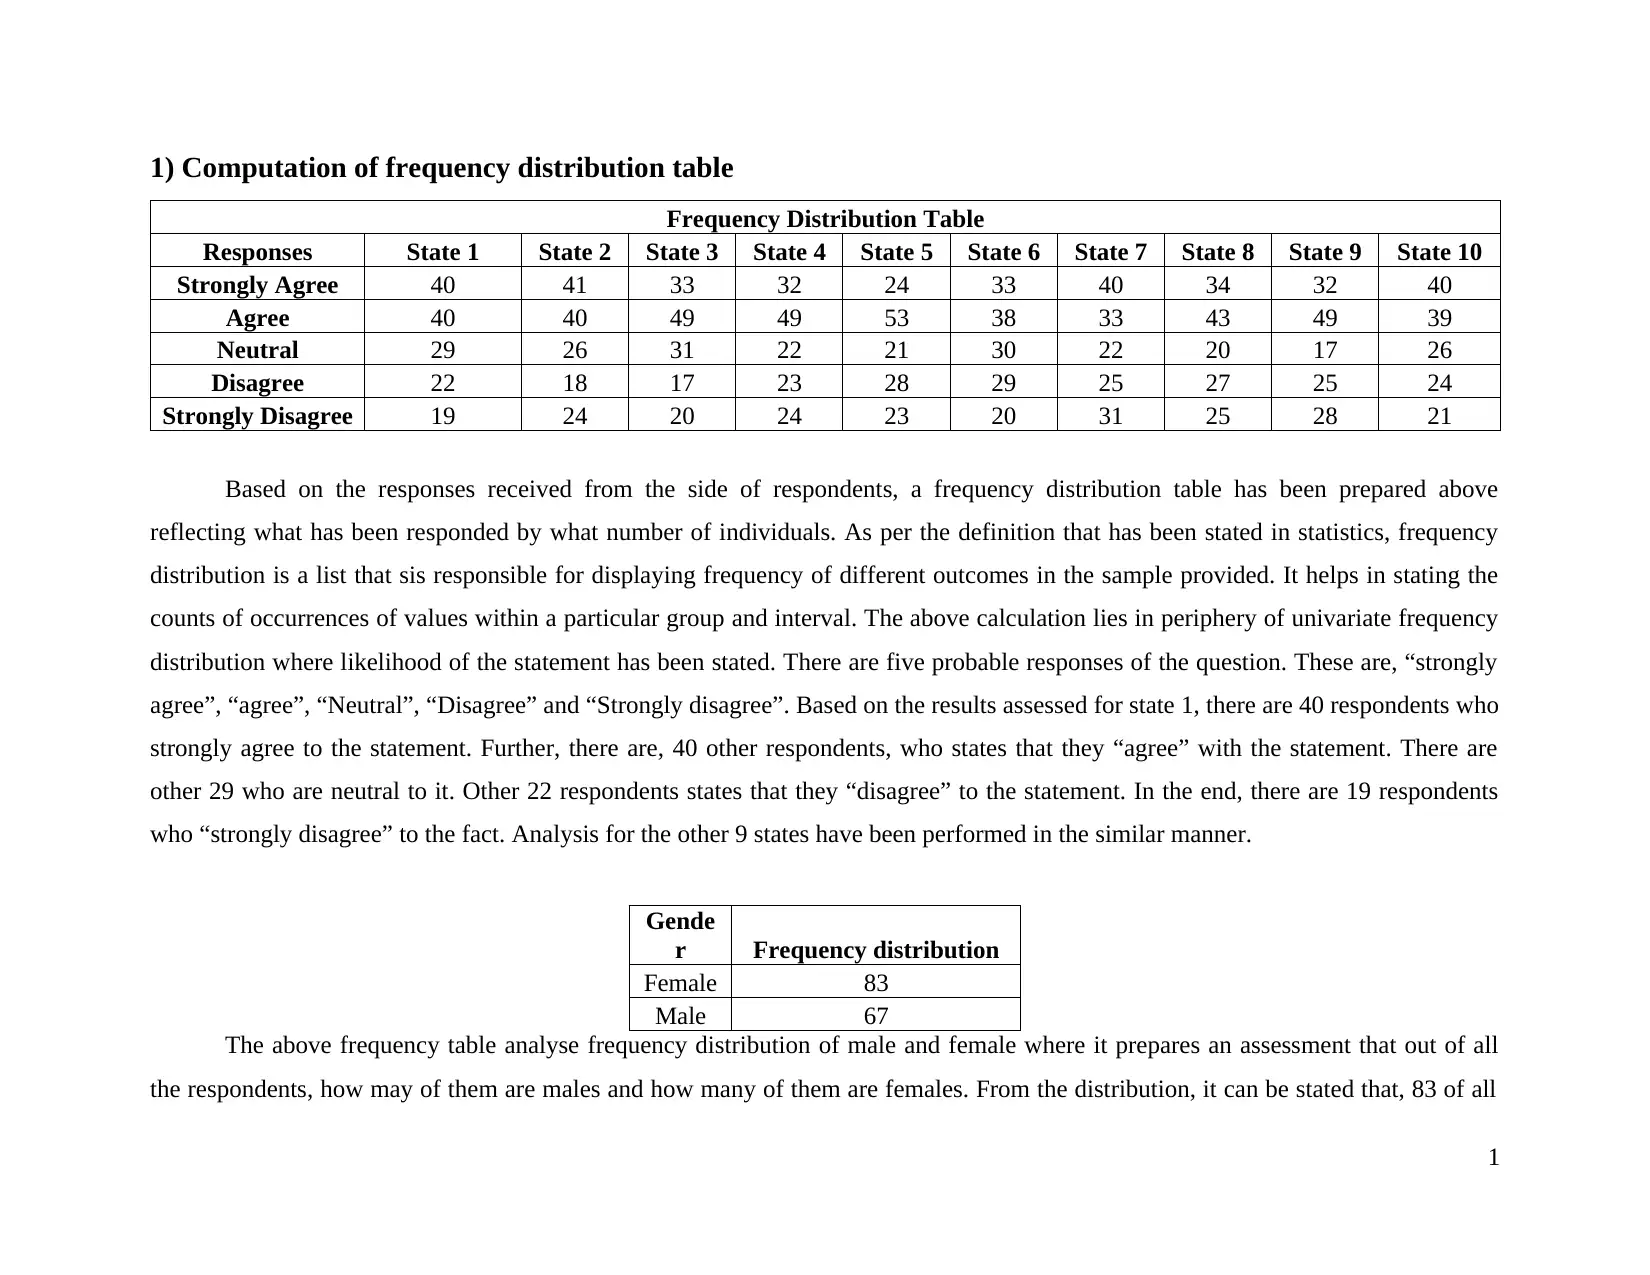
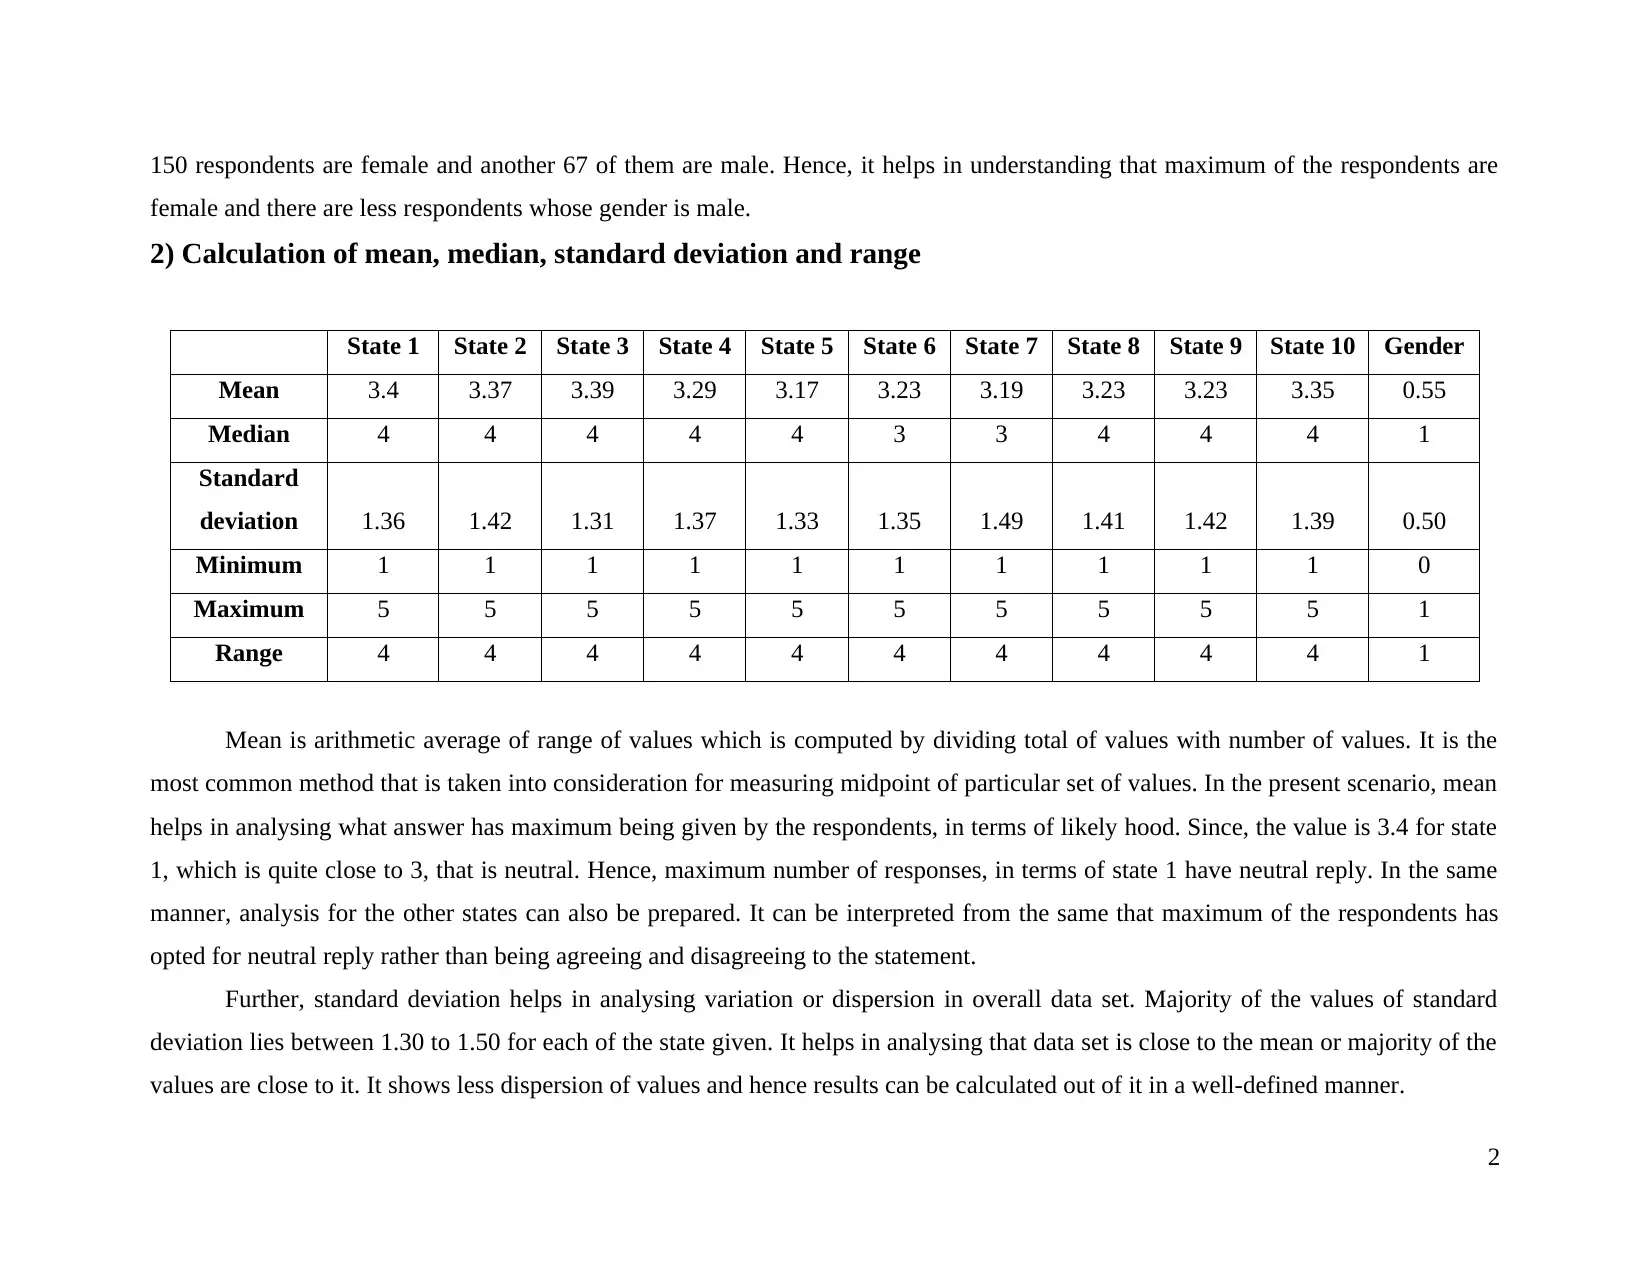
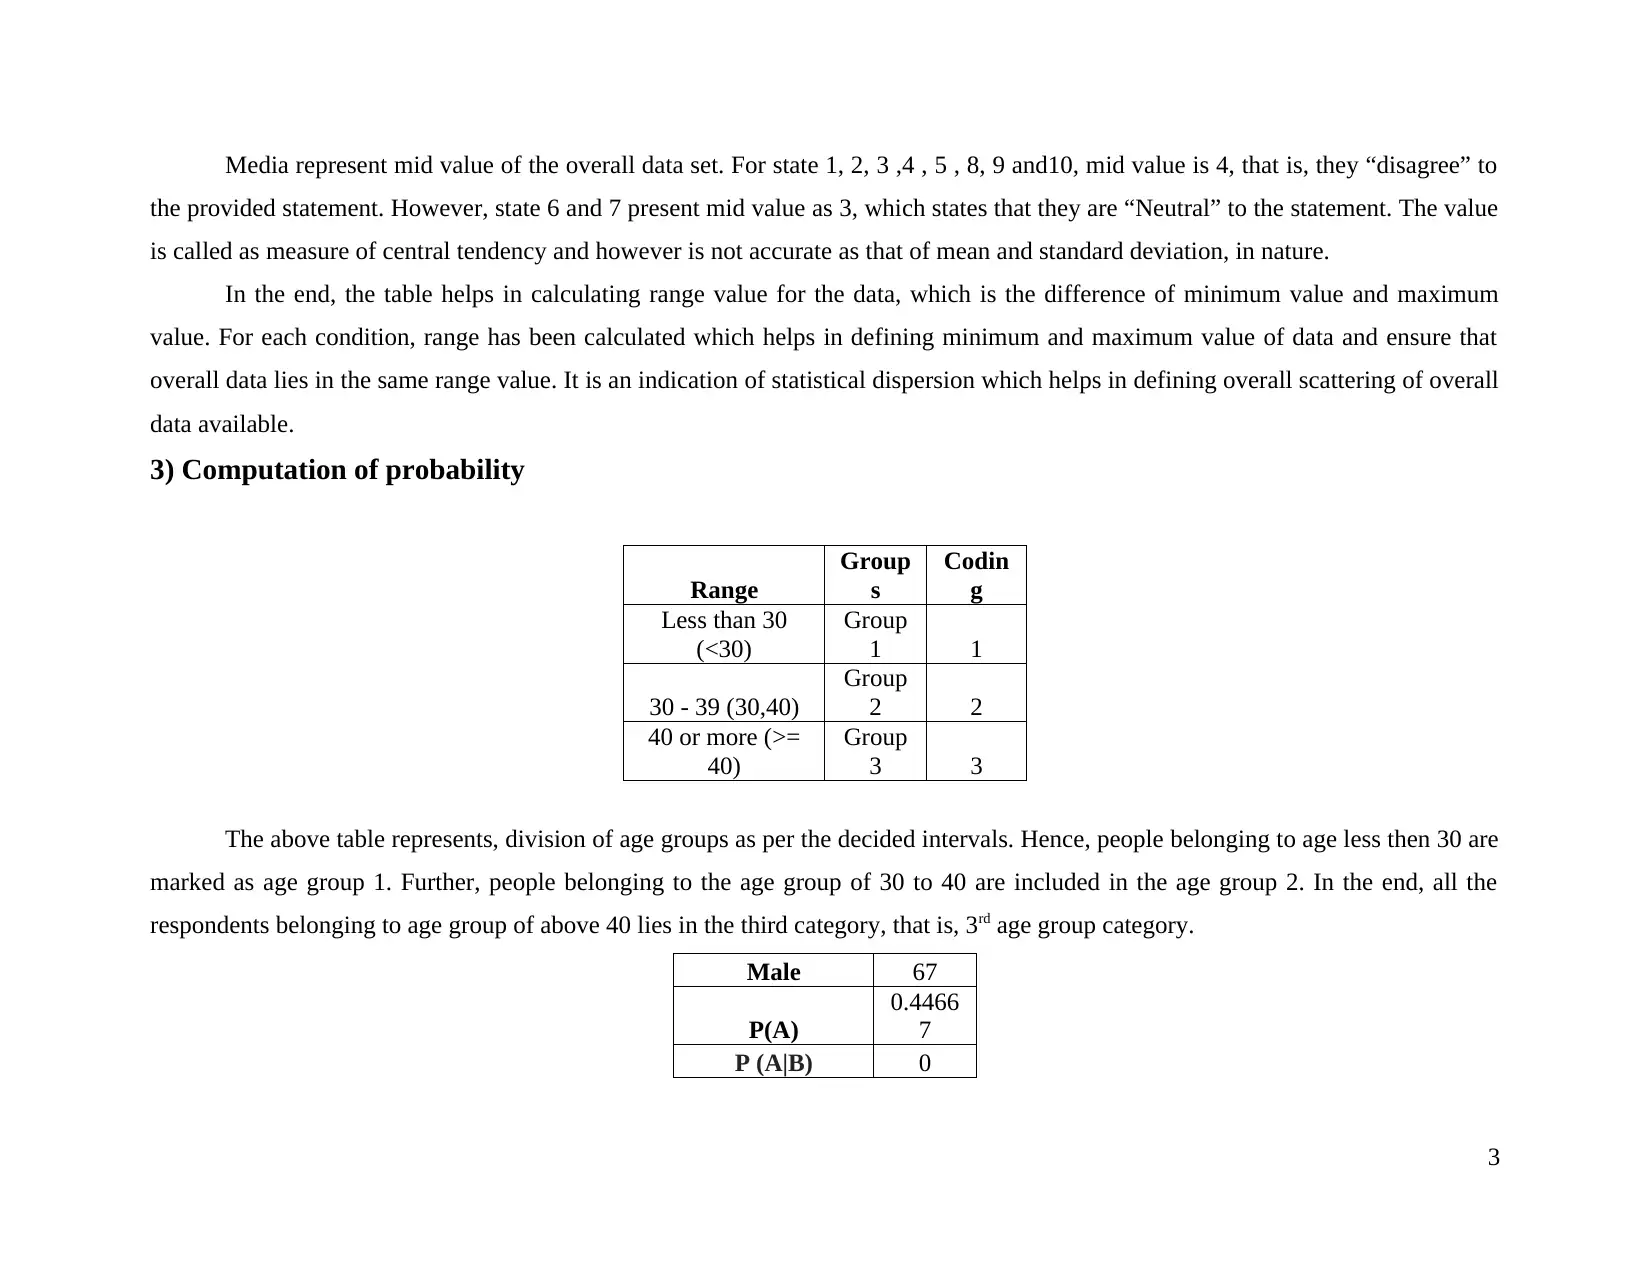
This project analyzes a dataset using descriptive statistics. It begins with the creation of a frequency distribution table based on responses from respondents across ten states, categorizing responses into 'Strongly Agree' to 'Strongly Disagree'. The project then calculates and interprets mean, median, standard deviation, and range for each state and for gender distribution. The analysis reveals the central tendency, dispersion, and range of the data, providing insights into the distribution of responses. Finally, the project computes probabilities, including the probability of a respondent being male, and analyzes age group distributions. The project demonstrates the use of statistical methods to summarize and interpret data for management analytics purposes, providing a comprehensive overview of the data's characteristics and patterns.
1 out of 6
Related Documents


Your All-in-One AI-Powered Toolkit for Academic Success.
+13062052269
info@desklib.com
Available 24*7 on WhatsApp / Email
![[object Object]](/_next/static/media/star-bottom.7253800d.svg)
Copyright © 2020–2026 A2Z Services. All Rights Reserved. Developed and managed by ZUCOL.