Management Analytics 4543: Descriptive and Regression Analysis
VerifiedAdded on 2022/12/05
|11
|2214
|179
Report
AI Summary
This report analyzes the salary gap within Aultra Pvt. Ltd., an insurance company operating since 1990. The study investigates the relationships between employee age, salary, car value, and debt using descriptive and regression analysis. Descriptive analysis, including mean, median, and mode, provides an overview of the data. Regression analysis explores the correlations between age and income, car value and income, and debt and income. The findings indicate that age, car value, and debt do not significantly correlate with salary gaps. The report concludes by rejecting the initial hypotheses and recommends that Aultra Pvt. Ltd. establish a more systematic and justifiable salary structure based on skills, abilities, and market rates, while minimizing the current salary discrepancies to improve employee motivation and potential. The report is contributed by a student and published on Desklib.

Management Analytics 4543
1
1
Paraphrase This Document
Need a fresh take? Get an instant paraphrase of this document with our AI Paraphraser
Table of Contents
1.0. Introduction....................................................................................................................................3
2.0. Descriptive Analysis........................................................................................................................3
2.1. Mean..........................................................................................................................................3
2.2. Median.......................................................................................................................................3
2.3. Mode..........................................................................................................................................4
3.0. Regression Analysis.........................................................................................................................4
3.1. Age Based Income......................................................................................................................4
3.2. Car Value and Income.................................................................................................................5
3.3. Debt and Income........................................................................................................................6
4.0. Managerial Interpretations and Implications.................................................................................7
5.0. Conclusion and Recommendations.................................................................................................7
References.............................................................................................................................................9
2
1.0. Introduction
Aultra Pvt. Ltd. is a renowned organization which has been operating its insurance services
for the public since 1990 in Indian market. Although salary is not motivating factor, it
contributes to de-motivate employees to explore their optimum potentiality. In this
organization, there is a huge gap in salary between the employees which is one of the key
problems to succeed the organization to achieve its strategic aims and objectives. This short
report tries to assess descriptive statistics related to age, salary, car value and debt to identify
whether they have any relationship with salary gap or not. Then, at the end of the report, the
author will provide some significant recommendations based on the statistical analysis
carried out using excel software. The study will start with a crucial assessment of existing
setup dependent on available information Its aim is to provide framework for the assessment
of market analytics by outlining the evolution of academic theories and analysis which has
been done.
2.0. Descriptive Analysis
Descriptive analysis is the base or the first step of conducting statistical analysis. It offers a
general description of the data that helps to identify features of the overall information which
is imperative to know for the further analysis (Knapp, 2017). By using mean, median and
mode, the key attributes of the data can be better understood. In the study report evaluate
employers’ brandings and its implications on employees resourcing in the MNCs. It's
necessary to know what these words mean before evaluating the effects of employer branding
over employee resourcing: The internal (staff members) and outer (candidates, potential
talent, partners, and general public) opinions or perceptions of your company are referred to
as the employer branding. It's clearly the distinguishing feature that makes a company stand
out. The public's awareness and experience with an organization's goods and services, as well
as its offline/online contact, all contribute to employer branding. Employee resourcing
is HRM feature that focuses on employee recruiting, firing, capability growth, and
performance governance, Staffing (i.e., recruiting, placement, retention, and rejection),
performance assessment and performance evaluation, governance (policy implementation,
administrative creation, documentation), and transition management are also included within
this umbrella. Multinational Corporations are businesses that have expanded beyond their
home country's borders, with infrastructure and properties in at minimum two nation. They
are distinguished by maintaining branches and warehouses in various countries, as well
as central headquarters. Multinational Corporations are businesses that have expanded
3
⊘ This is a preview!⊘
Do you want full access?
Subscribe today to unlock all pages.
Trusted by 1+ million students worldwide
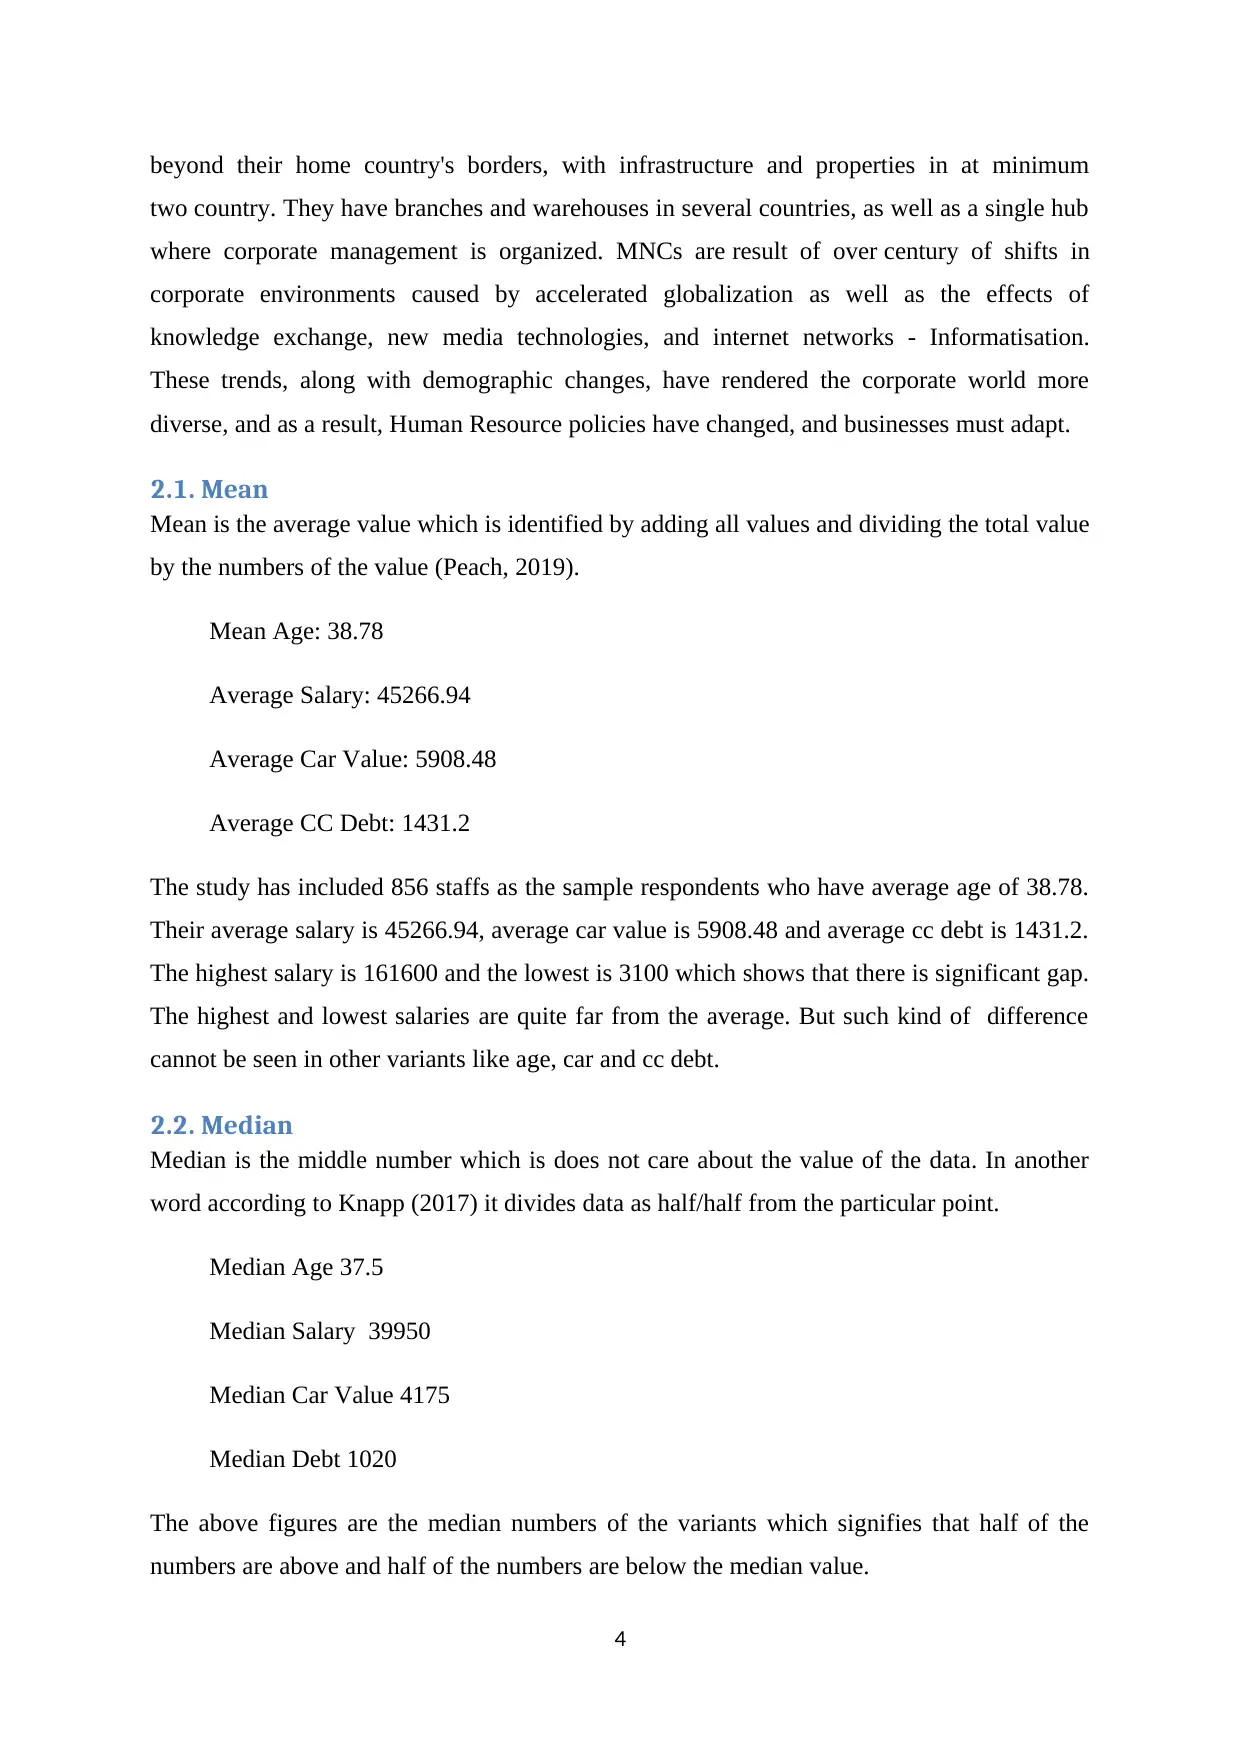
beyond their home country's borders, with infrastructure and properties in at minimum
two country. They have branches and warehouses in several countries, as well as a single hub
where corporate management is organized. MNCs are result of over century of shifts in
corporate environments caused by accelerated globalization as well as the effects of
knowledge exchange, new media technologies, and internet networks - Informatisation.
These trends, along with demographic changes, have rendered the corporate world more
diverse, and as a result, Human Resource policies have changed, and businesses must adapt.
2.1. Mean
Mean is the average value which is identified by adding all values and dividing the total value
by the numbers of the value (Peach, 2019).
Mean Age: 38.78
Average Salary: 45266.94
Average Car Value: 5908.48
Average CC Debt: 1431.2
The study has included 856 staffs as the sample respondents who have average age of 38.78.
Their average salary is 45266.94, average car value is 5908.48 and average cc debt is 1431.2.
The highest salary is 161600 and the lowest is 3100 which shows that there is significant gap.
The highest and lowest salaries are quite far from the average. But such kind of difference
cannot be seen in other variants like age, car and cc debt.
2.2. Median
Median is the middle number which is does not care about the value of the data. In another
word according to Knapp (2017) it divides data as half/half from the particular point.
Median Age 37.5
Median Salary 39950
Median Car Value 4175
Median Debt 1020
The above figures are the median numbers of the variants which signifies that half of the
numbers are above and half of the numbers are below the median value.
4
Paraphrase This Document
Need a fresh take? Get an instant paraphrase of this document with our AI Paraphraser
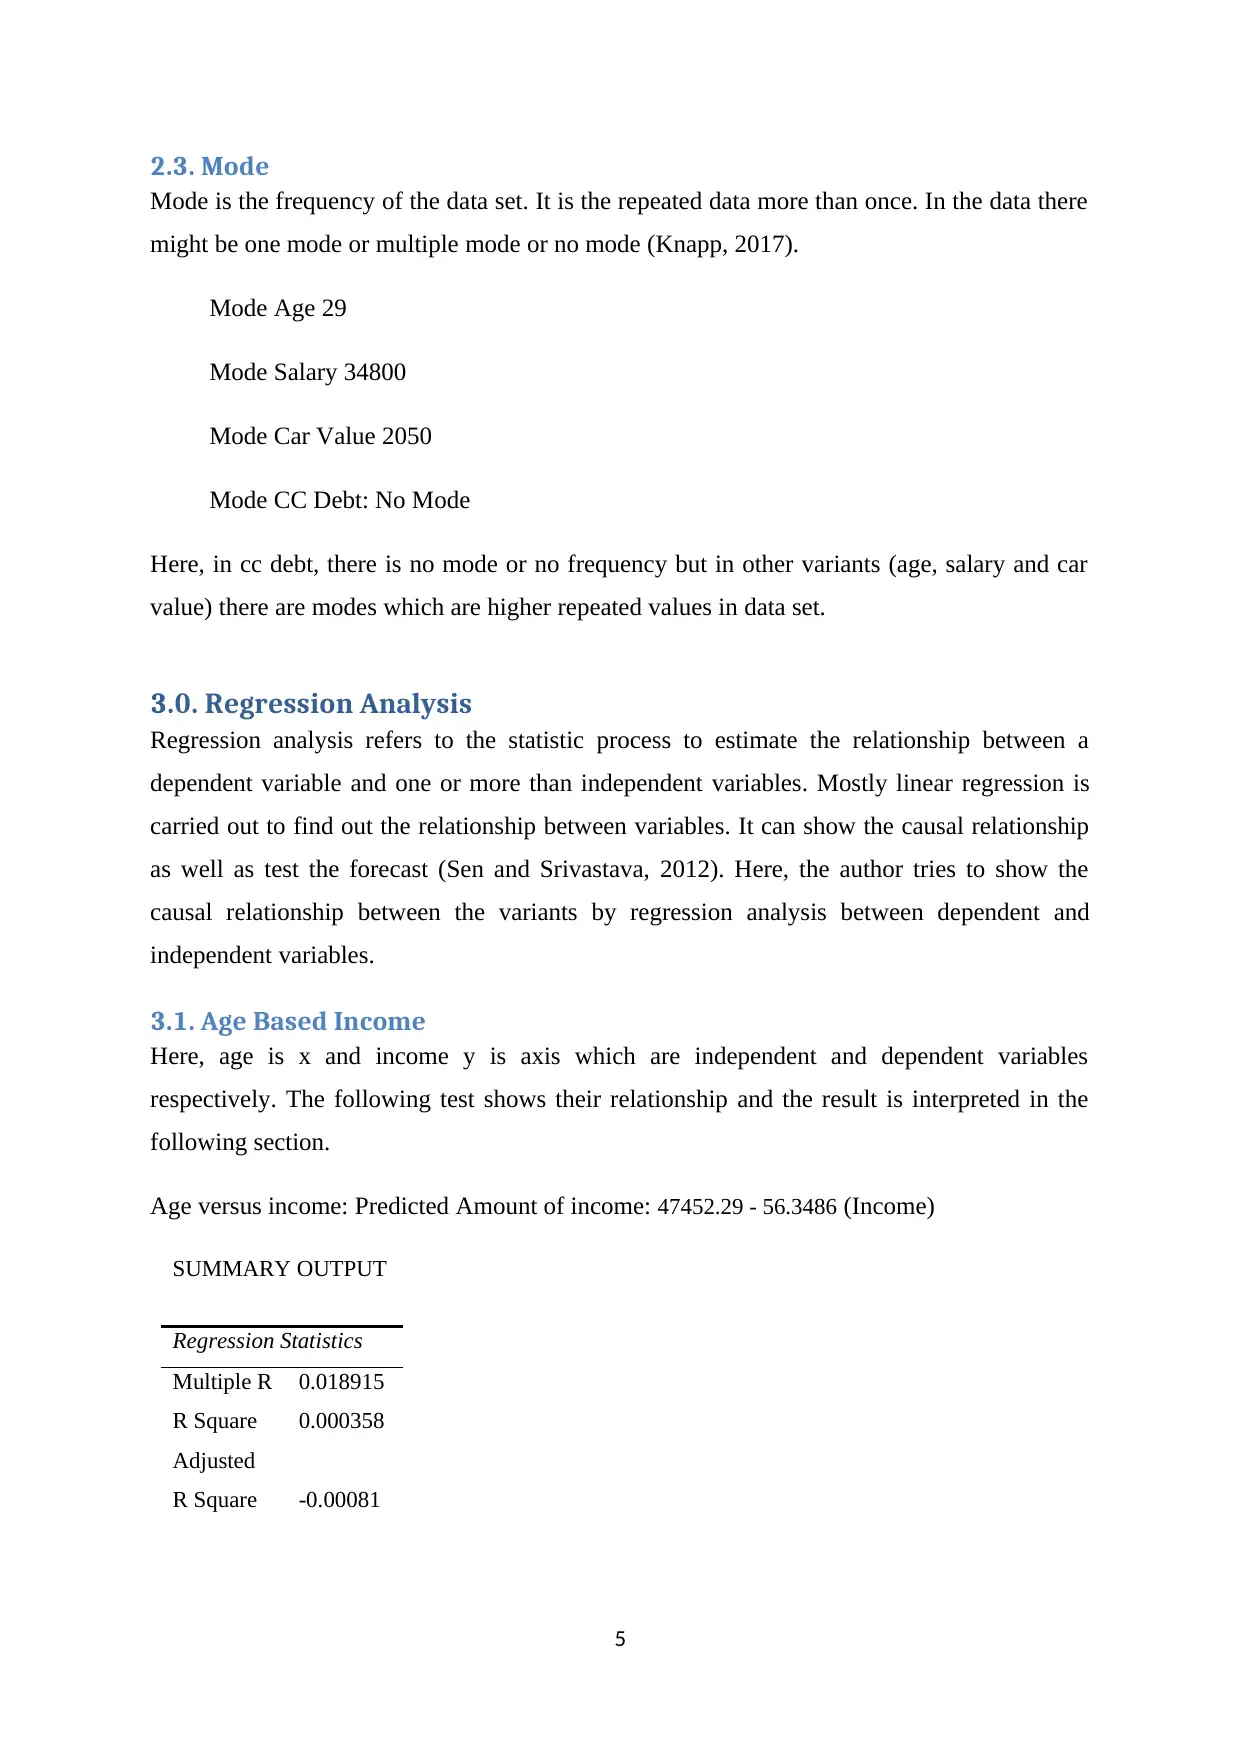
2.3. Mode
Mode is the frequency of the data set. It is the repeated data more than once. In the data there
might be one mode or multiple mode or no mode (Knapp, 2017).
Mode Age 29
Mode Salary 34800
Mode Car Value 2050
Mode CC Debt: No Mode
Here, in cc debt, there is no mode or no frequency but in other variants (age, salary and car
value) there are modes which are higher repeated values in data set.
3.0. Regression Analysis
Regression analysis refers to the statistic process to estimate the relationship between a
dependent variable and one or more than independent variables. Mostly linear regression is
carried out to find out the relationship between variables. It can show the causal relationship
as well as test the forecast (Sen and Srivastava, 2012). Here, the author tries to show the
causal relationship between the variants by regression analysis between dependent and
independent variables.
3.1. Age Based Income
Here, age is x and income y is axis which are independent and dependent variables
respectively. The following test shows their relationship and the result is interpreted in the
following section.
Age versus income: Predicted Amount of income: 47452.29 - 56.3486 (Income)
SUMMARY OUTPUT
Regression Statistics
Multiple R 0.018915
R Square 0.000358
Adjusted
R Square -0.00081
5
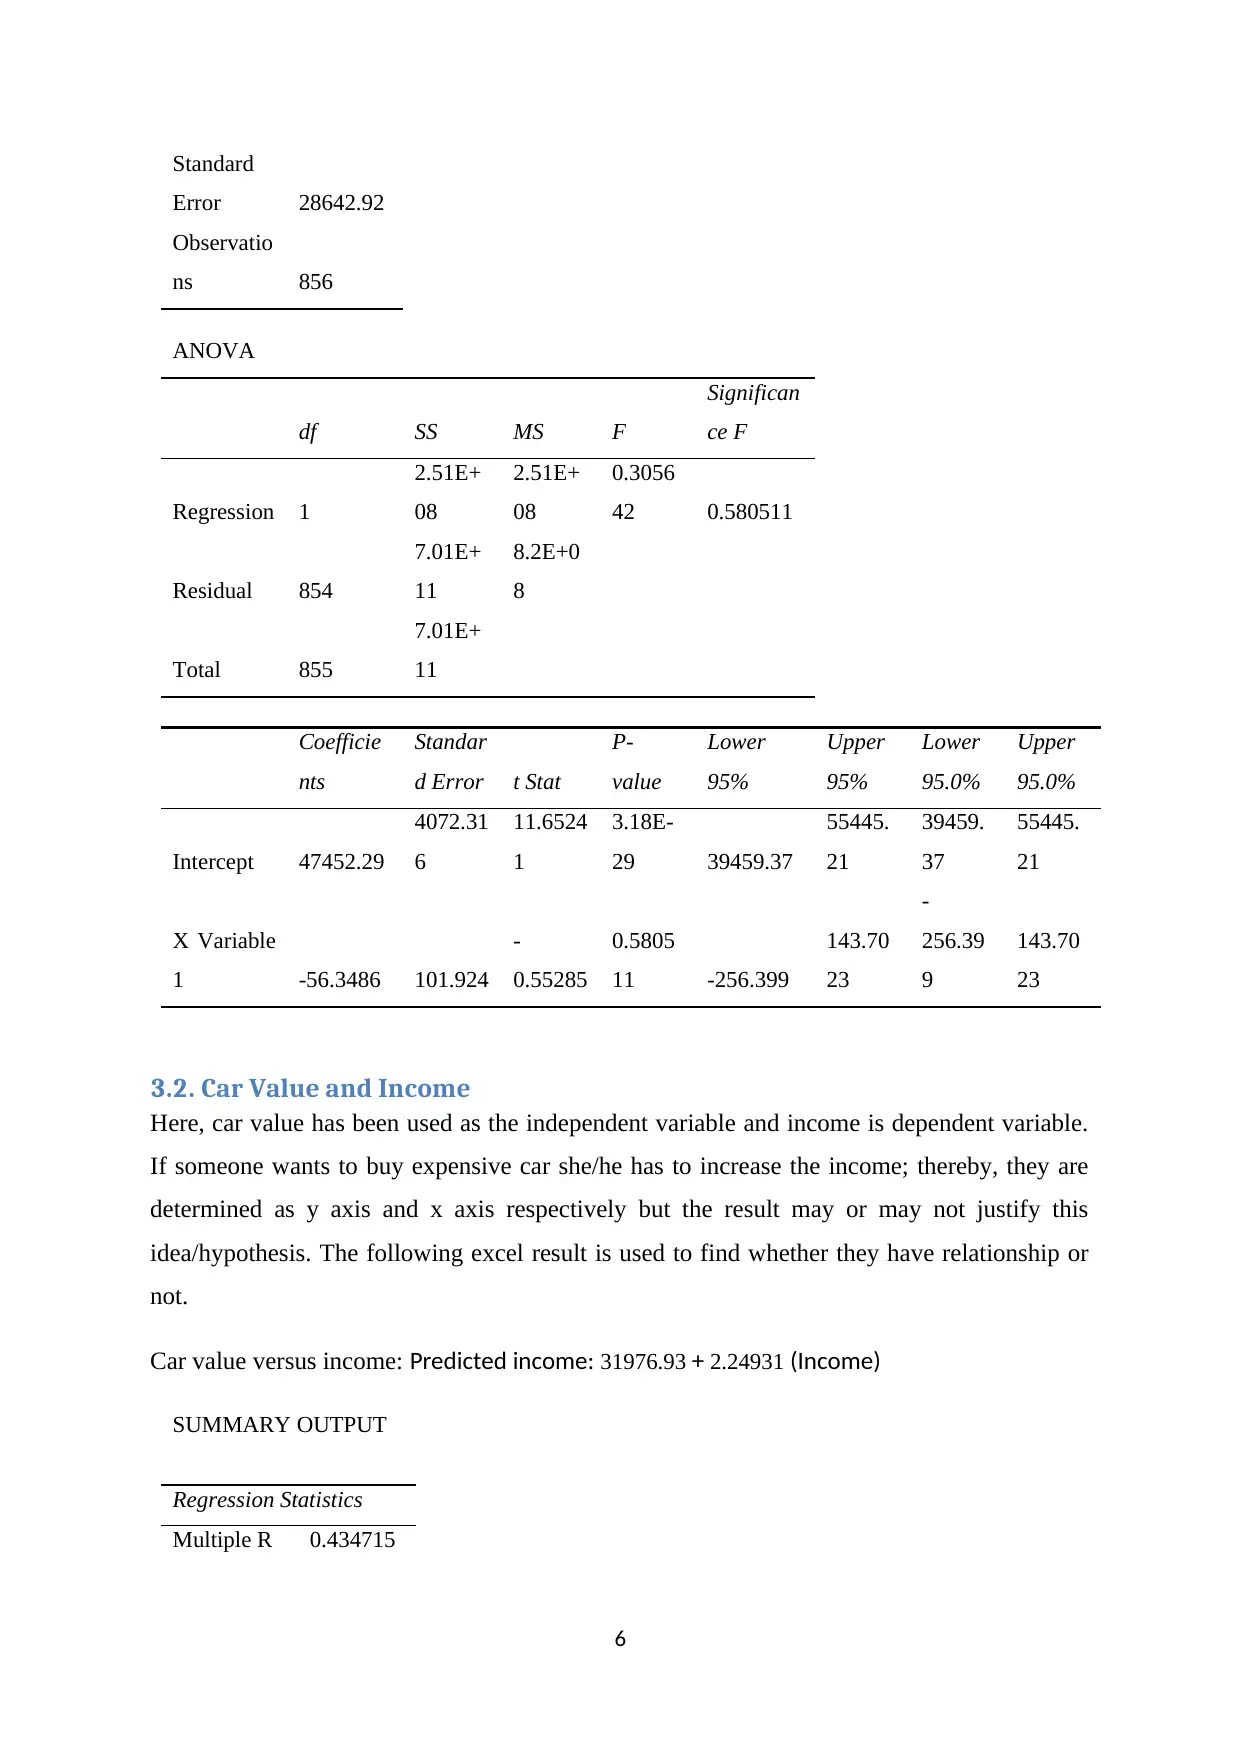
Standard
Error 28642.92
Observatio
ns 856
ANOVA
df SS MS F
Significan
ce F
Regression 1
2.51E+
08
2.51E+
08
0.3056
42 0.580511
Residual 854
7.01E+
11
8.2E+0
8
Total 855
7.01E+
11
Coefficie
nts
Standar
d Error t Stat
P-
value
Lower
95%
Upper
95%
Lower
95.0%
Upper
95.0%
Intercept 47452.29
4072.31
6
11.6524
1
3.18E-
29 39459.37
55445.
21
39459.
37
55445.
21
X Variable
1 -56.3486 101.924
-
0.55285
0.5805
11 -256.399
143.70
23
-
256.39
9
143.70
23
3.2. Car Value and Income
Here, car value has been used as the independent variable and income is dependent variable.
If someone wants to buy expensive car she/he has to increase the income; thereby, they are
determined as y axis and x axis respectively but the result may or may not justify this
idea/hypothesis. The following excel result is used to find whether they have relationship or
not.
Car value versus income: Predicted income: 31976.93 + 2.24931 (Income)
SUMMARY OUTPUT
Regression Statistics
Multiple R 0.434715
6
⊘ This is a preview!⊘
Do you want full access?
Subscribe today to unlock all pages.
Trusted by 1+ million students worldwide
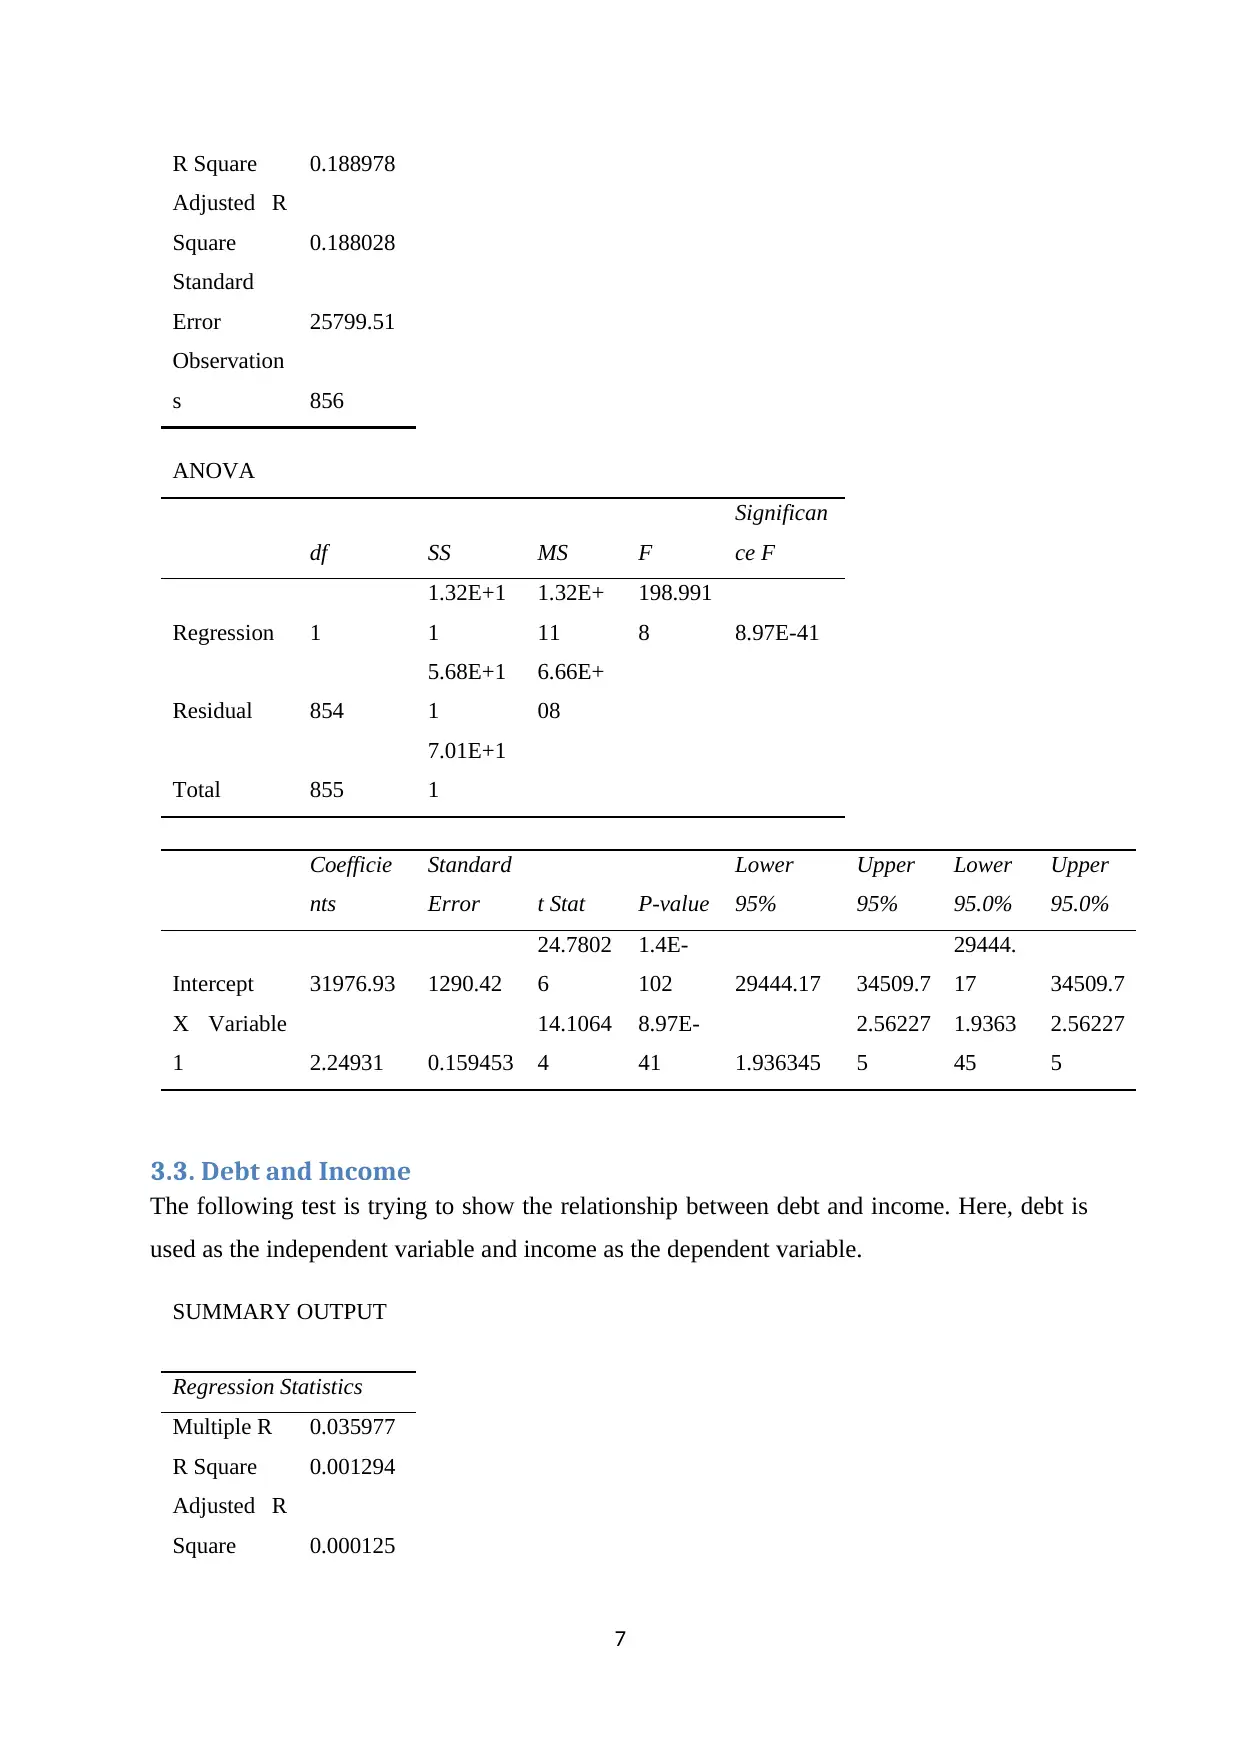
R Square 0.188978
Adjusted R
Square 0.188028
Standard
Error 25799.51
Observation
s 856
ANOVA
df SS MS F
Significan
ce F
Regression 1
1.32E+1
1
1.32E+
11
198.991
8 8.97E-41
Residual 854
5.68E+1
1
6.66E+
08
Total 855
7.01E+1
1
Coefficie
nts
Standard
Error t Stat P-value
Lower
95%
Upper
95%
Lower
95.0%
Upper
95.0%
Intercept 31976.93 1290.42
24.7802
6
1.4E-
102 29444.17 34509.7
29444.
17 34509.7
X Variable
1 2.24931 0.159453
14.1064
4
8.97E-
41 1.936345
2.56227
5
1.9363
45
2.56227
5
3.3. Debt and Income
The following test is trying to show the relationship between debt and income. Here, debt is
used as the independent variable and income as the dependent variable.
SUMMARY OUTPUT
Regression Statistics
Multiple R 0.035977
R Square 0.001294
Adjusted R
Square 0.000125
7
Adjusted R
Square 0.188028
Standard
Error 25799.51
Observation
s 856
ANOVA
df SS MS F
Significan
ce F
Regression 1
1.32E+1
1
1.32E+
11
198.991
8 8.97E-41
Residual 854
5.68E+1
1
6.66E+
08
Total 855
7.01E+1
1
Coefficie
nts
Standard
Error t Stat P-value
Lower
95%
Upper
95%
Lower
95.0%
Upper
95.0%
Intercept 31976.93 1290.42
24.7802
6
1.4E-
102 29444.17 34509.7
29444.
17 34509.7
X Variable
1 2.24931 0.159453
14.1064
4
8.97E-
41 1.936345
2.56227
5
1.9363
45
2.56227
5
3.3. Debt and Income
The following test is trying to show the relationship between debt and income. Here, debt is
used as the independent variable and income as the dependent variable.
SUMMARY OUTPUT
Regression Statistics
Multiple R 0.035977
R Square 0.001294
Adjusted R
Square 0.000125
7
Paraphrase This Document
Need a fresh take? Get an instant paraphrase of this document with our AI Paraphraser
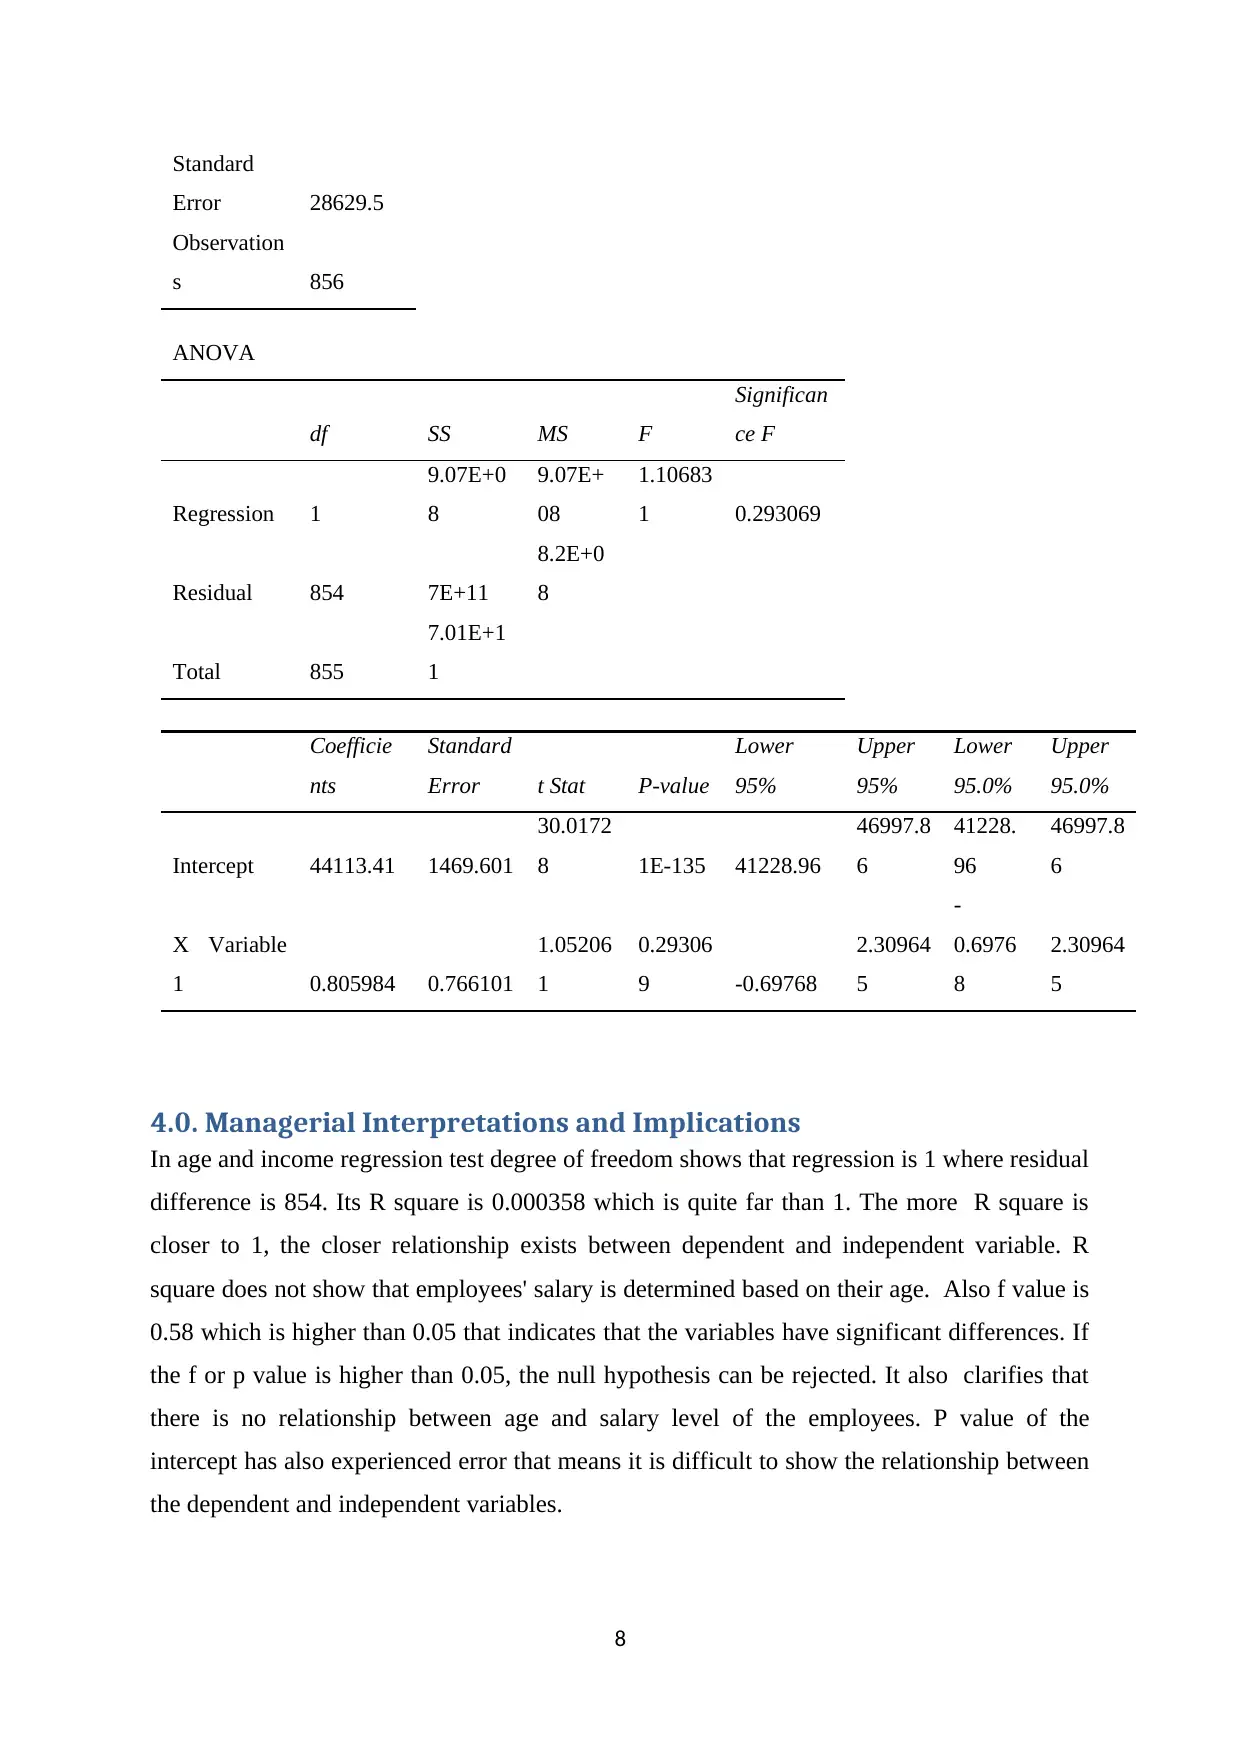
Standard
Error 28629.5
Observation
s 856
ANOVA
df SS MS F
Significan
ce F
Regression 1
9.07E+0
8
9.07E+
08
1.10683
1 0.293069
Residual 854 7E+11
8.2E+0
8
Total 855
7.01E+1
1
Coefficie
nts
Standard
Error t Stat P-value
Lower
95%
Upper
95%
Lower
95.0%
Upper
95.0%
Intercept 44113.41 1469.601
30.0172
8 1E-135 41228.96
46997.8
6
41228.
96
46997.8
6
X Variable
1 0.805984 0.766101
1.05206
1
0.29306
9 -0.69768
2.30964
5
-
0.6976
8
2.30964
5
4.0. Managerial Interpretations and Implications
In age and income regression test degree of freedom shows that regression is 1 where residual
difference is 854. Its R square is 0.000358 which is quite far than 1. The more R square is
closer to 1, the closer relationship exists between dependent and independent variable. R
square does not show that employees' salary is determined based on their age. Also f value is
0.58 which is higher than 0.05 that indicates that the variables have significant differences. If
the f or p value is higher than 0.05, the null hypothesis can be rejected. It also clarifies that
there is no relationship between age and salary level of the employees. P value of the
intercept has also experienced error that means it is difficult to show the relationship between
the dependent and independent variables.
8
The R square of car value and salary test is 0.188 which is also not close to 1. If the value
shows much more difference than 1, it can be said that null hypothesis is rejected or there is
no significant relationship between the variables. Also, both P value and F value got error.
They are forcefully brought together to see the relationship but statistically the relationship
has been rejected. Car value that the employees own and their salary do not resemble
because the result is error. If the F value and p value would be less than 0.05, and R square
would be close to 1, then it could be said that there is relationship between dependent and
independent variable.
Similarly, in debt and income variables regression test was carried out. The result shows that
R square is 0.001294 which is quite less than 1. Also F value is 0.29 which is higher than
0.05 and p value is error. These imperative information indicate that there the null hypothesis
cannot be accepted. Although both variables are compared together, they are not statistically
comparable. They do not have significant relationship which means to say that there is
nothing to do with employees debt to have their salary gap.
5.0. Conclusion and Recommendations
The result clearly rejects the relationship between dependent and independent variables. If
they do not have relationship, it cannot be found solution by brining changes in the trend of
those variables. Employees' age, car value and debt do not have relation in employees salary.
It means to say that these variables are not responsible to increase salary gap and de-
motivation of the employees. The salary gap cannot be justified based on these factors. The
management is aware about the salary gap but it has not solved the problem. If the gap would
be systematically justified, the employees would know it and they would be motivated to
follow the system. This analysis does not show any system of salary determining in relation
to those factors; so that, it would be better Aultra Pvt. Ltd. to determine reasonable salary
range for different positions. It could consider different types of attributes and skills to
determine the salary. Also, the market rate could also be another key determining factors of
the salary. Currently, there is huge difference between highest and lowest salary but it is
recommended to that such gap should minimised. Based on the skills and abilities, slightly
difference can be made which contributes to reduce employees' de-motivation level and helps
to explore their optimum potentialities.
9
⊘ This is a preview!⊘
Do you want full access?
Subscribe today to unlock all pages.
Trusted by 1+ million students worldwide

10
Paraphrase This Document
Need a fresh take? Get an instant paraphrase of this document with our AI Paraphraser

References
Knapp, H. (2017). Intermediate Statistics Using SPSS. London: SAGE Publications.
Peach, H. (2019). Mean, Median, Mode, Variance and Standard Deviation. London: IP.
Sen, A. and Srivastava, M. (2012). Regression Analysis: Theory, Method and Applications.
London: Springer.
(The End)
11
Knapp, H. (2017). Intermediate Statistics Using SPSS. London: SAGE Publications.
Peach, H. (2019). Mean, Median, Mode, Variance and Standard Deviation. London: IP.
Sen, A. and Srivastava, M. (2012). Regression Analysis: Theory, Method and Applications.
London: Springer.
(The End)
11
1 out of 11
Your All-in-One AI-Powered Toolkit for Academic Success.
+13062052269
info@desklib.com
Available 24*7 on WhatsApp / Email
![[object Object]](/_next/static/media/star-bottom.7253800d.svg)
Unlock your academic potential
Copyright © 2020–2026 A2Z Services. All Rights Reserved. Developed and managed by ZUCOL.