Management Accounting Report: Master Budget, Production Plan Analysis

Verified

Added on  2021/06/17

|16
|1993
|20
Report
AI Summary
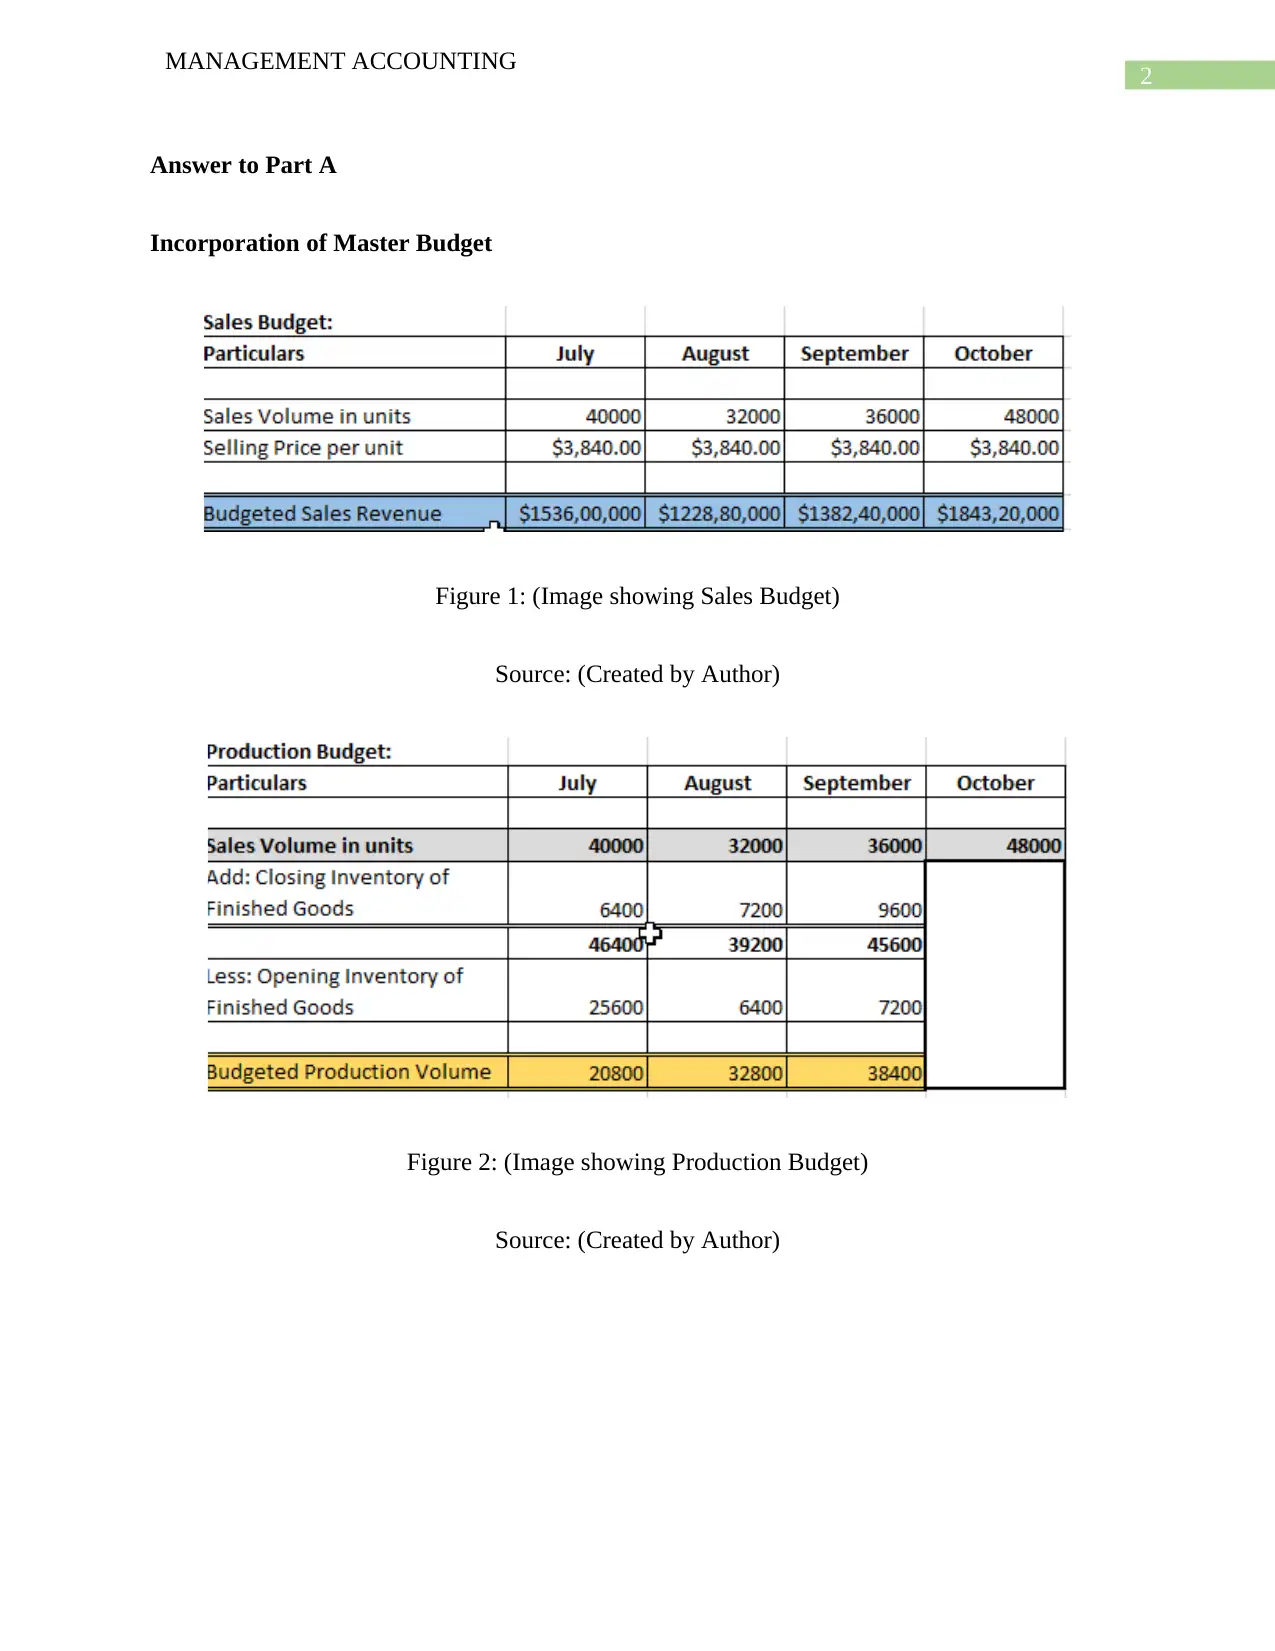
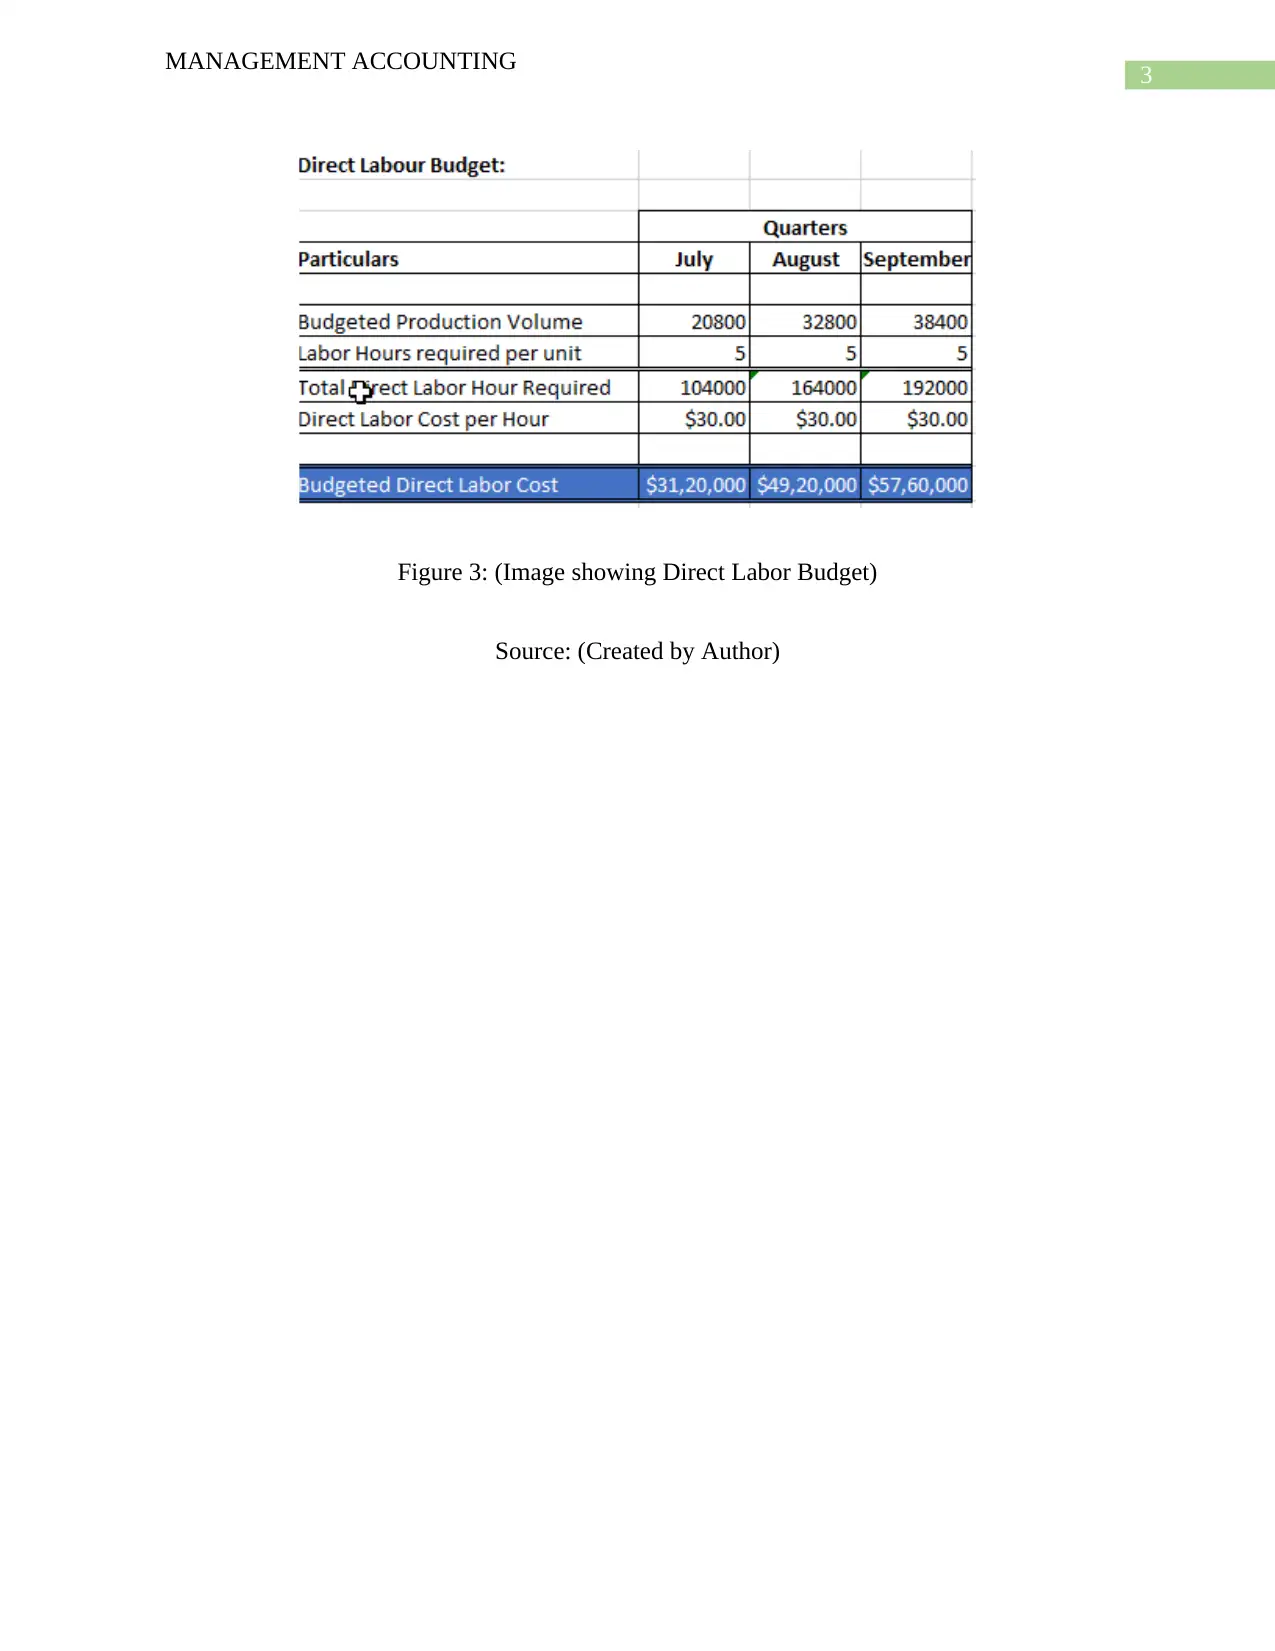
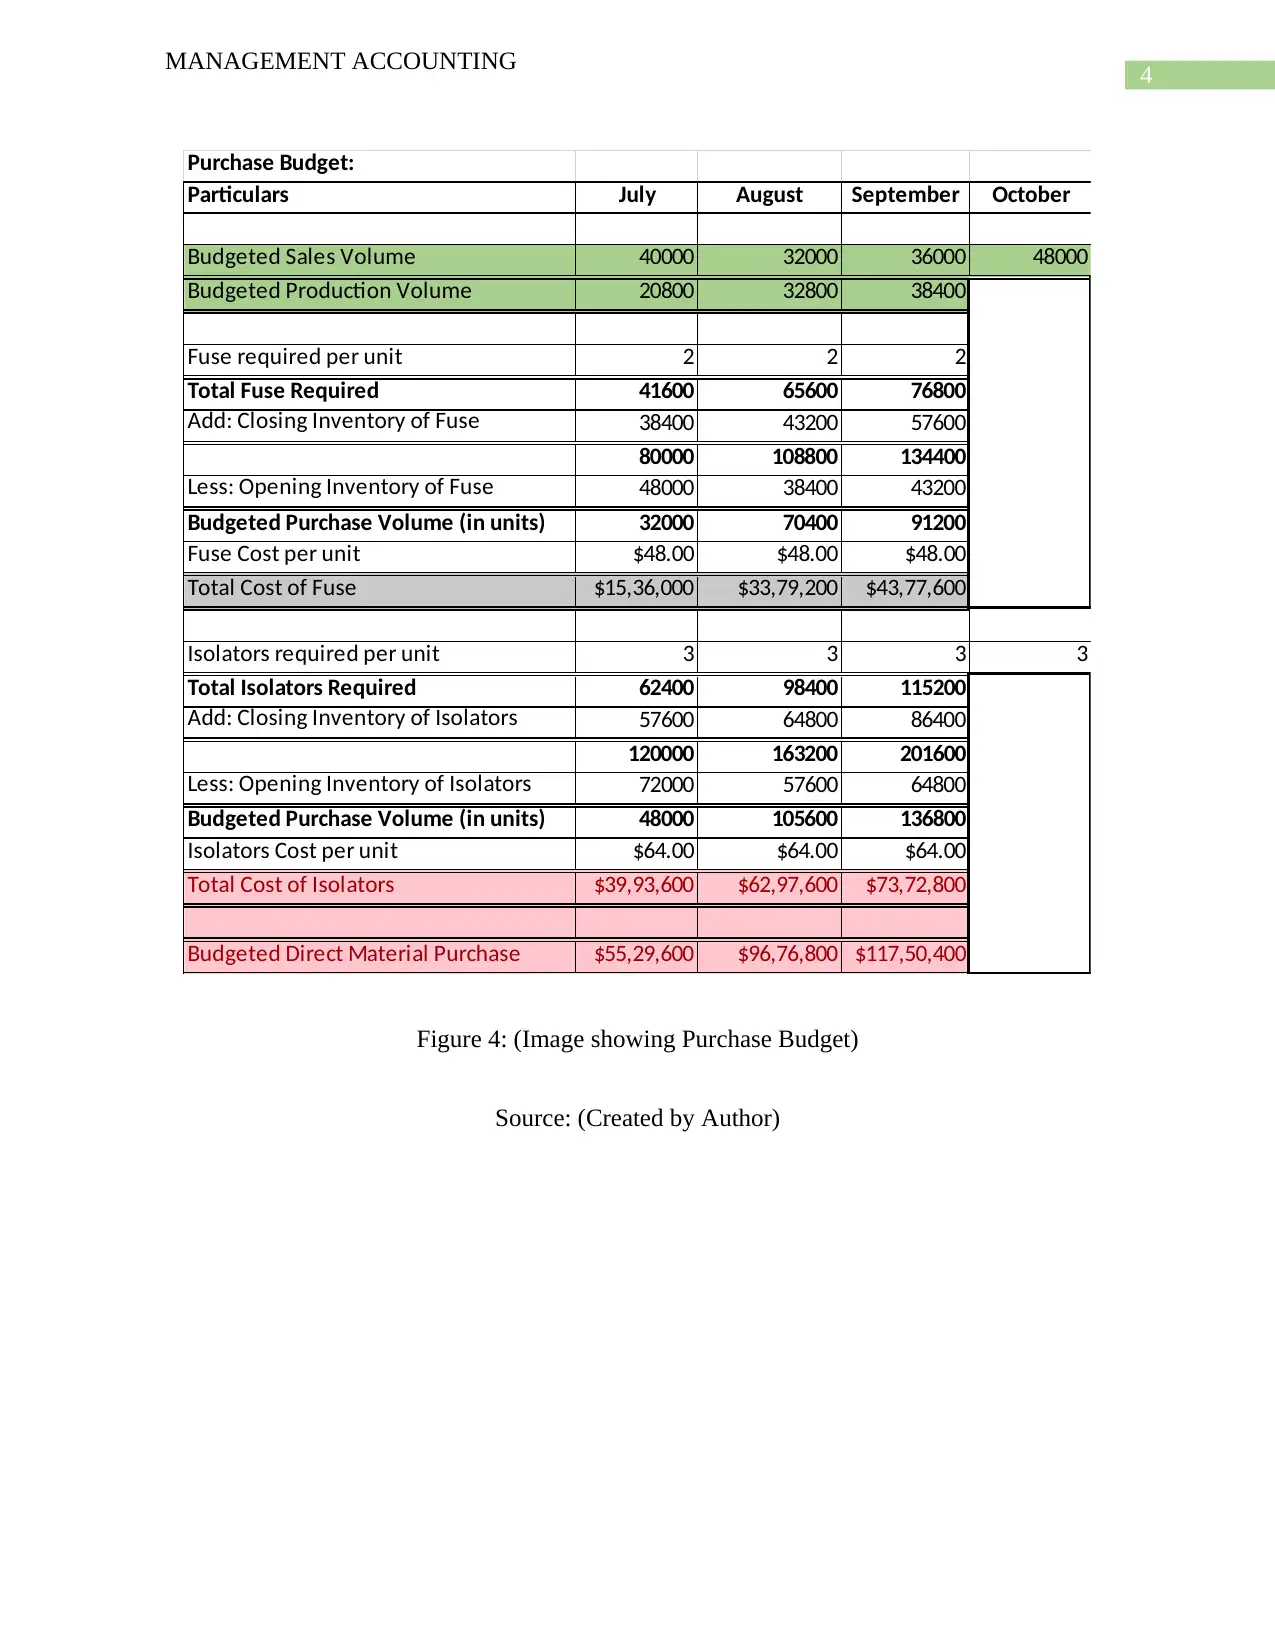
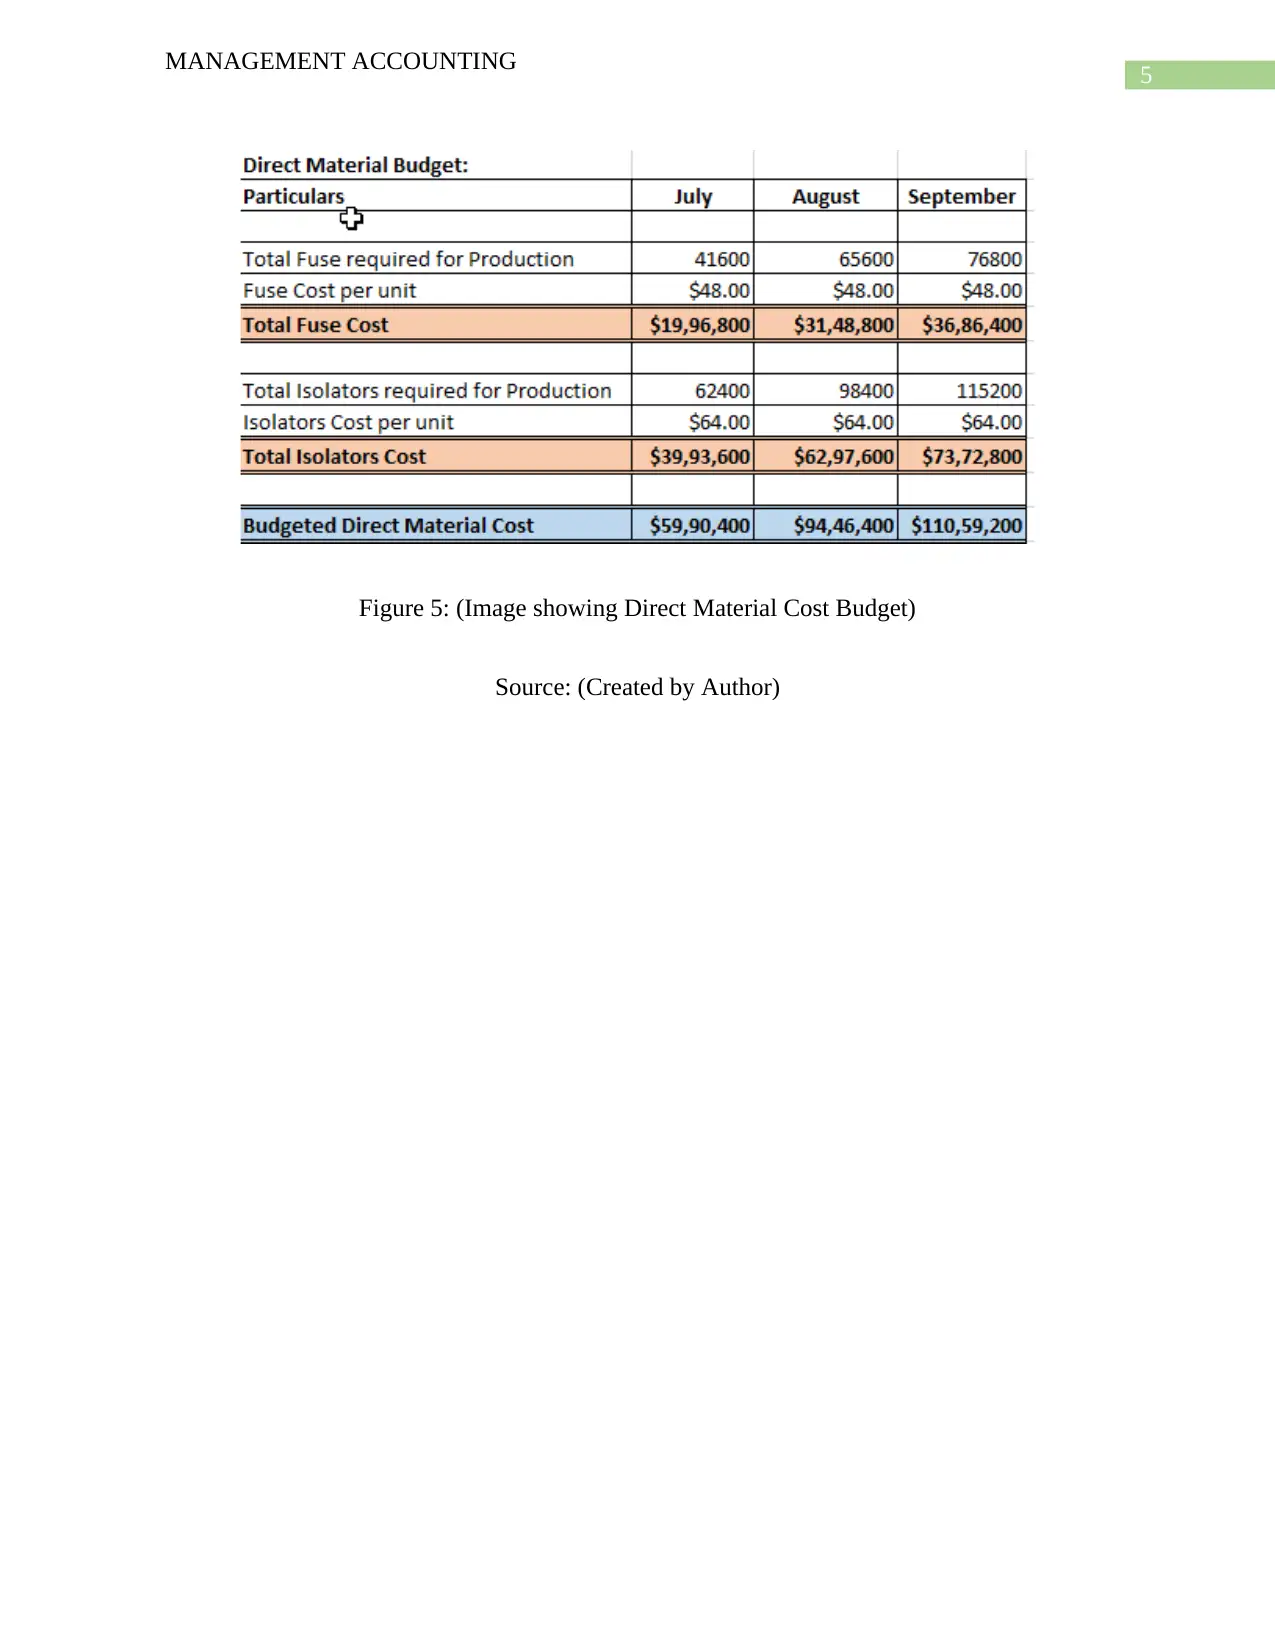
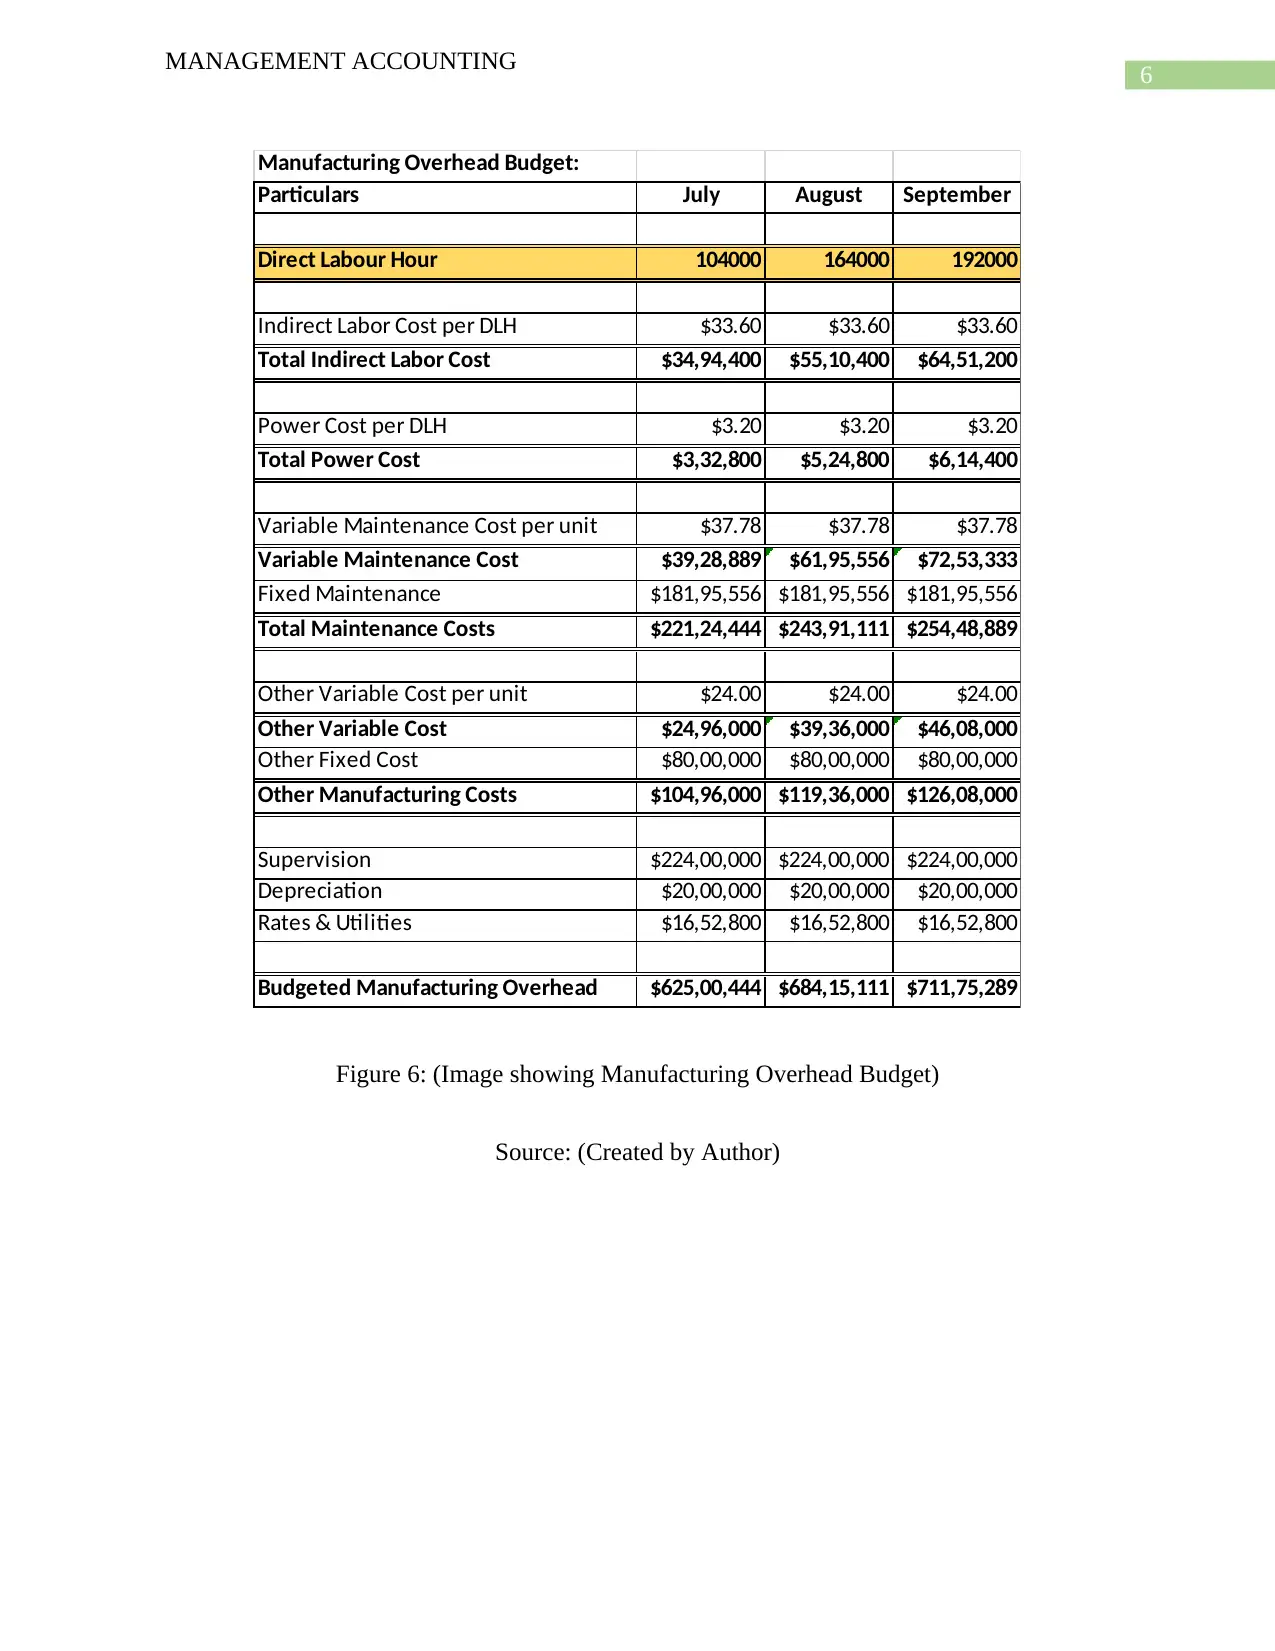
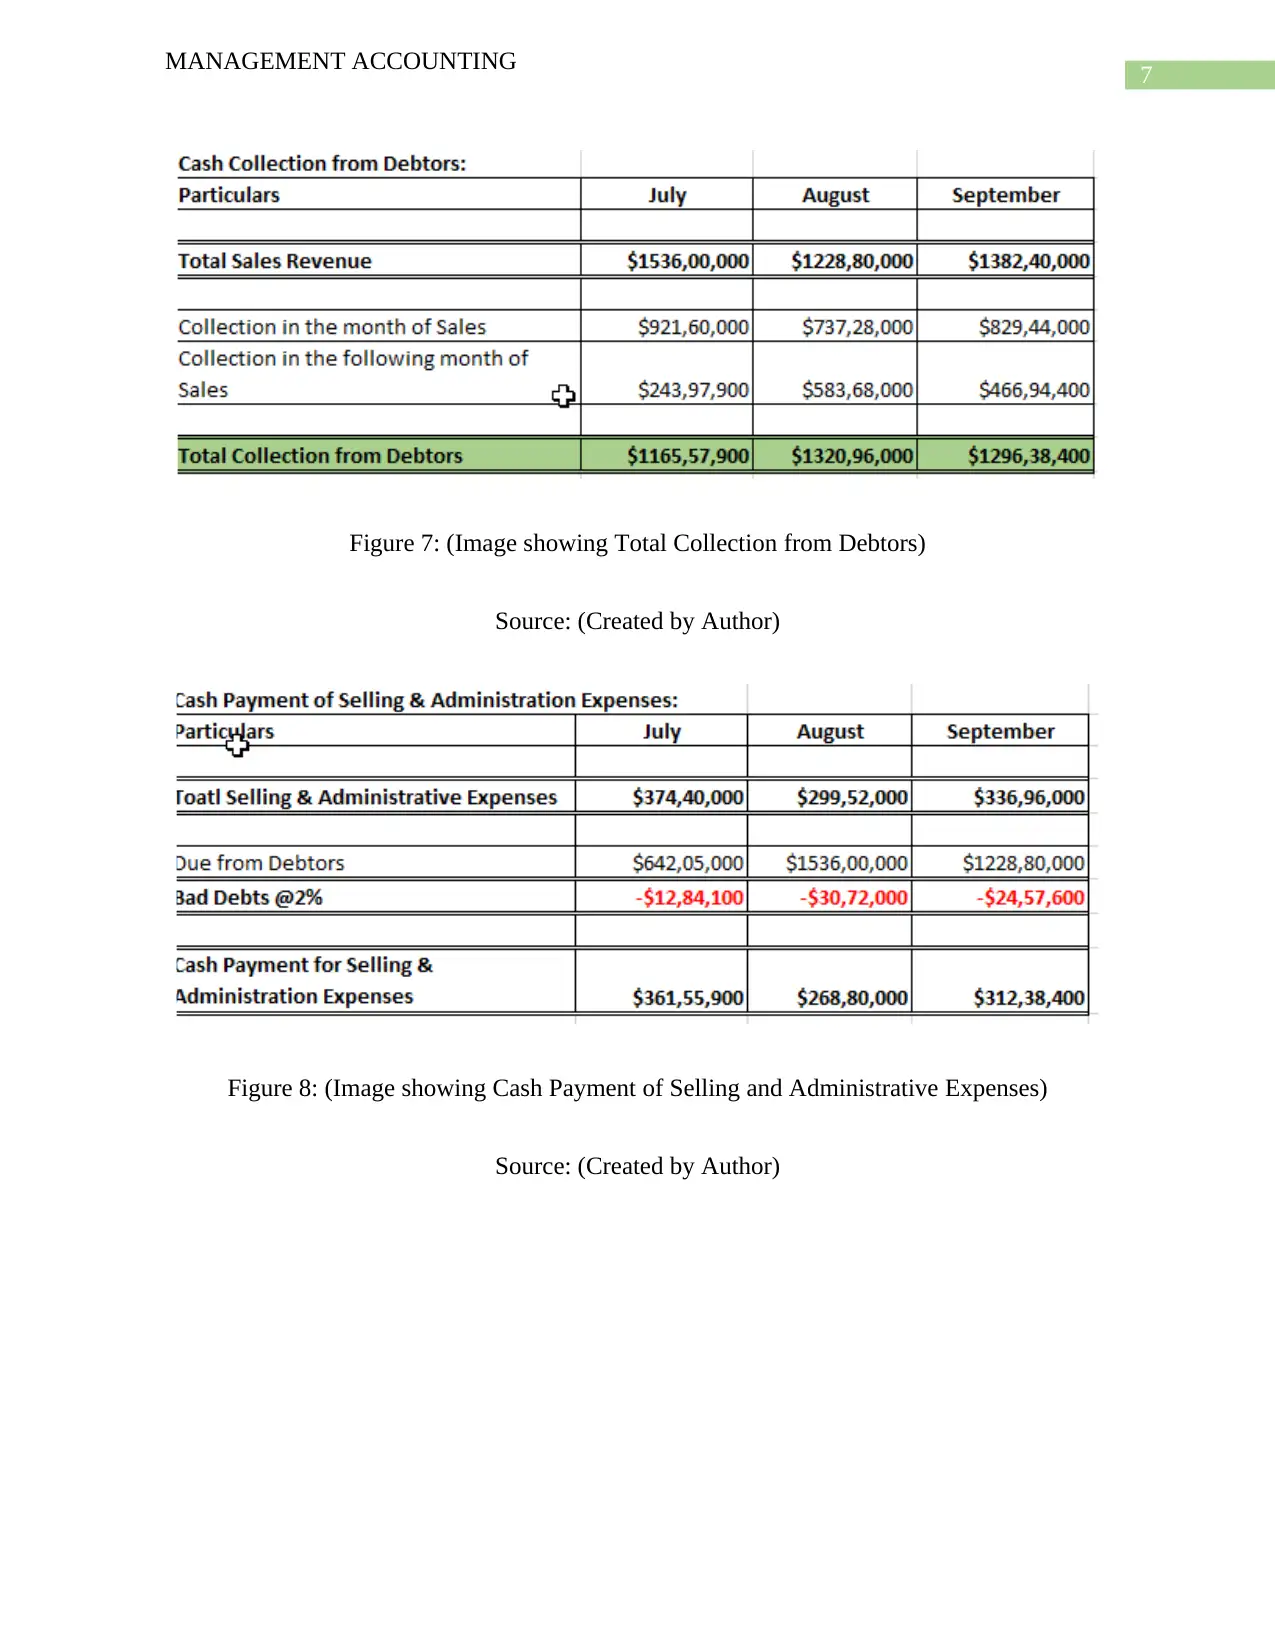
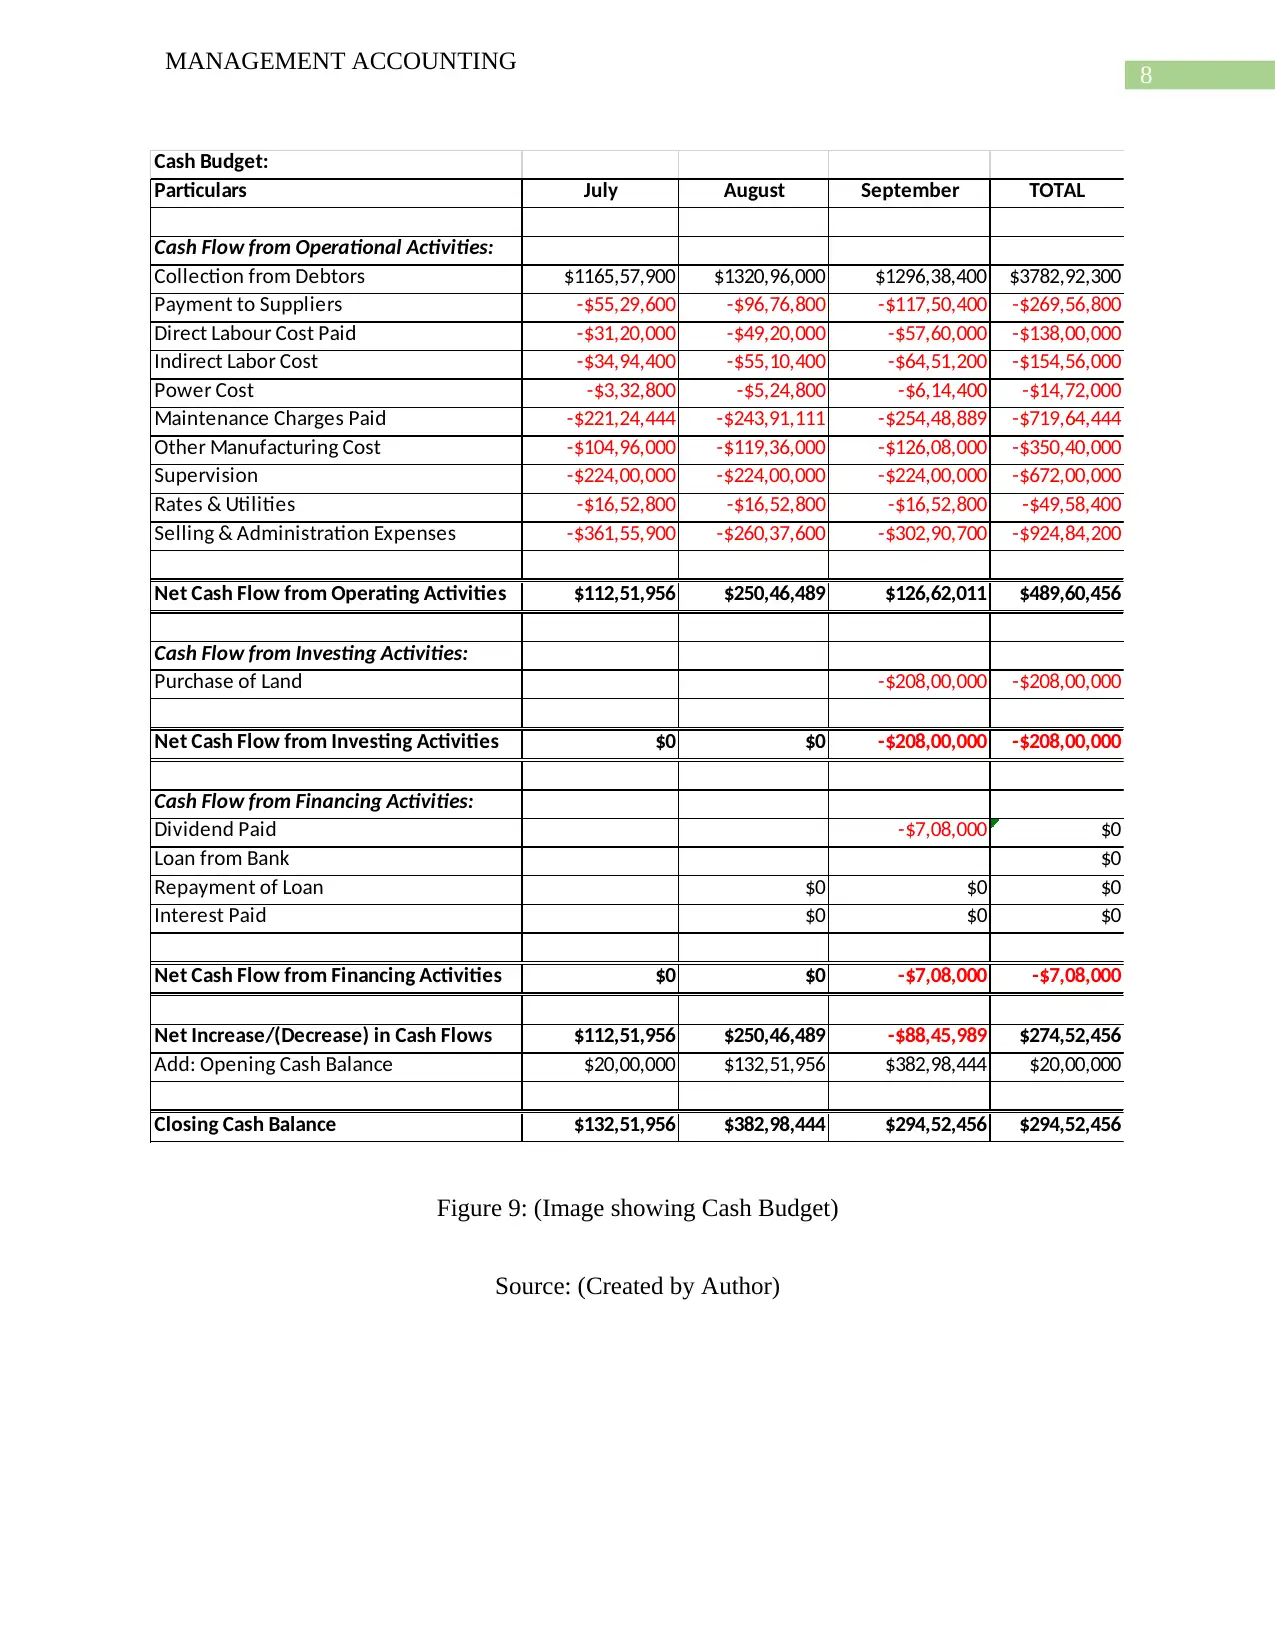
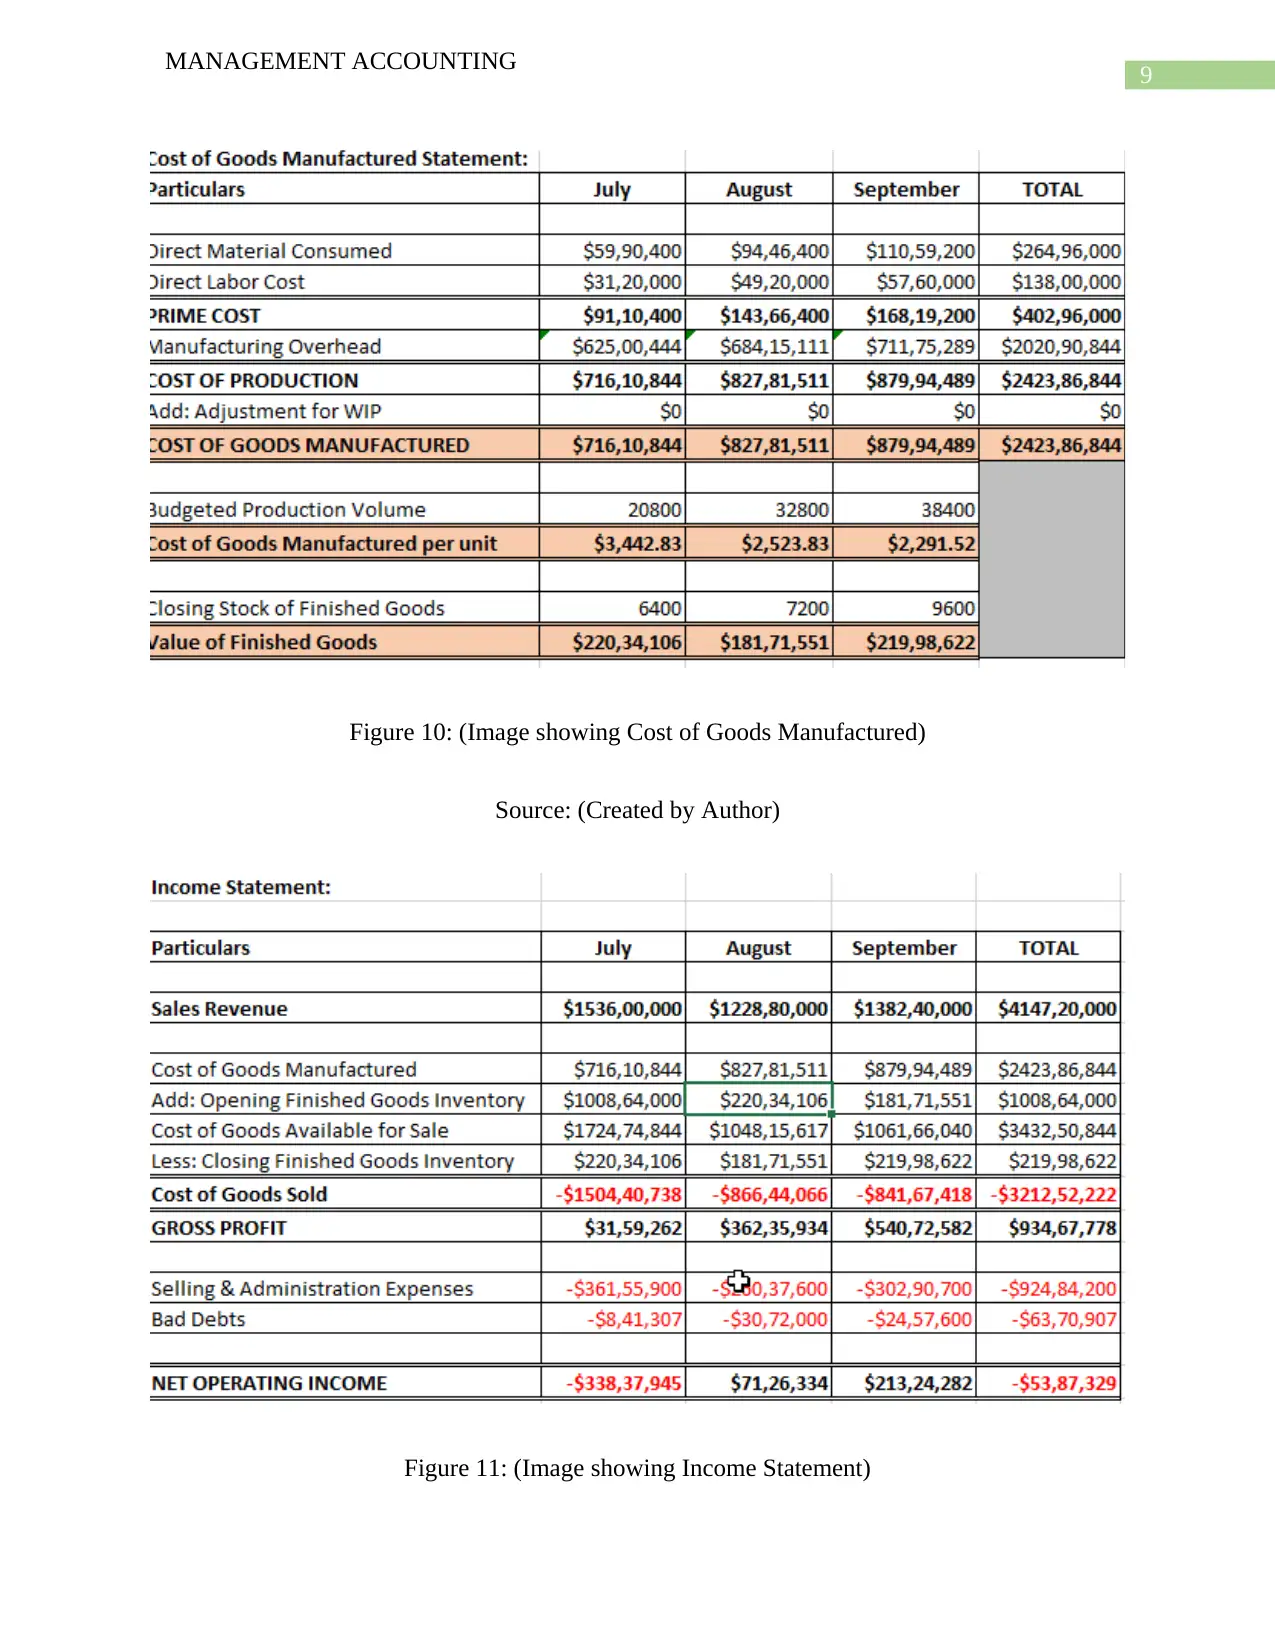
This management accounting report provides a detailed analysis of a company's production plan and budgetary processes. Part A focuses on the incorporation of a master budget, including sales, production, direct labor, purchase, direct material cost, manufacturing overhead, and cash budgets, culminating in an income statement. Part B analyzes a new production program, assessing its impact on production volume and costs, highlighting the use of budgetary approaches for cost and revenue estimation. The analysis includes key budget components like sales, production, direct labor, and manufacturing overhead. Part C compares and contrasts participative and imposed budgeting approaches, emphasizing the advantages of participative budgets in fostering employee collaboration and improving the quality of forecasts. The report recommends the adoption of a participative budget approach for the company, concluding with references to relevant academic literature.
Document Page
Running Head: MANAGEMENT ACCOUNTING
Management Accounting
Name of the Student:
Name of the University:
Author’s Note:
tabler-icon-diamond-filled.svg

Paraphrase This Document

Need a fresh take? Get an instant paraphrase of this document with our AI Paraphraser
Document Page
1
MANAGEMENT ACCOUNTING
Table of Contents
Answer to Part A.............................................................................................................................2
Incorporation of Master Budget...................................................................................................2
Answer to Part B............................................................................................................................10
Analysis of Production Plan......................................................................................................10
Answer to Part C............................................................................................................................13
Analysis of Participative and Imposed Budgets........................................................................13
Reference.......................................................................................................................................15
Document Page
2
MANAGEMENT ACCOUNTING
Answer to Part A
Incorporation of Master Budget
Figure 1: (Image showing Sales Budget)
Source: (Created by Author)
Figure 2: (Image showing Production Budget)
Source: (Created by Author)
Document Page
3
MANAGEMENT ACCOUNTING
Figure 3: (Image showing Direct Labor Budget)
Source: (Created by Author)
tabler-icon-diamond-filled.svg

Paraphrase This Document

Need a fresh take? Get an instant paraphrase of this document with our AI Paraphraser
Document Page
4
MANAGEMENT ACCOUNTING
Purchase Budget:
Particulars July August September October
Budgeted Sales Volume 40000 32000 36000 48000
Budgeted Production Volume 20800 32800 38400
Fuse required per unit 2 2 2
Total Fuse Required 41600 65600 76800
Add: Closing Inventory of Fuse 38400 43200 57600
80000 108800 134400
Less: Opening Inventory of Fuse 48000 38400 43200
Budgeted Purchase Volume (in units) 32000 70400 91200
Fuse Cost per unit $48.00 $48.00 $48.00
Total Cost of Fuse $15,36,000 $33,79,200 $43,77,600
Isolators required per unit 3 3 3 3
Total Isolators Required 62400 98400 115200
Add: Closing Inventory of Isolators 57600 64800 86400
120000 163200 201600
Less: Opening Inventory of Isolators 72000 57600 64800
Budgeted Purchase Volume (in units) 48000 105600 136800
Isolators Cost per unit $64.00 $64.00 $64.00
Total Cost of Isolators $39,93,600 $62,97,600 $73,72,800
Budgeted Direct Material Purchase $55,29,600 $96,76,800 $117,50,400
Figure 4: (Image showing Purchase Budget)
Source: (Created by Author)
Document Page
5
MANAGEMENT ACCOUNTING
Figure 5: (Image showing Direct Material Cost Budget)
Source: (Created by Author)
Document Page
6
MANAGEMENT ACCOUNTING
Manufacturing Overhead Budget:
Particulars July August September
Direct Labour Hour 104000 164000 192000
Indirect Labor Cost per DLH $33.60 $33.60 $33.60
Total Indirect Labor Cost $34,94,400 $55,10,400 $64,51,200
Power Cost per DLH $3.20 $3.20 $3.20
Total Power Cost $3,32,800 $5,24,800 $6,14,400
Variable Maintenance Cost per unit $37.78 $37.78 $37.78
Variable Maintenance Cost $39,28,889 $61,95,556 $72,53,333
Fixed Maintenance $181,95,556 $181,95,556 $181,95,556
Total Maintenance Costs $221,24,444 $243,91,111 $254,48,889
Other Variable Cost per unit $24.00 $24.00 $24.00
Other Variable Cost $24,96,000 $39,36,000 $46,08,000
Other Fixed Cost $80,00,000 $80,00,000 $80,00,000
Other Manufacturing Costs $104,96,000 $119,36,000 $126,08,000
Supervision $224,00,000 $224,00,000 $224,00,000
Depreciation $20,00,000 $20,00,000 $20,00,000
Rates & Utilities $16,52,800 $16,52,800 $16,52,800
Budgeted Manufacturing Overhead $625,00,444 $684,15,111 $711,75,289
Figure 6: (Image showing Manufacturing Overhead Budget)
Source: (Created by Author)
tabler-icon-diamond-filled.svg

Paraphrase This Document

Need a fresh take? Get an instant paraphrase of this document with our AI Paraphraser
Document Page
7
MANAGEMENT ACCOUNTING
Figure 7: (Image showing Total Collection from Debtors)
Source: (Created by Author)
Figure 8: (Image showing Cash Payment of Selling and Administrative Expenses)
Source: (Created by Author)
Document Page
8
MANAGEMENT ACCOUNTING
Cash Budget:
Particulars July August September TOTAL
Cash Flow from Operational Activities:
Collection from Debtors $1165,57,900 $1320,96,000 $1296,38,400 $3782,92,300
Payment to Suppliers -$55,29,600 -$96,76,800 -$117,50,400 -$269,56,800
Direct Labour Cost Paid -$31,20,000 -$49,20,000 -$57,60,000 -$138,00,000
Indirect Labor Cost -$34,94,400 -$55,10,400 -$64,51,200 -$154,56,000
Power Cost -$3,32,800 -$5,24,800 -$6,14,400 -$14,72,000
Maintenance Charges Paid -$221,24,444 -$243,91,111 -$254,48,889 -$719,64,444
Other Manufacturing Cost -$104,96,000 -$119,36,000 -$126,08,000 -$350,40,000
Supervision -$224,00,000 -$224,00,000 -$224,00,000 -$672,00,000
Rates & Utilities -$16,52,800 -$16,52,800 -$16,52,800 -$49,58,400
Selling & Administration Expenses -$361,55,900 -$260,37,600 -$302,90,700 -$924,84,200
Net Cash Flow from Operating Activities $112,51,956 $250,46,489 $126,62,011 $489,60,456
Cash Flow from Investing Activities:
Purchase of Land -$208,00,000 -$208,00,000
Net Cash Flow from Investing Activities $0 $0 -$208,00,000 -$208,00,000
Cash Flow from Financing Activities:
Dividend Paid -$7,08,000 $0
Loan from Bank $0
Repayment of Loan $0 $0 $0
Interest Paid $0 $0 $0
Net Cash Flow from Financing Activities $0 $0 -$7,08,000 -$7,08,000
Net Increase/(Decrease) in Cash Flows $112,51,956 $250,46,489 -$88,45,989 $274,52,456
Add: Opening Cash Balance $20,00,000 $132,51,956 $382,98,444 $20,00,000
Closing Cash Balance $132,51,956 $382,98,444 $294,52,456 $294,52,456
Figure 9: (Image showing Cash Budget)
Source: (Created by Author)
Document Page
9
MANAGEMENT ACCOUNTING
Figure 10: (Image showing Cost of Goods Manufactured)
Source: (Created by Author)
Figure 11: (Image showing Income Statement)
tabler-icon-diamond-filled.svg

Paraphrase This Document

Need a fresh take? Get an instant paraphrase of this document with our AI Paraphraser
Document Page
10
MANAGEMENT ACCOUNTING
Source: (Created by Author)
Answer to Part B
Analysis of Production Plan
As per the requirement of the part, the production manager intends to introduce a new
production program which can adhere to all the needs of the organization and there ensure that
there is growth in the production volume of the business. The production plan is intended to
increase the production capacity of the business and thereby also increase the revenues which are
associated with the business. The production plan of the business is intended to combat the rising
costs which are associated with the business and also increase the overall sales of the business.
The management in order to estimate the costs and revenues which are associated with the
production program has decided to adopt budgetary approach where the management can easily
estimate the cost and revenues which the business can earn (Ríos, Bastida and Benito 2016). The
management is planning to prepare a master budget. A master Budget is the aggregate of all
budgets which are usually prepared in an organization and includes additionally cash budgets,
financial plans and statement of estimated income. A master Budget is prepared generally for a
quarter or on a month’s basis so that all activities of the business can be monitored and directed
towards the achievement of the common goal of the company (Lawson et al. 2015). The
components of the master budgets which are prepared for the analysis of the production plan is
discussed below in the coming paragraphs
The sale budget which is included in the master budget shows for the quarter beginning
on July and ending on September. The sales volume which is anticipated shows that the sales
units will fall in August in comparison to the month of July. Again, the sales volume has
Document Page
11
MANAGEMENT ACCOUNTING
increased in both the months of September and October. The sale price is kept constant as
appropriate changes in prices is difficult to estimate. The budgeted sales revenue of the company
is anticipated to increase from $ 1536,00,000 in July to about $ 1843,20,000 in the month of
October. As the sales of the business is estimated during the quarter the production volume must
also be increased to meet the requirements of sales as anticipated in the budget. The budgeted
production volume is expected to increase from 20800 units in July to 38400 units in the month
of September. In such a budget production estimate considers the closing stock of inventory and
also opening stock of inventory for arriving at the total production which is estimated to be
achieved by the company. The direct labour budget shows that the budgeted labour cost for the
month of September is highest which clearly shows that that the business estimates that the cost
relating to direct budget is expected to increase in the month of September. As the production
volume is increasing it is quite eminent that the direct material cost, direct labour cost and
variable overhead costs which all forms under variable expenses will be rising. As shown in the
direct labour budget that the total direct labour hour has increases from August which was
164000 hours to about 192000 hours in September. The direct labor cost which is anticipated by
the business has increased from the month of august which is shown as $ 57,60,000 in the month
of September. The purchase budget which is included in the master budget shows that the
business is will be requiring materials such as fuse, Isolators. As per the direct material budget,
the total fuse cost and total isolators cost forms part of the total budgeted direct material costs as
shown in the budget. The budgeted direct material cost as shown is $ 110,59,200 for the month
of September which is estimated to be highest during the quarter. The budgeted direct material
cost for the month of August is estimated to be $ 94,46,400.
chevron_up_icon
1 out of 16
circle_padding
hide_on_mobile
zoom_out_icon
[object Object]