Management Accounting Report: Jeffery and Son's Case Study Analysis
VerifiedAdded on 2020/01/28
|23
|6068
|71
Report
AI Summary
This report provides a comprehensive analysis of management accounting principles, focusing on cost classification, job costing, and absorption costing techniques. The report uses a case study of Jeffery and Son's to illustrate these concepts, calculating unit and total job costs. It further explores the purpose and nature of the budgeting process, including the preparation of different types of budgets and a cash budget. The report also delves into variance analysis, preparing a reconciliation operating statement and offering findings to management in accordance with identified responsibility centers. The analysis includes different types of cost classification based on element, function, nature, and behavior. The report also prepares a cost report, analyzing variances between budgeted and actual costs, and suggests ways to reduce costs and enhance value and quality. Overall, the report offers a practical application of management accounting concepts and provides insights into decision-making related to pricing strategies and cost management.
Management Accounting
Table of Contents
Table of Contents
Paraphrase This Document
Need a fresh take? Get an instant paraphrase of this document with our AI Paraphraser
INTRODUCTION...........................................................................................................................4
TASK 1............................................................................................................................................4
1.1 Different types of cost classification.....................................................................................4
1.2 Calculating Unit cost and total job cost.................................................................................5
1.3 Calculating cost of Exquisite using absorption costing technique........................................5
1.4 Analyzing cost of Exquisite...................................................................................................7
TASK 2............................................................................................................................................8
2.1 Preparing and analyzing cost report.......................................................................................8
2.2 Using performance indicators to identify areas for potential improvement..........................9
2.3 Ways to reduce cost and enhance value, quality.................................................................10
Task 3.............................................................................................................................................11
3.1 Purpose and nature of budgeting process............................................................................11
3.2 Selecting appropriate budgeting methods for organization.................................................11
3.3 Preparation of different types of budget..............................................................................12
3.4 Preparing of cash budget......................................................................................................13
TASK 4..........................................................................................................................................15
4.1 Calculating of variance........................................................................................................15
4.2 Preparing of reconciliation operating statement..................................................................16
4.3 Findings to management in accordance with identified responsibility centers...................16
CONCLUSION..............................................................................................................................17
REFERENCES..............................................................................................................................18
2
INTRODUCTION
Management accounting is a crucial aspect by which management can keep detail record
related to accounting information and accordingly, they can take decisions related to pricing
strategies. It is also extended in three areas such as strategic, performance and risk management
which provide support to business in order to determine secure position in the marketplace. The
present report is based on the case study of Jeffery and Son's which produces many popular and
branded products (Weygandt and et. al., 2009). This has basically two departments such as
service (stores and Maintenance) and production. In this regard, classification of cost has been
done on the basis of element, function, nature and behavior. Further, unit cost and total cost have
been calculated by using job costing method. In addition to this, purpose and nature of budgeting
process are also explained.
TASK 1
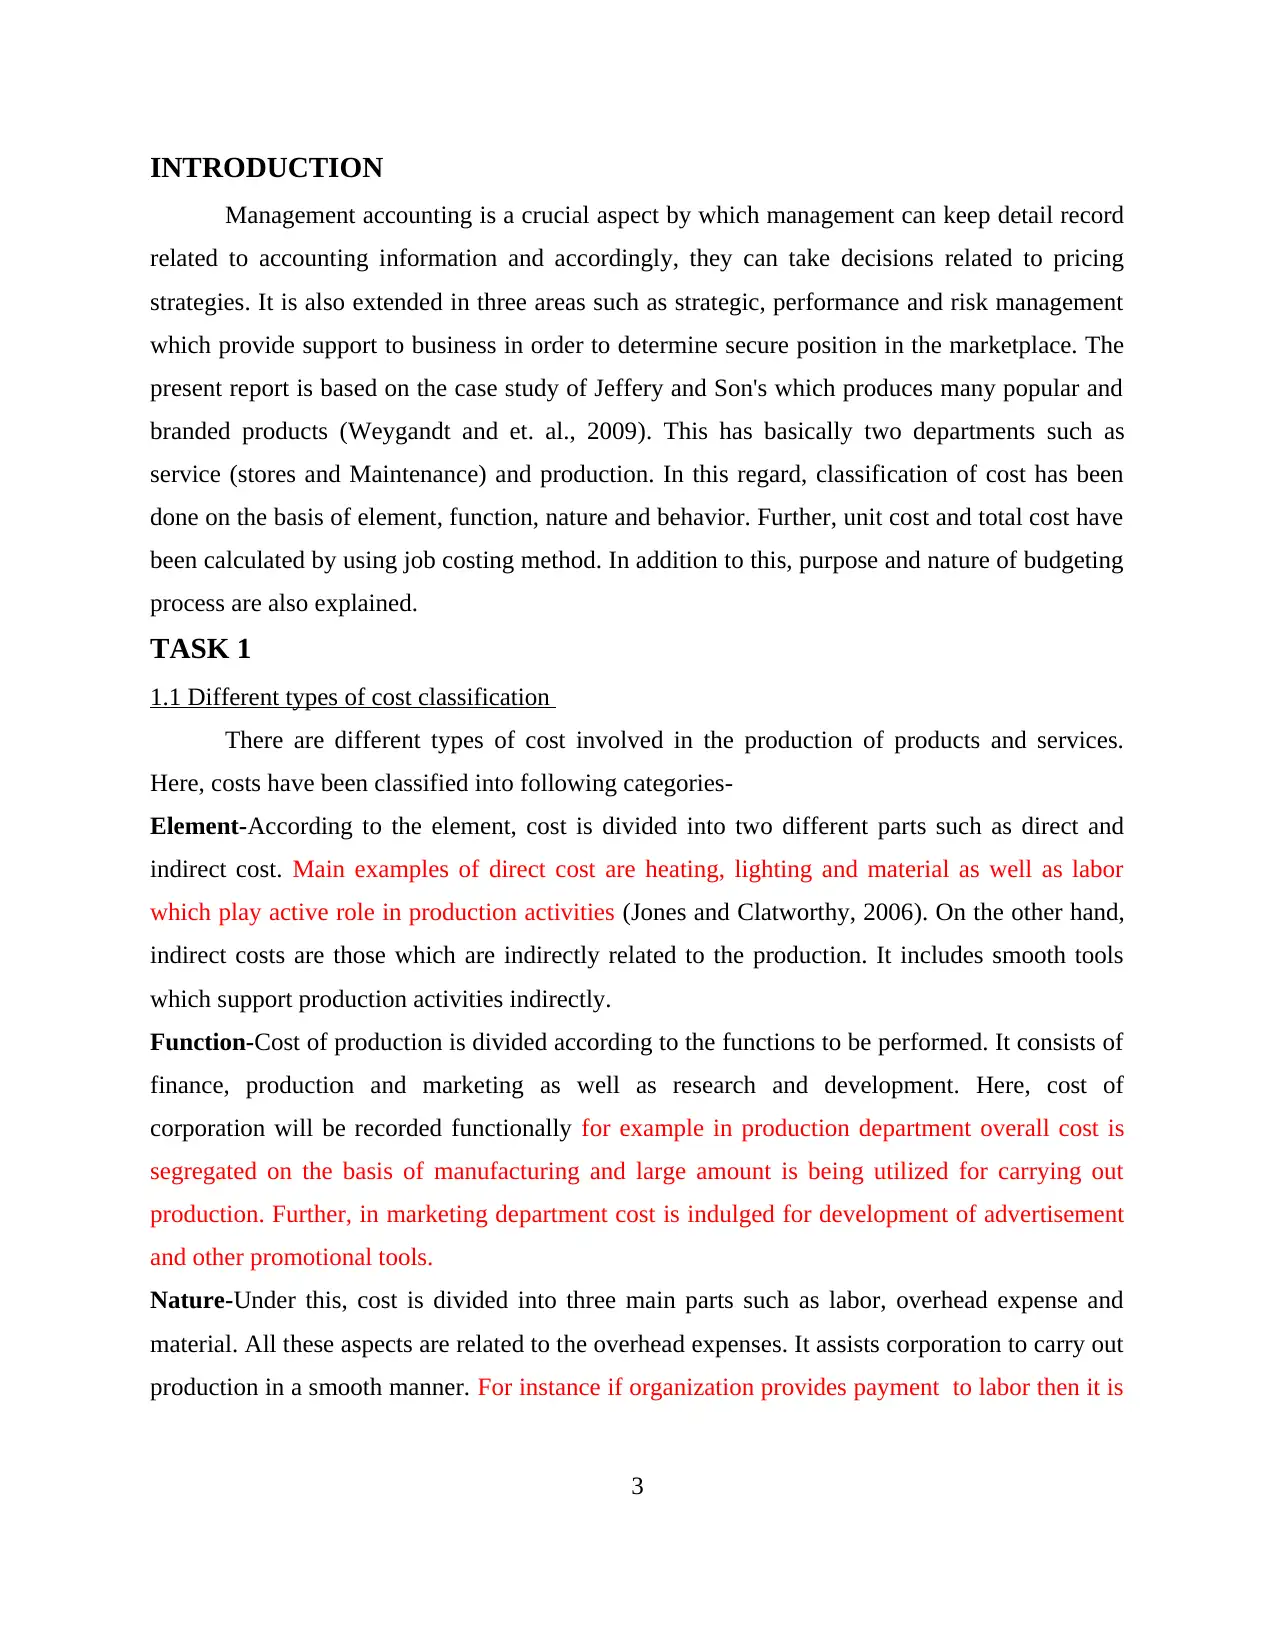
1.1 Different types of cost classification
There are different types of cost involved in the production of products and services.
Here, costs have been classified into following categories-
Element-According to the element, cost is divided into two different parts such as direct and
indirect cost. Main examples of direct cost are heating, lighting and material as well as labor
which play active role in production activities (Jones and Clatworthy, 2006). On the other hand,
indirect costs are those which are indirectly related to the production. It includes smooth tools
which support production activities indirectly.
Function-Cost of production is divided according to the functions to be performed. It consists of
finance, production and marketing as well as research and development. Here, cost of
corporation will be recorded functionally for example in production department overall cost is
segregated on the basis of manufacturing and large amount is being utilized for carrying out
production. Further, in marketing department cost is indulged for development of advertisement
and other promotional tools.
Nature-Under this, cost is divided into three main parts such as labor, overhead expense and
material. All these aspects are related to the overhead expenses. It assists corporation to carry out
production in a smooth manner. For instance if organization provides payment to labor then it is
3
Management accounting is a crucial aspect by which management can keep detail record
related to accounting information and accordingly, they can take decisions related to pricing
strategies. It is also extended in three areas such as strategic, performance and risk management
which provide support to business in order to determine secure position in the marketplace. The
present report is based on the case study of Jeffery and Son's which produces many popular and
branded products (Weygandt and et. al., 2009). This has basically two departments such as
service (stores and Maintenance) and production. In this regard, classification of cost has been
done on the basis of element, function, nature and behavior. Further, unit cost and total cost have
been calculated by using job costing method. In addition to this, purpose and nature of budgeting
process are also explained.
TASK 1
1.1 Different types of cost classification
There are different types of cost involved in the production of products and services.
Here, costs have been classified into following categories-
Element-According to the element, cost is divided into two different parts such as direct and
indirect cost. Main examples of direct cost are heating, lighting and material as well as labor
which play active role in production activities (Jones and Clatworthy, 2006). On the other hand,
indirect costs are those which are indirectly related to the production. It includes smooth tools
which support production activities indirectly.
Function-Cost of production is divided according to the functions to be performed. It consists of
finance, production and marketing as well as research and development. Here, cost of
corporation will be recorded functionally for example in production department overall cost is
segregated on the basis of manufacturing and large amount is being utilized for carrying out
production. Further, in marketing department cost is indulged for development of advertisement
and other promotional tools.
Nature-Under this, cost is divided into three main parts such as labor, overhead expense and
material. All these aspects are related to the overhead expenses. It assists corporation to carry out
production in a smooth manner. For instance if organization provides payment to labor then it is
3
⊘ This is a preview!⊘
Do you want full access?
Subscribe today to unlock all pages.
Trusted by 1+ million students worldwide
considered as cost for the business and cost of purchasing material for production shows the
nature of cost. Here, cost of all the elements are differ from each other which in turn contribute
towards carry out business activities effectively (Cohen and Kaimenaki, 2011).
Behaviour- As per the behavior, cost is segregated into three parts such as fixed, variables and
semi variable. The semi variable cost is like telephone bill whereas fixed cost remains constant
throughout the flow of production. In addition to this, variable cost consists of material and labor
which change in accordance with the volume of production.
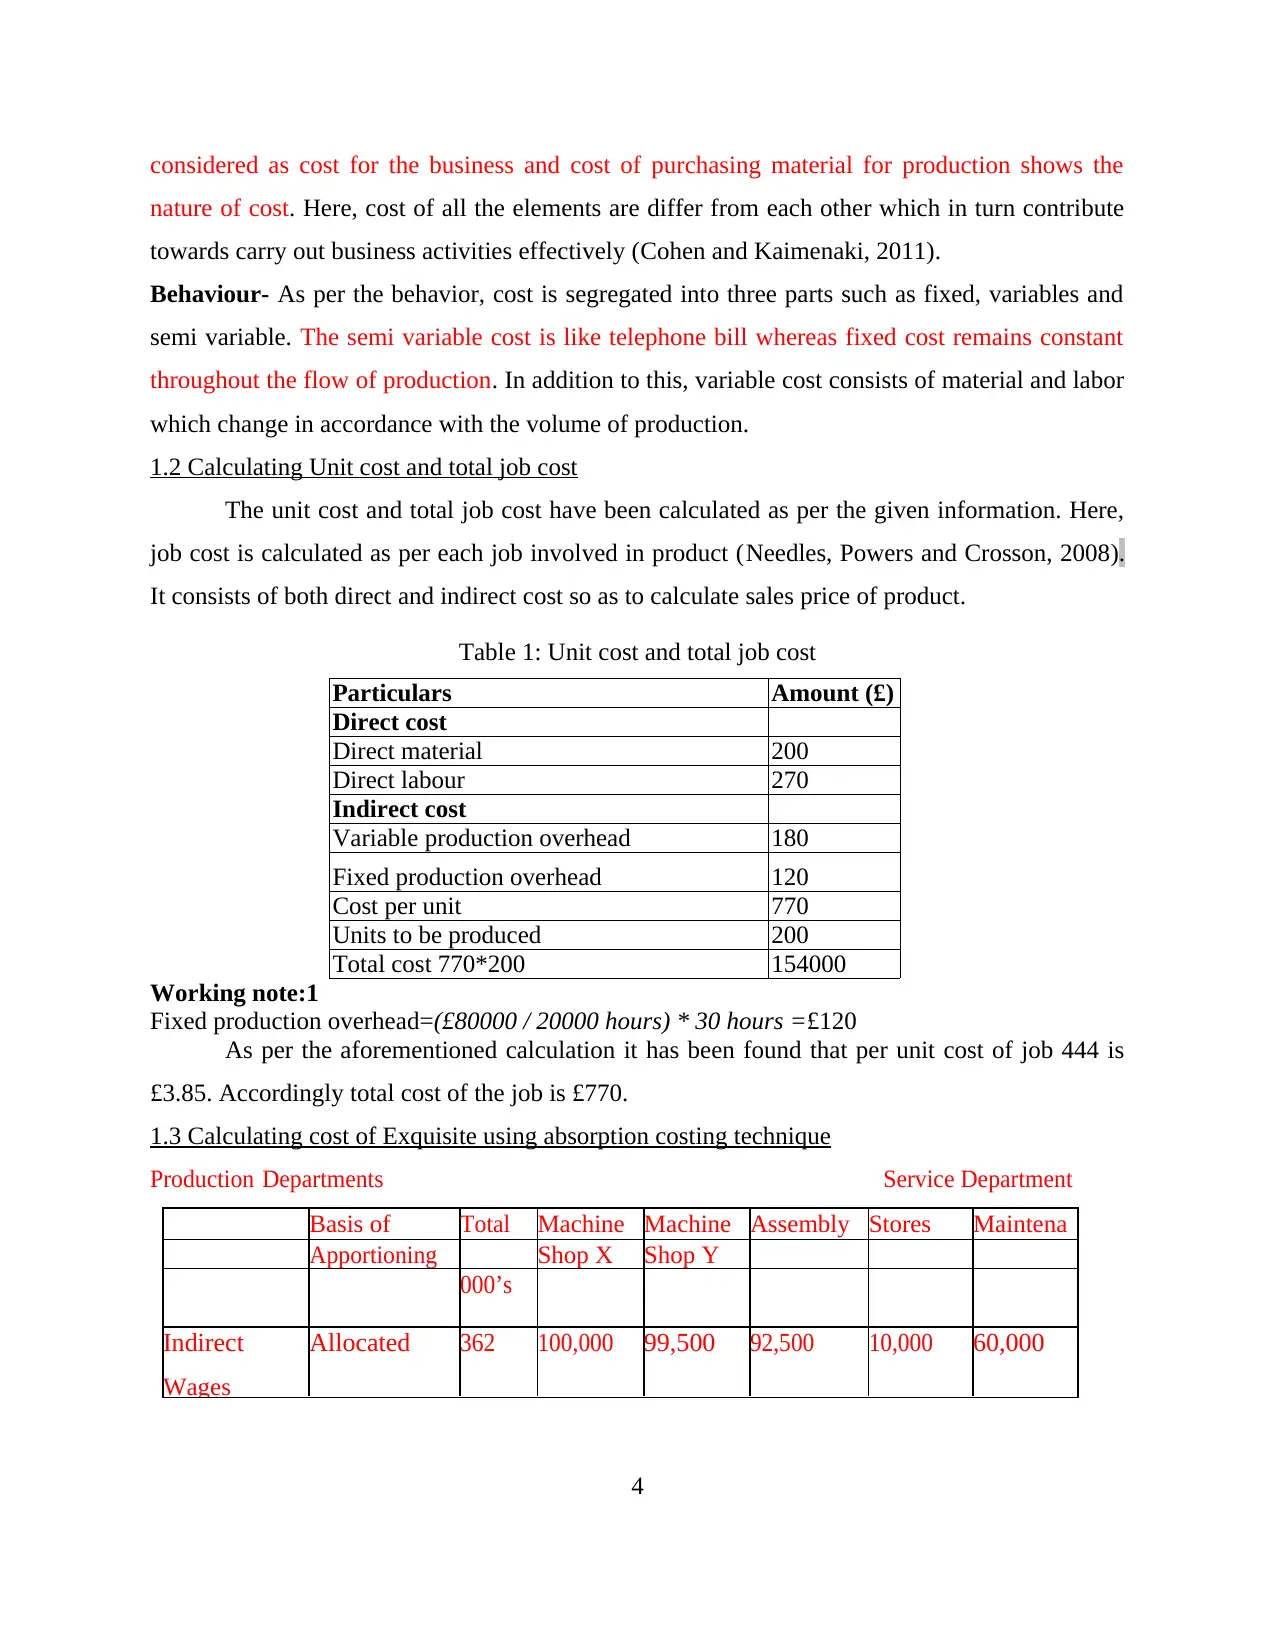
1.2 Calculating Unit cost and total job cost
The unit cost and total job cost have been calculated as per the given information. Here,
job cost is calculated as per each job involved in product (Needles, Powers and Crosson, 2008).
It consists of both direct and indirect cost so as to calculate sales price of product.
Table 1: Unit cost and total job cost
Particulars Amount (£)
Direct cost
Direct material 200
Direct labour 270
Indirect cost
Variable production overhead 180
Fixed production overhead 120
Cost per unit 770
Units to be produced 200
Total cost 770*200 154000
Working note:1
Fixed production overhead=(£80000 / 20000 hours) * 30 hours =£120
As per the aforementioned calculation it has been found that per unit cost of job 444 is
£3.85. Accordingly total cost of the job is £770.
1.3 Calculating cost of Exquisite using absorption costing technique
Production Departments Service Department
Basis of Total Machine Machine Assembly Stores Maintena
nceApportioning Shop X Shop Y
000’s
Indirect
Wages
Allocated 362 100,000 99,500 92,500 10,000 60,000
4
nature of cost. Here, cost of all the elements are differ from each other which in turn contribute
towards carry out business activities effectively (Cohen and Kaimenaki, 2011).
Behaviour- As per the behavior, cost is segregated into three parts such as fixed, variables and
semi variable. The semi variable cost is like telephone bill whereas fixed cost remains constant
throughout the flow of production. In addition to this, variable cost consists of material and labor
which change in accordance with the volume of production.
1.2 Calculating Unit cost and total job cost
The unit cost and total job cost have been calculated as per the given information. Here,
job cost is calculated as per each job involved in product (Needles, Powers and Crosson, 2008).
It consists of both direct and indirect cost so as to calculate sales price of product.
Table 1: Unit cost and total job cost
Particulars Amount (£)
Direct cost
Direct material 200
Direct labour 270
Indirect cost
Variable production overhead 180
Fixed production overhead 120
Cost per unit 770
Units to be produced 200
Total cost 770*200 154000
Working note:1
Fixed production overhead=(£80000 / 20000 hours) * 30 hours =£120
As per the aforementioned calculation it has been found that per unit cost of job 444 is
£3.85. Accordingly total cost of the job is £770.
1.3 Calculating cost of Exquisite using absorption costing technique
Production Departments Service Department
Basis of Total Machine Machine Assembly Stores Maintena
nceApportioning Shop X Shop Y
000’s
Indirect
Wages
Allocated 362 100,000 99,500 92,500 10,000 60,000
4
Paraphrase This Document
Need a fresh take? Get an instant paraphrase of this document with our AI Paraphraser
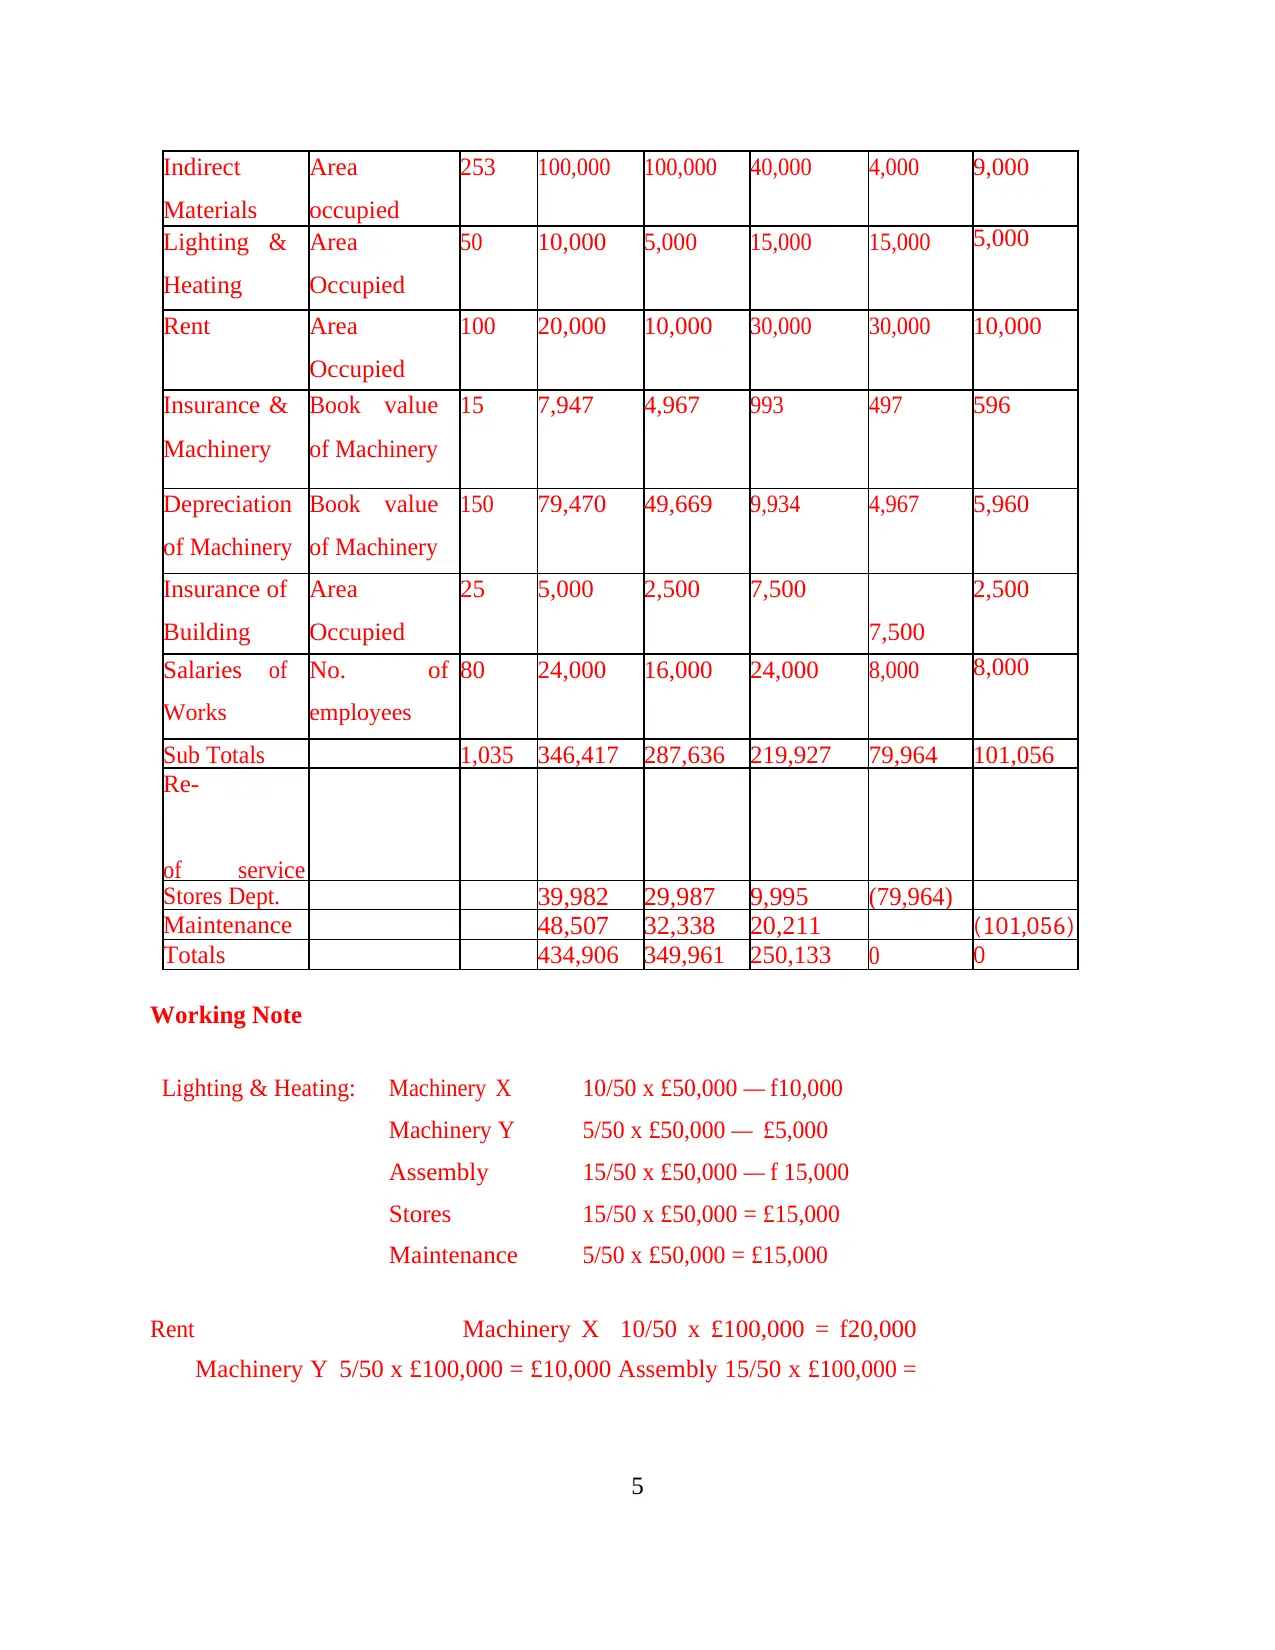
Indirect
Materials
Area
occupied
253 100,000 100,000 40,000 4,000 9,000
Lighting
Heating
& Area
Occupied
50 10,000 5,000 15,000 15,000 5,000
Rent Area
Occupied
100 20,000 10,000 30,000 30,000 10,000
Insurance &
Machinery
Book value
of Machinery
15 7,947 4,967 993 497 596
Depreciation
of Machinery
Book value
of Machinery
150 79,470 49,669 9,934 4,967 5,960
Insurance of
Building
Area
Occupied
25 5,000 2,500 7,500
7,500
2,500
Salaries
Works
of No.
employees
of 80 24,000 16,000 24,000 8,000 8,000
Sub Totals 1,035 346,417 287,636 219,927 79,964 101,056
Re-
of service
Stores Dept. 39,982 29,987 9,995 (79,964)
Maintenance 48,507 32,338 20,211 (101,056)
Totals 434,906 349,961 250,133 0 0
Working Note
Lighting & Heating: Machinery X 10/50 x £50,000 — f10,000
Machinery Y 5/50 x £50,000 — £5,000
Assembly 15/50 x £50,000 — f 15,000
Stores 15/50 x £50,000 = £15,000
Maintenance 5/50 x £50,000 = £15,000
Rent Machinery X 10/50 x £100,000 = f20,000
Machinery Y 5/50 x £100,000 = £10,000 Assembly 15/50 x £100,000 =
5
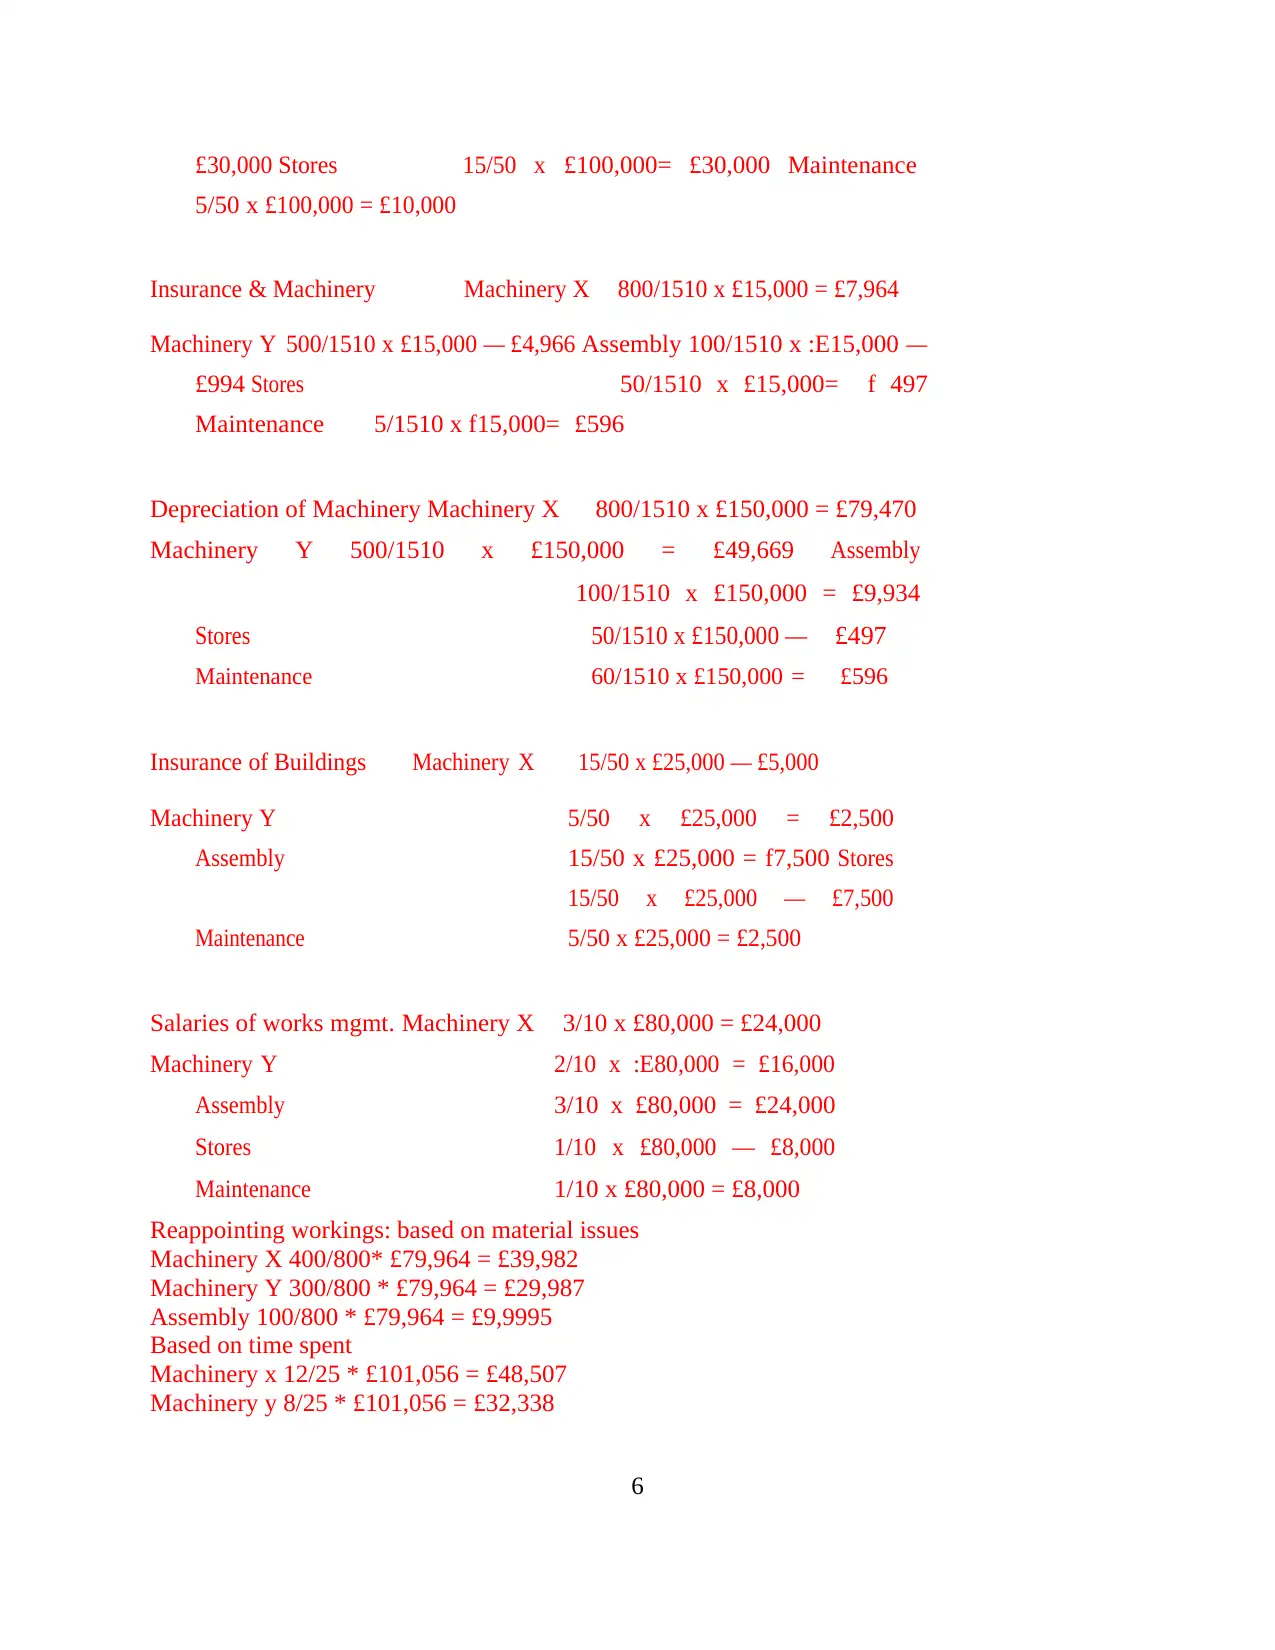
£30,000 Stores 15/50 x £100,000= £30,000 Maintenance
5/50 x £100,000 = £10,000
Insurance & Machinery Machinery X 800/1510 x £15,000 = £7,964
Machinery Y 500/1510 x £15,000 — £4,966 Assembly 100/1510 x :E15,000 —
£994 Stores 50/1510 x £15,000= f 497
Maintenance 5/1510 x f15,000= £596
Depreciation of Machinery Machinery X 800/1510 x £150,000 = £79,470
Machinery Y 500/1510 x £150,000 = £49,669 Assembly
100/1510 x £150,000 = £9,934
Stores 50/1510 x £150,000 — £497
Maintenance 60/1510 x £150,000 = £596
Insurance of Buildings Machinery X 15/50 x £25,000 — £5,000
Machinery Y 5/50 x £25,000 = £2,500
Assembly 15/50 x £25,000 = f7,500 Stores
15/50 x £25,000 — £7,500
Maintenance 5/50 x £25,000 = £2,500
Salaries of works mgmt. Machinery X 3/10 x £80,000 = £24,000
Machinery Y 2/10 x :E80,000 = £16,000
Assembly 3/10 x £80,000 = £24,000
Stores 1/10 x £80,000 — £8,000
Maintenance 1/10 x £80,000 = £8,000
Reappointing workings: based on material issues
Machinery X 400/800* £79,964 = £39,982
Machinery Y 300/800 * £79,964 = £29,987
Assembly 100/800 * £79,964 = £9,9995
Based on time spent
Machinery x 12/25 * £101,056 = £48,507
Machinery y 8/25 * £101,056 = £32,338
6
⊘ This is a preview!⊘
Do you want full access?
Subscribe today to unlock all pages.
Trusted by 1+ million students worldwide
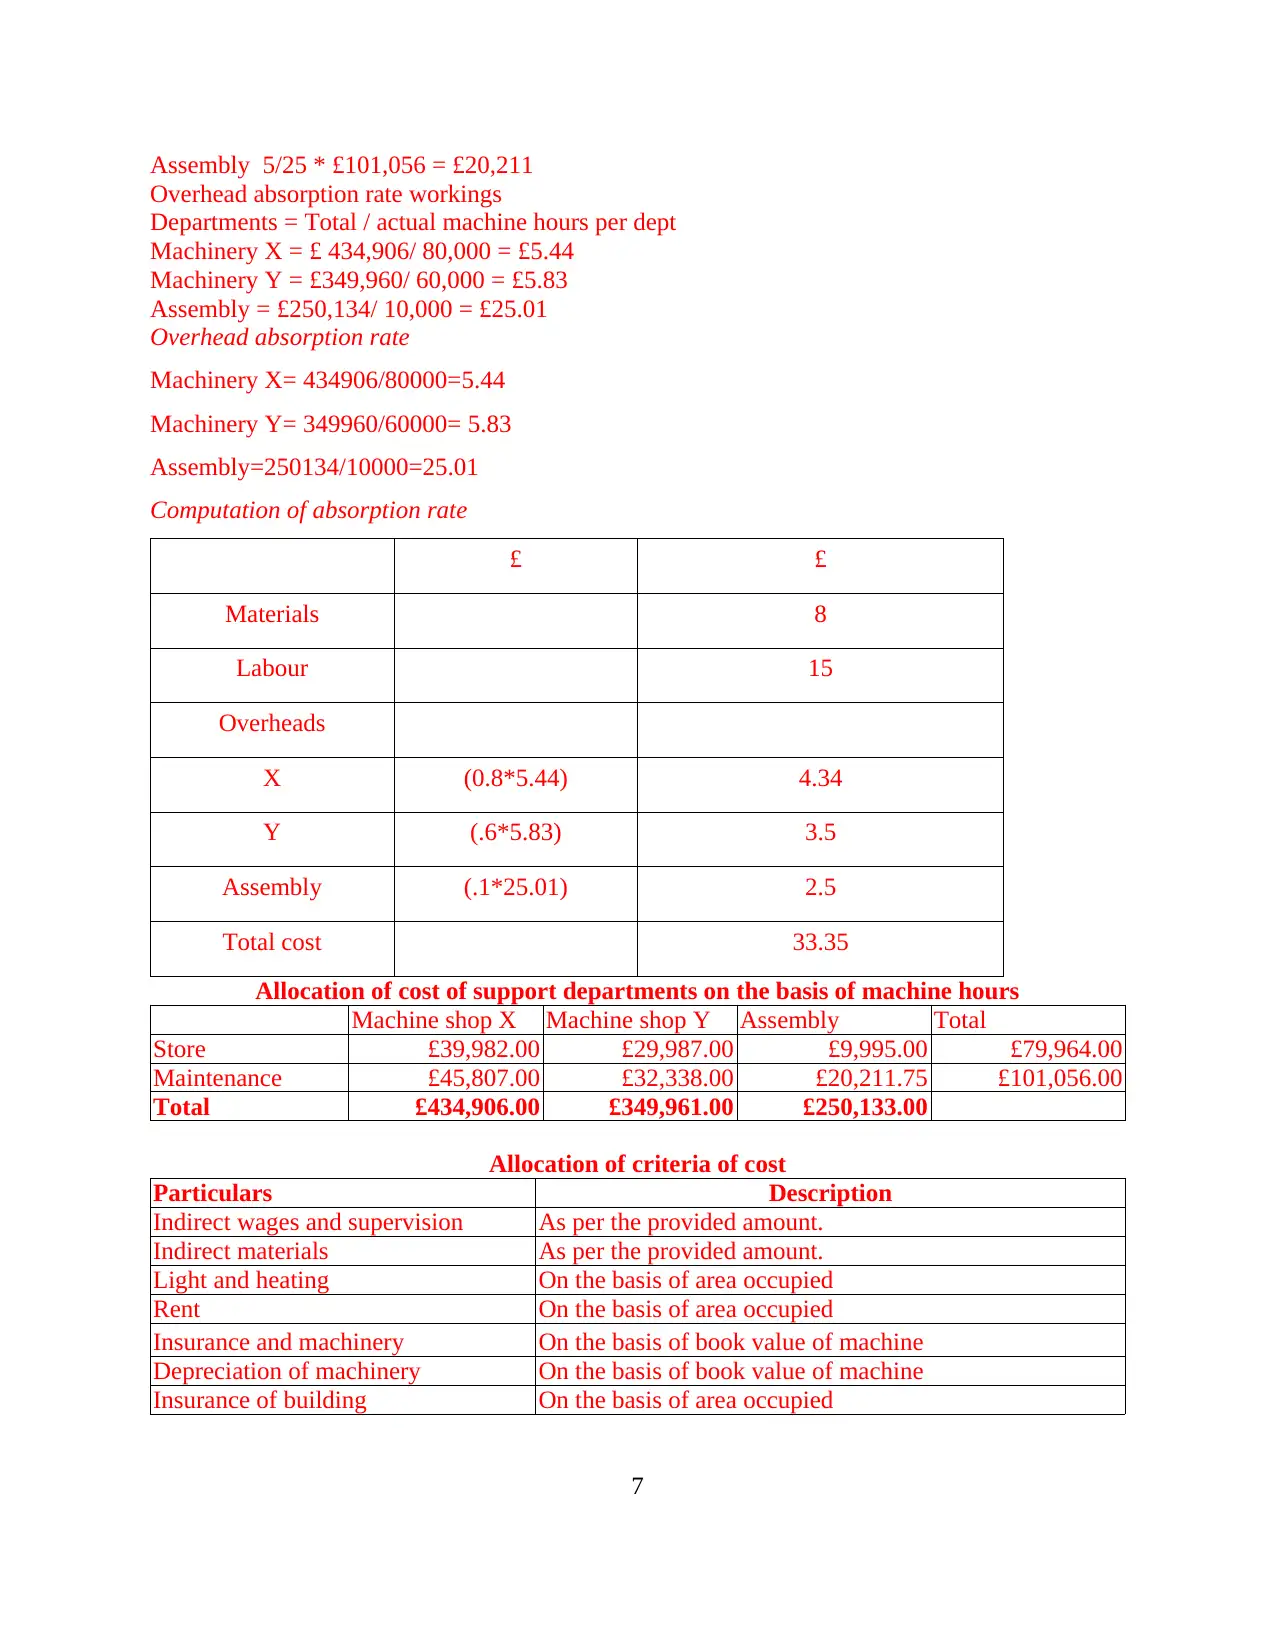
Assembly 5/25 * £101,056 = £20,211
Overhead absorption rate workings
Departments = Total / actual machine hours per dept
Machinery X = £ 434,906/ 80,000 = £5.44
Machinery Y = £349,960/ 60,000 = £5.83
Assembly = £250,134/ 10,000 = £25.01
Overhead absorption rate
Machinery X= 434906/80000=5.44
Machinery Y= 349960/60000= 5.83
Assembly=250134/10000=25.01
Computation of absorption rate
£ £
Materials 8
Labour 15
Overheads
X (0.8*5.44) 4.34
Y (.6*5.83) 3.5
Assembly (.1*25.01) 2.5
Total cost 33.35
Allocation of cost of support departments on the basis of machine hours
Machine shop X Machine shop Y Assembly Total
Store £39,982.00 £29,987.00 £9,995.00 £79,964.00
Maintenance £45,807.00 £32,338.00 £20,211.75 £101,056.00
Total £434,906.00 £349,961.00 £250,133.00
Allocation of criteria of cost
Particulars Description
Indirect wages and supervision As per the provided amount.
Indirect materials As per the provided amount.
Light and heating On the basis of area occupied
Rent On the basis of area occupied
Insurance and machinery On the basis of book value of machine
Depreciation of machinery On the basis of book value of machine
Insurance of building On the basis of area occupied
7
Paraphrase This Document
Need a fresh take? Get an instant paraphrase of this document with our AI Paraphraser
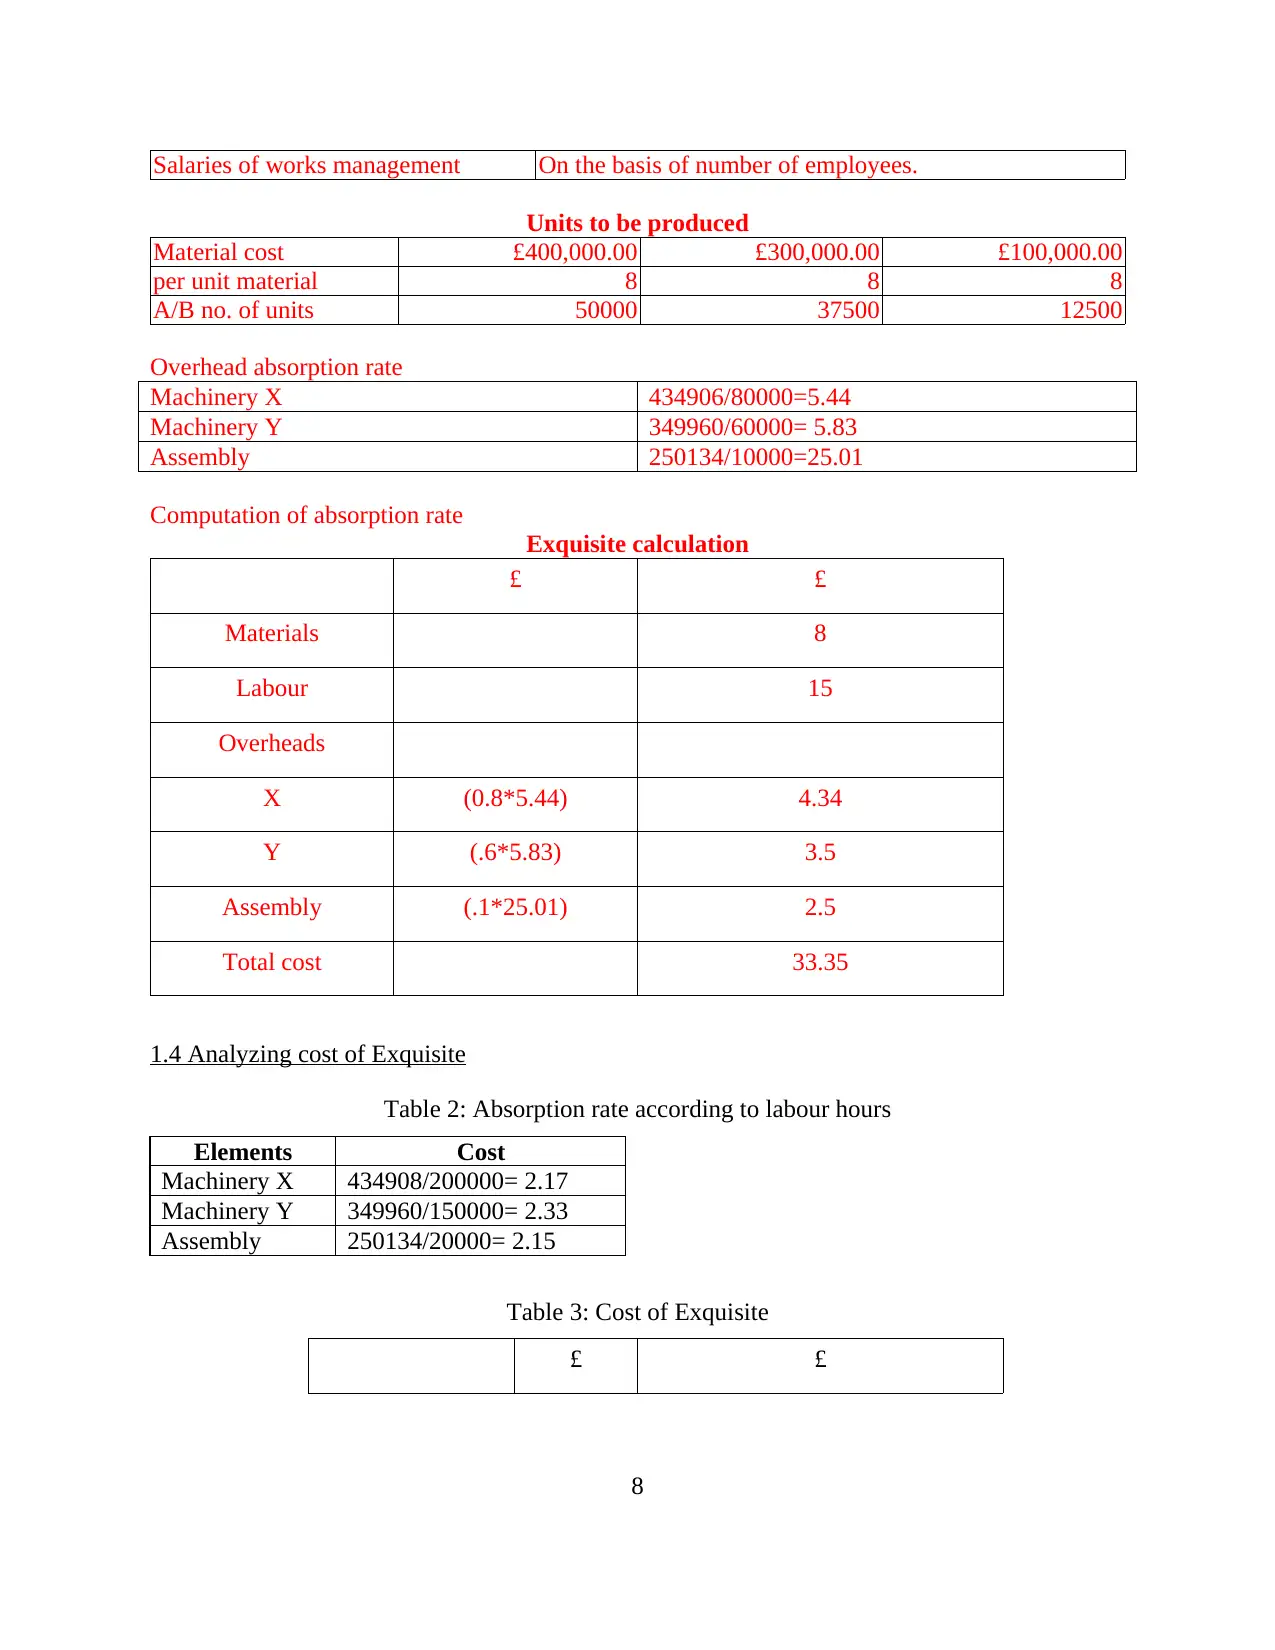
Salaries of works management On the basis of number of employees.
Units to be produced
Material cost £400,000.00 £300,000.00 £100,000.00
per unit material 8 8 8
A/B no. of units 50000 37500 12500
Overhead absorption rate
Machinery X 434906/80000=5.44
Machinery Y 349960/60000= 5.83
Assembly 250134/10000=25.01
Computation of absorption rate
Exquisite calculation
£ £
Materials 8
Labour 15
Overheads
X (0.8*5.44) 4.34
Y (.6*5.83) 3.5
Assembly (.1*25.01) 2.5
Total cost 33.35
1.4 Analyzing cost of Exquisite
Table 2: Absorption rate according to labour hours
Elements Cost
Machinery X 434908/200000= 2.17
Machinery Y 349960/150000= 2.33
Assembly 250134/20000= 2.15
Table 3: Cost of Exquisite
£ £
8
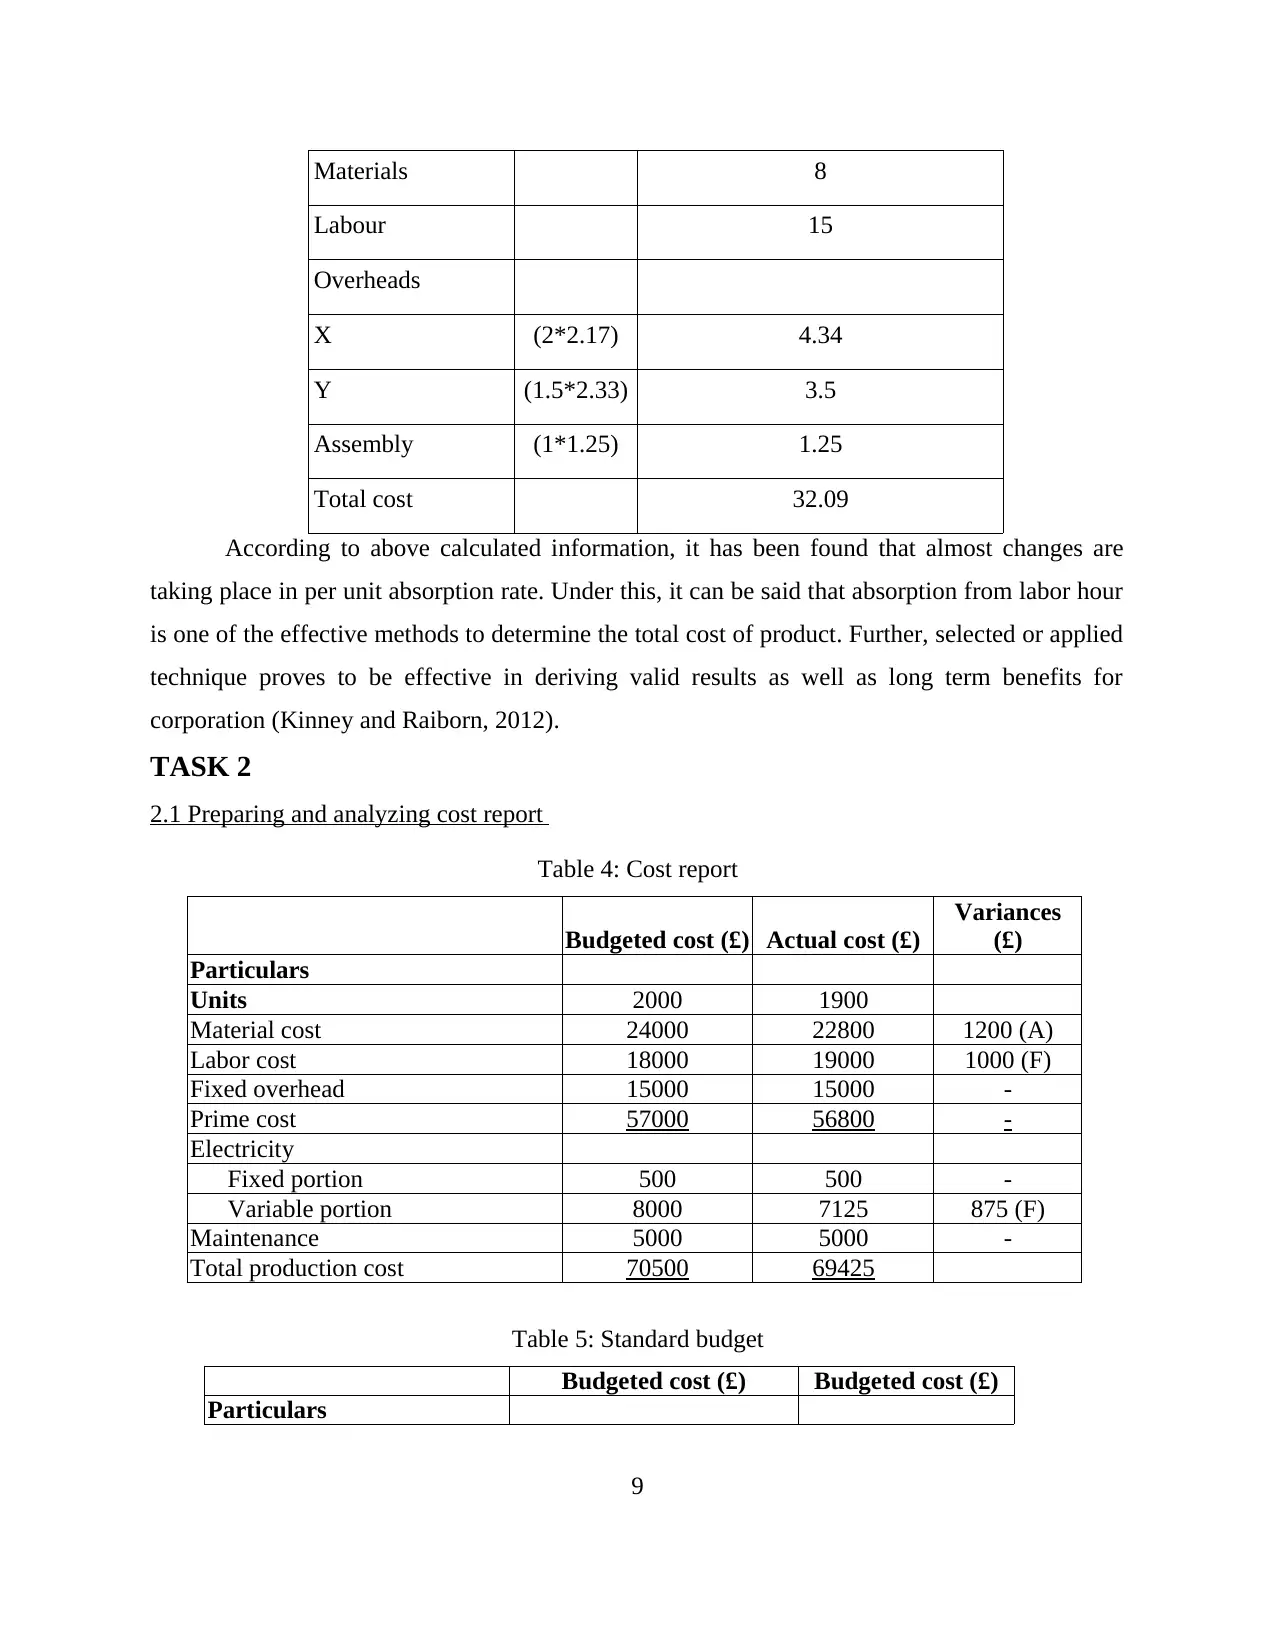
Materials 8
Labour 15
Overheads
X (2*2.17) 4.34
Y (1.5*2.33) 3.5
Assembly (1*1.25) 1.25
Total cost 32.09
According to above calculated information, it has been found that almost changes are
taking place in per unit absorption rate. Under this, it can be said that absorption from labor hour
is one of the effective methods to determine the total cost of product. Further, selected or applied
technique proves to be effective in deriving valid results as well as long term benefits for
corporation (Kinney and Raiborn, 2012).
TASK 2
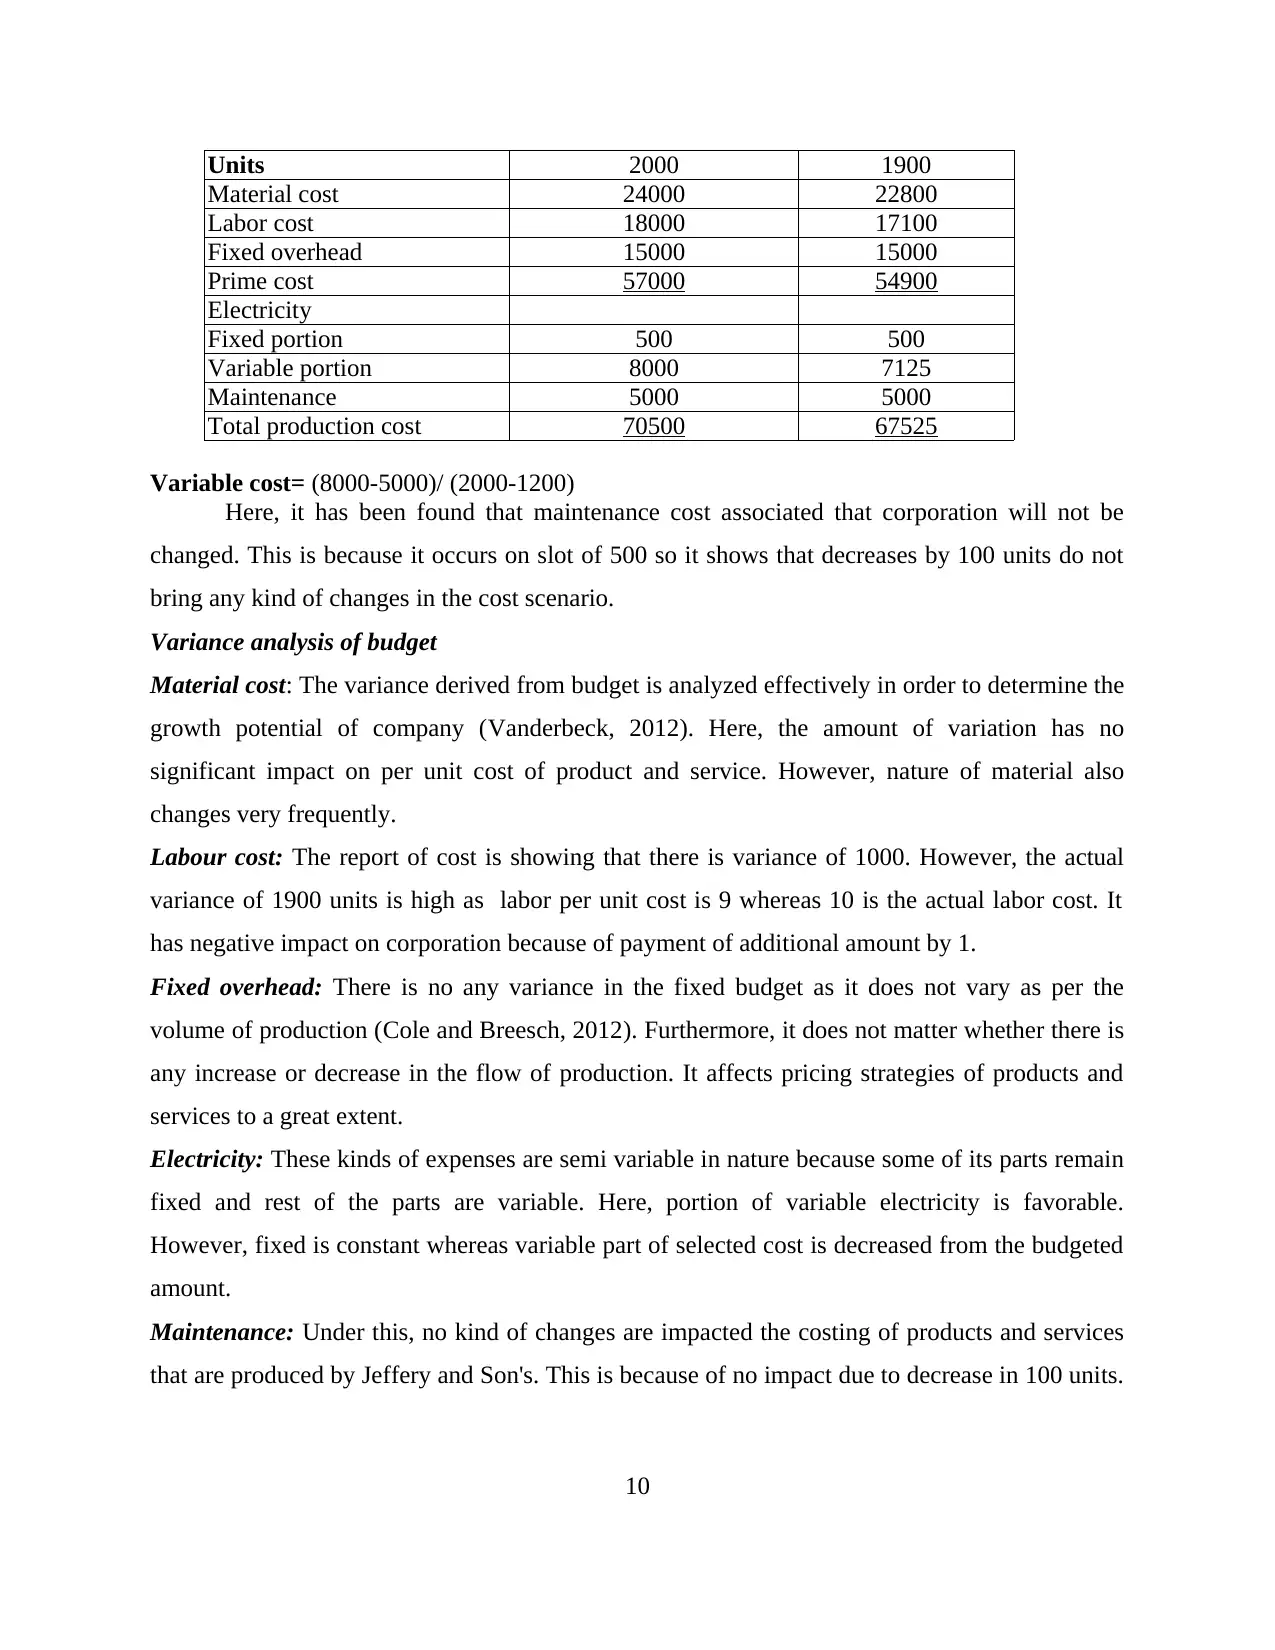
2.1 Preparing and analyzing cost report
Table 4: Cost report
Budgeted cost (£) Actual cost (£)
Variances
(£)
Particulars
Units 2000 1900
Material cost 24000 22800 1200 (A)
Labor cost 18000 19000 1000 (F)
Fixed overhead 15000 15000 -
Prime cost 57000 56800 -
Electricity
Fixed portion 500 500 -
Variable portion 8000 7125 875 (F)
Maintenance 5000 5000 -
Total production cost 70500 69425
Table 5: Standard budget
Budgeted cost (£) Budgeted cost (£)
Particulars
9
Labour 15
Overheads
X (2*2.17) 4.34
Y (1.5*2.33) 3.5
Assembly (1*1.25) 1.25
Total cost 32.09
According to above calculated information, it has been found that almost changes are
taking place in per unit absorption rate. Under this, it can be said that absorption from labor hour
is one of the effective methods to determine the total cost of product. Further, selected or applied
technique proves to be effective in deriving valid results as well as long term benefits for
corporation (Kinney and Raiborn, 2012).
TASK 2
2.1 Preparing and analyzing cost report
Table 4: Cost report
Budgeted cost (£) Actual cost (£)
Variances
(£)
Particulars
Units 2000 1900
Material cost 24000 22800 1200 (A)
Labor cost 18000 19000 1000 (F)
Fixed overhead 15000 15000 -
Prime cost 57000 56800 -
Electricity
Fixed portion 500 500 -
Variable portion 8000 7125 875 (F)
Maintenance 5000 5000 -
Total production cost 70500 69425
Table 5: Standard budget
Budgeted cost (£) Budgeted cost (£)
Particulars
9
⊘ This is a preview!⊘
Do you want full access?
Subscribe today to unlock all pages.
Trusted by 1+ million students worldwide
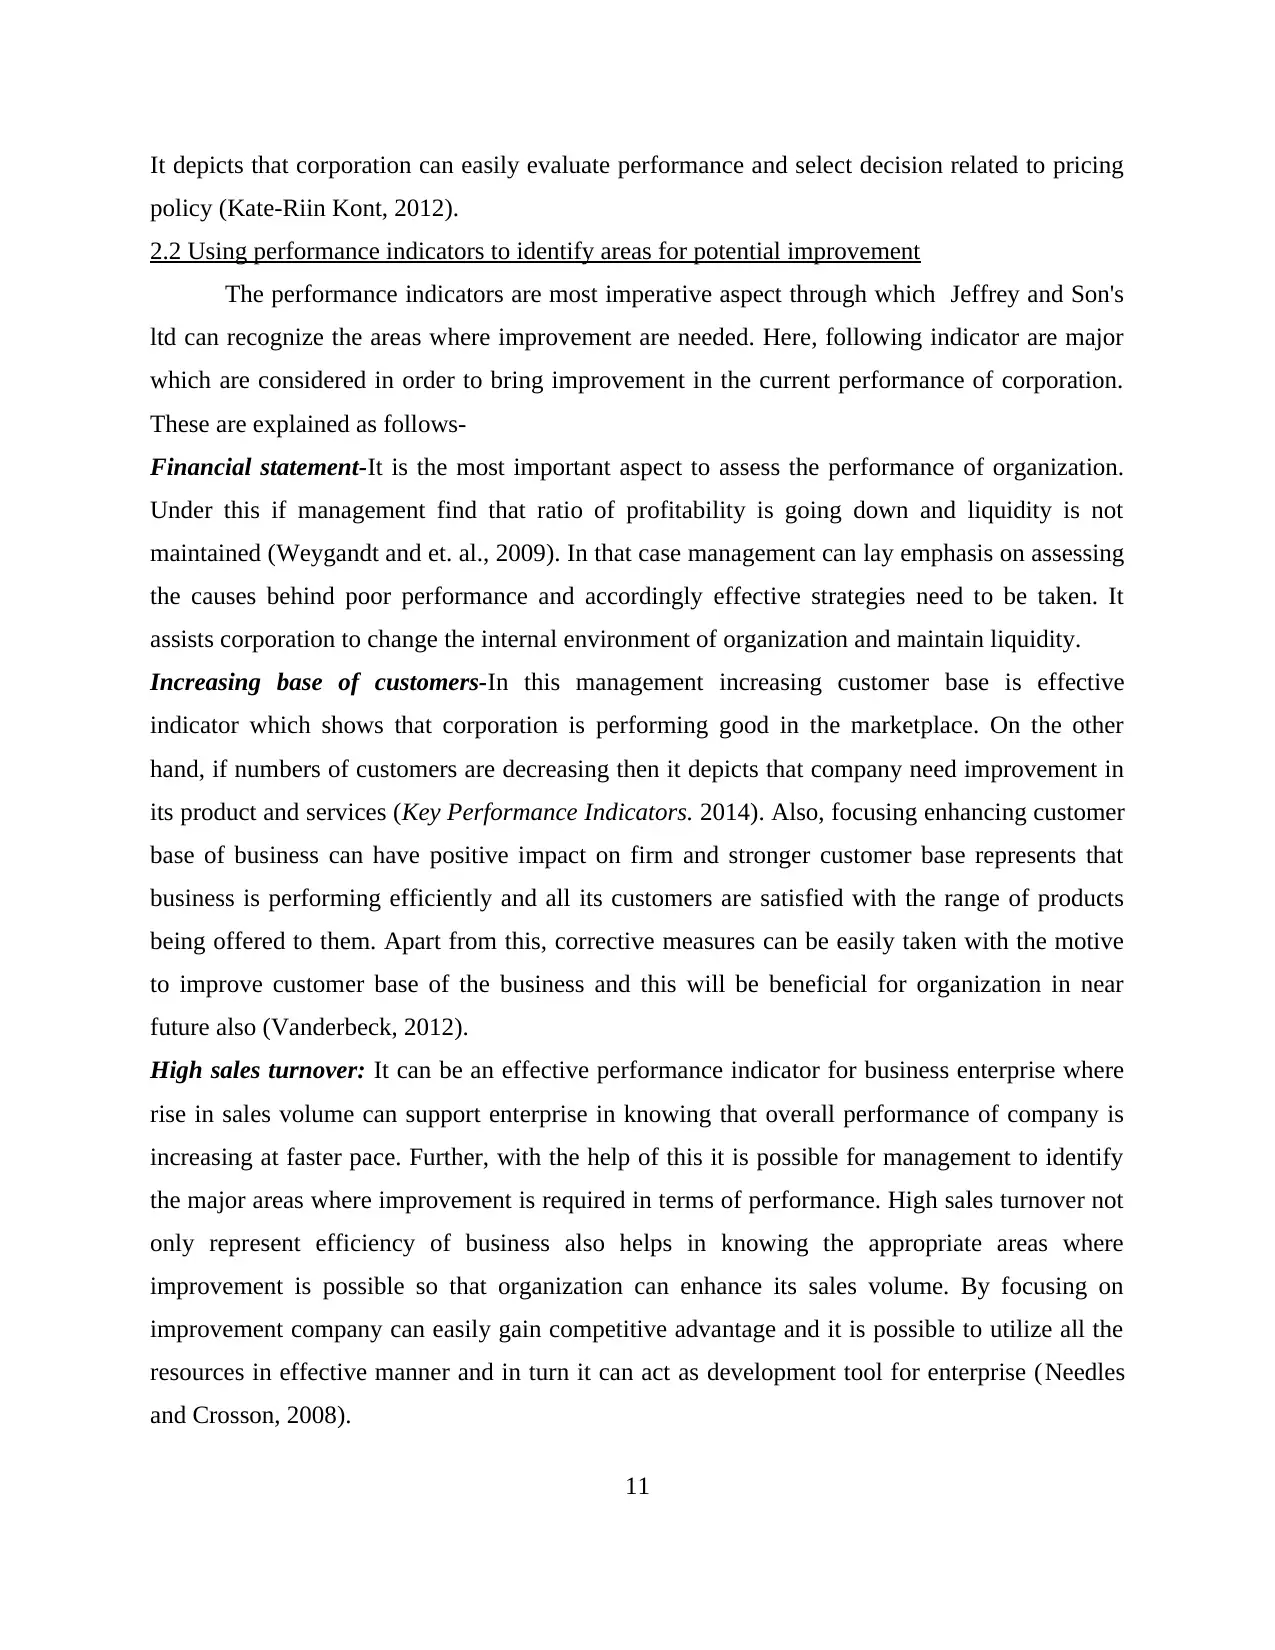
Units 2000 1900
Material cost 24000 22800
Labor cost 18000 17100
Fixed overhead 15000 15000
Prime cost 57000 54900
Electricity
Fixed portion 500 500
Variable portion 8000 7125
Maintenance 5000 5000
Total production cost 70500 67525
Variable cost= (8000-5000)/ (2000-1200)
Here, it has been found that maintenance cost associated that corporation will not be
changed. This is because it occurs on slot of 500 so it shows that decreases by 100 units do not
bring any kind of changes in the cost scenario.
Variance analysis of budget
Material cost: The variance derived from budget is analyzed effectively in order to determine the
growth potential of company (Vanderbeck, 2012). Here, the amount of variation has no
significant impact on per unit cost of product and service. However, nature of material also
changes very frequently.
Labour cost: The report of cost is showing that there is variance of 1000. However, the actual
variance of 1900 units is high as labor per unit cost is 9 whereas 10 is the actual labor cost. It
has negative impact on corporation because of payment of additional amount by 1.
Fixed overhead: There is no any variance in the fixed budget as it does not vary as per the
volume of production (Cole and Breesch, 2012). Furthermore, it does not matter whether there is
any increase or decrease in the flow of production. It affects pricing strategies of products and
services to a great extent.
Electricity: These kinds of expenses are semi variable in nature because some of its parts remain
fixed and rest of the parts are variable. Here, portion of variable electricity is favorable.
However, fixed is constant whereas variable part of selected cost is decreased from the budgeted
amount.
Maintenance: Under this, no kind of changes are impacted the costing of products and services
that are produced by Jeffery and Son's. This is because of no impact due to decrease in 100 units.
10
Paraphrase This Document
Need a fresh take? Get an instant paraphrase of this document with our AI Paraphraser
It depicts that corporation can easily evaluate performance and select decision related to pricing
policy (Kate-Riin Kont, 2012).
2.2 Using performance indicators to identify areas for potential improvement
The performance indicators are most imperative aspect through which Jeffrey and Son's
ltd can recognize the areas where improvement are needed. Here, following indicator are major
which are considered in order to bring improvement in the current performance of corporation.
These are explained as follows-
Financial statement-It is the most important aspect to assess the performance of organization.
Under this if management find that ratio of profitability is going down and liquidity is not
maintained (Weygandt and et. al., 2009). In that case management can lay emphasis on assessing
the causes behind poor performance and accordingly effective strategies need to be taken. It
assists corporation to change the internal environment of organization and maintain liquidity.
Increasing base of customers-In this management increasing customer base is effective
indicator which shows that corporation is performing good in the marketplace. On the other
hand, if numbers of customers are decreasing then it depicts that company need improvement in
its product and services (Key Performance Indicators. 2014). Also, focusing enhancing customer
base of business can have positive impact on firm and stronger customer base represents that
business is performing efficiently and all its customers are satisfied with the range of products
being offered to them. Apart from this, corrective measures can be easily taken with the motive
to improve customer base of the business and this will be beneficial for organization in near
future also (Vanderbeck, 2012).
High sales turnover: It can be an effective performance indicator for business enterprise where
rise in sales volume can support enterprise in knowing that overall performance of company is
increasing at faster pace. Further, with the help of this it is possible for management to identify
the major areas where improvement is required in terms of performance. High sales turnover not
only represent efficiency of business also helps in knowing the appropriate areas where
improvement is possible so that organization can enhance its sales volume. By focusing on
improvement company can easily gain competitive advantage and it is possible to utilize all the
resources in effective manner and in turn it can act as development tool for enterprise (Needles
and Crosson, 2008).
11
Gross profit ratio: This ratio is also regarded as one of the most effective performance indicator
for business through which it is possible for management to know about the profits earned by
business and in turn it can be ensured whether all the resources are utilized in efficient manner or
not (Vance, 2002).
ROCE: This ratio is also one of the indicators which represents efficiency of the business and
supports in knowing the overall return which has been obtained by business by employing
capital. In short, it can be known whether all the financial resources are utilized efficiently by
Jeffrey and Sons or not.
EPS: This ratio supports business in knowing the efficiency of business and it is the portion of
firm’s profit which is allocated to each outstanding share of common stock (Kinney and Raiborn,
2012). It shows the profitability level of the business and provides information the stakeholders
regarding overall performance of Jeffrey and Sons in the market.
Debtor collection period: It supports in highlighting the average time taken to collect trade debts
by business. Further, this ratio can support Jeffrey and Sons to know overall efficiency of the
business.
2.3 Ways to reduce cost and enhance value, quality
Different effective ways are present with Jeffrey and Son's ltd which business can
undertake with the motive to reduce overall cost and enhancing value along with quality of the
commodity. Such ways are as follows:
Kaizen costing: This technique assists enterprise in enhancing overall level of the operations
being carried out. Further, it becomes easy for management to accomplish desired goals along
with objectives if proper costing method is employed. Moreover, business can easily enhance
motivation level of its workforce and they will prefer to take more initiative for welfare of the
business (Theeke and Mitchell, 2008). On the other hand, major costs can be saved which is
linked with wastage in the production process.
Total quality management: This technique supports management in enhancing the quality level
of the product along with major cost associated with production can be saved easily. Through
this, it is possible for business to identify the major areas where improvement is possible and in
turn it acts as development tool for enterprise. Further, it can assist Jeffrey and Son's ltd in
12
⊘ This is a preview!⊘
Do you want full access?
Subscribe today to unlock all pages.
Trusted by 1+ million students worldwide
1 out of 23
Related Documents


Your All-in-One AI-Powered Toolkit for Academic Success.
+13062052269
info@desklib.com
Available 24*7 on WhatsApp / Email
![[object Object]](/_next/static/media/star-bottom.7253800d.svg)
Unlock your academic potential
Copyright © 2020–2026 A2Z Services. All Rights Reserved. Developed and managed by ZUCOL.