Project Analysis: Aktor's Petrol Filling Station Construction Plan
VerifiedAdded on 2023/01/13
|19
|4093
|1
Project
AI Summary
This project analyzes the construction of a new petrol filling station, acting as a management consultant. The project begins with recommendations for the existing site setup, proposing modifications to optimize space for construction activities, accommodation, and security. It then constructs a critical path method (CPM) diagram and a Gantt chart for the early start program, determining the critical path and project duration. The analysis includes calculating the probability of project completion within the estimated timescale and identifying the most cost-effective way to accelerate the project by three weeks. Further, the project presents Gantt charts showing planned and actual progress, calculates planned and earned value at the end of week 10, computes schedule and cost indices, and provides a revised budget. The conclusion summarizes the key findings and recommendations, emphasizing the importance of effective planning, cost management, and schedule adherence in construction projects.

Management
Consultant
Consultant
Paraphrase This Document
Need a fresh take? Get an instant paraphrase of this document with our AI Paraphraser
Table of Contents
INTRODUCTION...........................................................................................................................1
TASK 1............................................................................................................................................1
Recommendation to the existing site set up and new site plan....................................................1
TASK 2............................................................................................................................................3
A. Construction of critical path method and determination of critical path and overall duration
of the project................................................................................................................................3
B. Production of Gantt chart for the early start programme that Aktor can use in the planning
phase of the project......................................................................................................................4
C. Calculation of probability of the project completion within timescale originally estimated in
part a.............................................................................................................................................6
D. Determination of the most cost effective way in which project's overall duration can be
accelerated by three weeks...........................................................................................................6
TASK 3............................................................................................................................................7
A. Production of Gantt Chart.......................................................................................................7
B. Calculation of planned value of the project at the end of week 10.........................................9
C. Computation of earned value of the work completed at the end of week 10..........................9
D. Calculation of schedule index and cost index for each project team and for the whole
project........................................................................................................................................10
E. Computation of revised budget for the project at the end of week 10..................................13
CONCLUSION..............................................................................................................................14
REFERENCES..............................................................................................................................16
INTRODUCTION
Management consultant can be defined as a person who is responsible to provide advice
to business entities to carry out operational activities in systematic manner. Main purpose of
them is to make sure that improvements are made in the performance with the help of their
suggestions (Baker, 2014). The main factors which are focused by them are facilitating
organisational change, developing strategy, suggesting ways to operate business effectively,
making alteration in operational execution etc. Major skills which are required by a management
consultant are planning, critical thinking, vast knowledge about current business scenario, proper
communication, etc. With the help of all these qualities an individual will be able to guide an
organisation properly. This assignment is based upon construction management for which
different topics such as recommendation for the existing site set up, production of CPM and
Gantt chart, calculation of probability of success of project are covered in this project.
Additionally, determination of most cost effective way, new Gantt chart to show planed and
actual progress, calculation of planned and earned value, schedule and cost index along with
revised budget are also covered in this project.
TASK 1
Recommendation to the existing site set up and new site plan
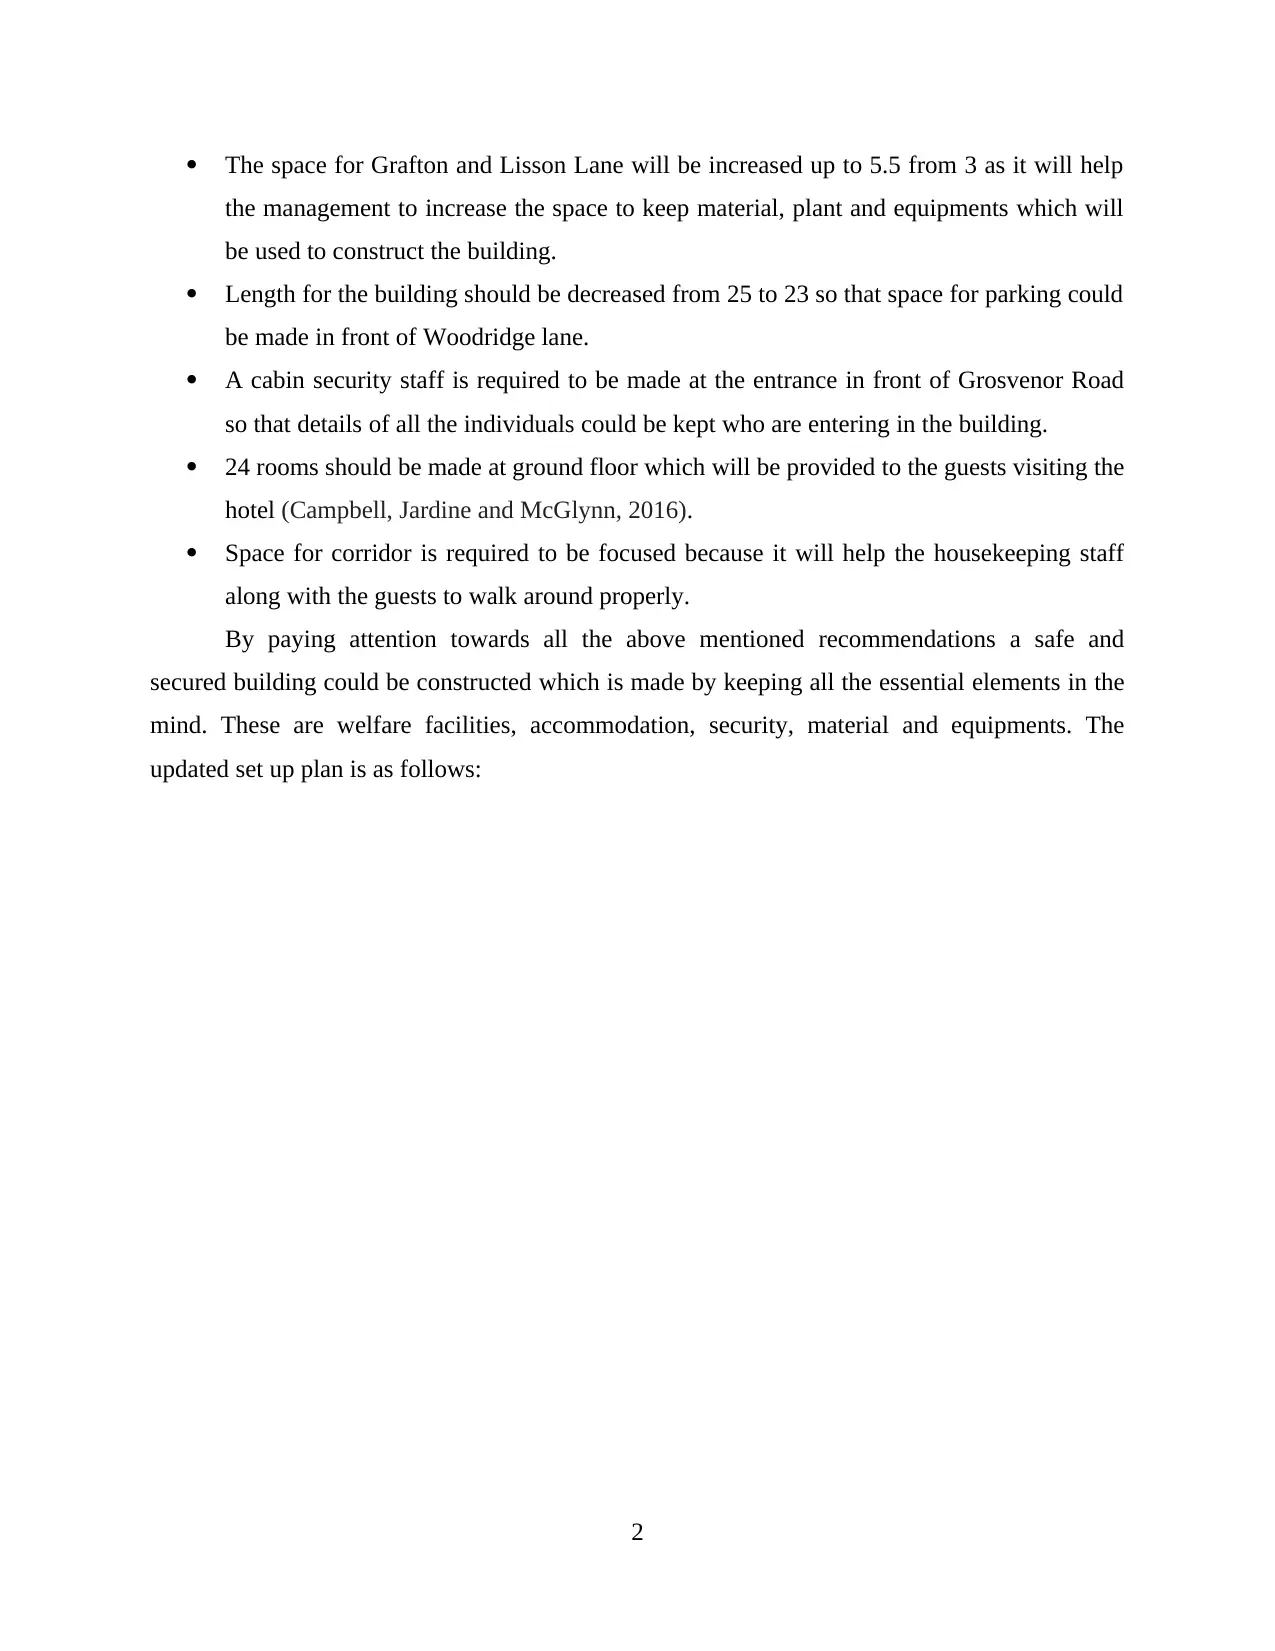
From the existing block plan it has been analysed that length of the property is 25 and
width is 85. The boundary which is kept outside the building is 1.2 for all the sides. Space for
Woodridge, Grafton and Lisson roads is 3.0 and for Grosvenor Road, space is 7.5. The building
is planning to occupy most of the site to the boundary so that available space could be used
maximumly (Besser, Ortmann and Klein, 2015). In order to manage the traffic and segregate
construction operatives several modifications are required to be made in the site plan. As the site
set up is required to be focused with accommodation, welfare facilities, security, storage of plant,
material, equipment etc. therefore several recommendations are made to project manager. All of
them are as follows:
The width should be reduced up to 80 from 85 as it will help to make space to keep the
material which will be used for construction related activities.
1
Management consultant can be defined as a person who is responsible to provide advice
to business entities to carry out operational activities in systematic manner. Main purpose of
them is to make sure that improvements are made in the performance with the help of their
suggestions (Baker, 2014). The main factors which are focused by them are facilitating
organisational change, developing strategy, suggesting ways to operate business effectively,
making alteration in operational execution etc. Major skills which are required by a management
consultant are planning, critical thinking, vast knowledge about current business scenario, proper
communication, etc. With the help of all these qualities an individual will be able to guide an
organisation properly. This assignment is based upon construction management for which
different topics such as recommendation for the existing site set up, production of CPM and
Gantt chart, calculation of probability of success of project are covered in this project.
Additionally, determination of most cost effective way, new Gantt chart to show planed and
actual progress, calculation of planned and earned value, schedule and cost index along with
revised budget are also covered in this project.
TASK 1
Recommendation to the existing site set up and new site plan
From the existing block plan it has been analysed that length of the property is 25 and
width is 85. The boundary which is kept outside the building is 1.2 for all the sides. Space for
Woodridge, Grafton and Lisson roads is 3.0 and for Grosvenor Road, space is 7.5. The building
is planning to occupy most of the site to the boundary so that available space could be used
maximumly (Besser, Ortmann and Klein, 2015). In order to manage the traffic and segregate
construction operatives several modifications are required to be made in the site plan. As the site
set up is required to be focused with accommodation, welfare facilities, security, storage of plant,
material, equipment etc. therefore several recommendations are made to project manager. All of
them are as follows:
The width should be reduced up to 80 from 85 as it will help to make space to keep the
material which will be used for construction related activities.
1
⊘ This is a preview!⊘
Do you want full access?
Subscribe today to unlock all pages.
Trusted by 1+ million students worldwide
The space for Grafton and Lisson Lane will be increased up to 5.5 from 3 as it will help
the management to increase the space to keep material, plant and equipments which will
be used to construct the building.
Length for the building should be decreased from 25 to 23 so that space for parking could
be made in front of Woodridge lane.
A cabin security staff is required to be made at the entrance in front of Grosvenor Road
so that details of all the individuals could be kept who are entering in the building.
24 rooms should be made at ground floor which will be provided to the guests visiting the
hotel (Campbell, Jardine and McGlynn, 2016).
Space for corridor is required to be focused because it will help the housekeeping staff
along with the guests to walk around properly.
By paying attention towards all the above mentioned recommendations a safe and
secured building could be constructed which is made by keeping all the essential elements in the
mind. These are welfare facilities, accommodation, security, material and equipments. The
updated set up plan is as follows:
2
Paraphrase This Document
Need a fresh take? Get an instant paraphrase of this document with our AI Paraphraser
TASK 2
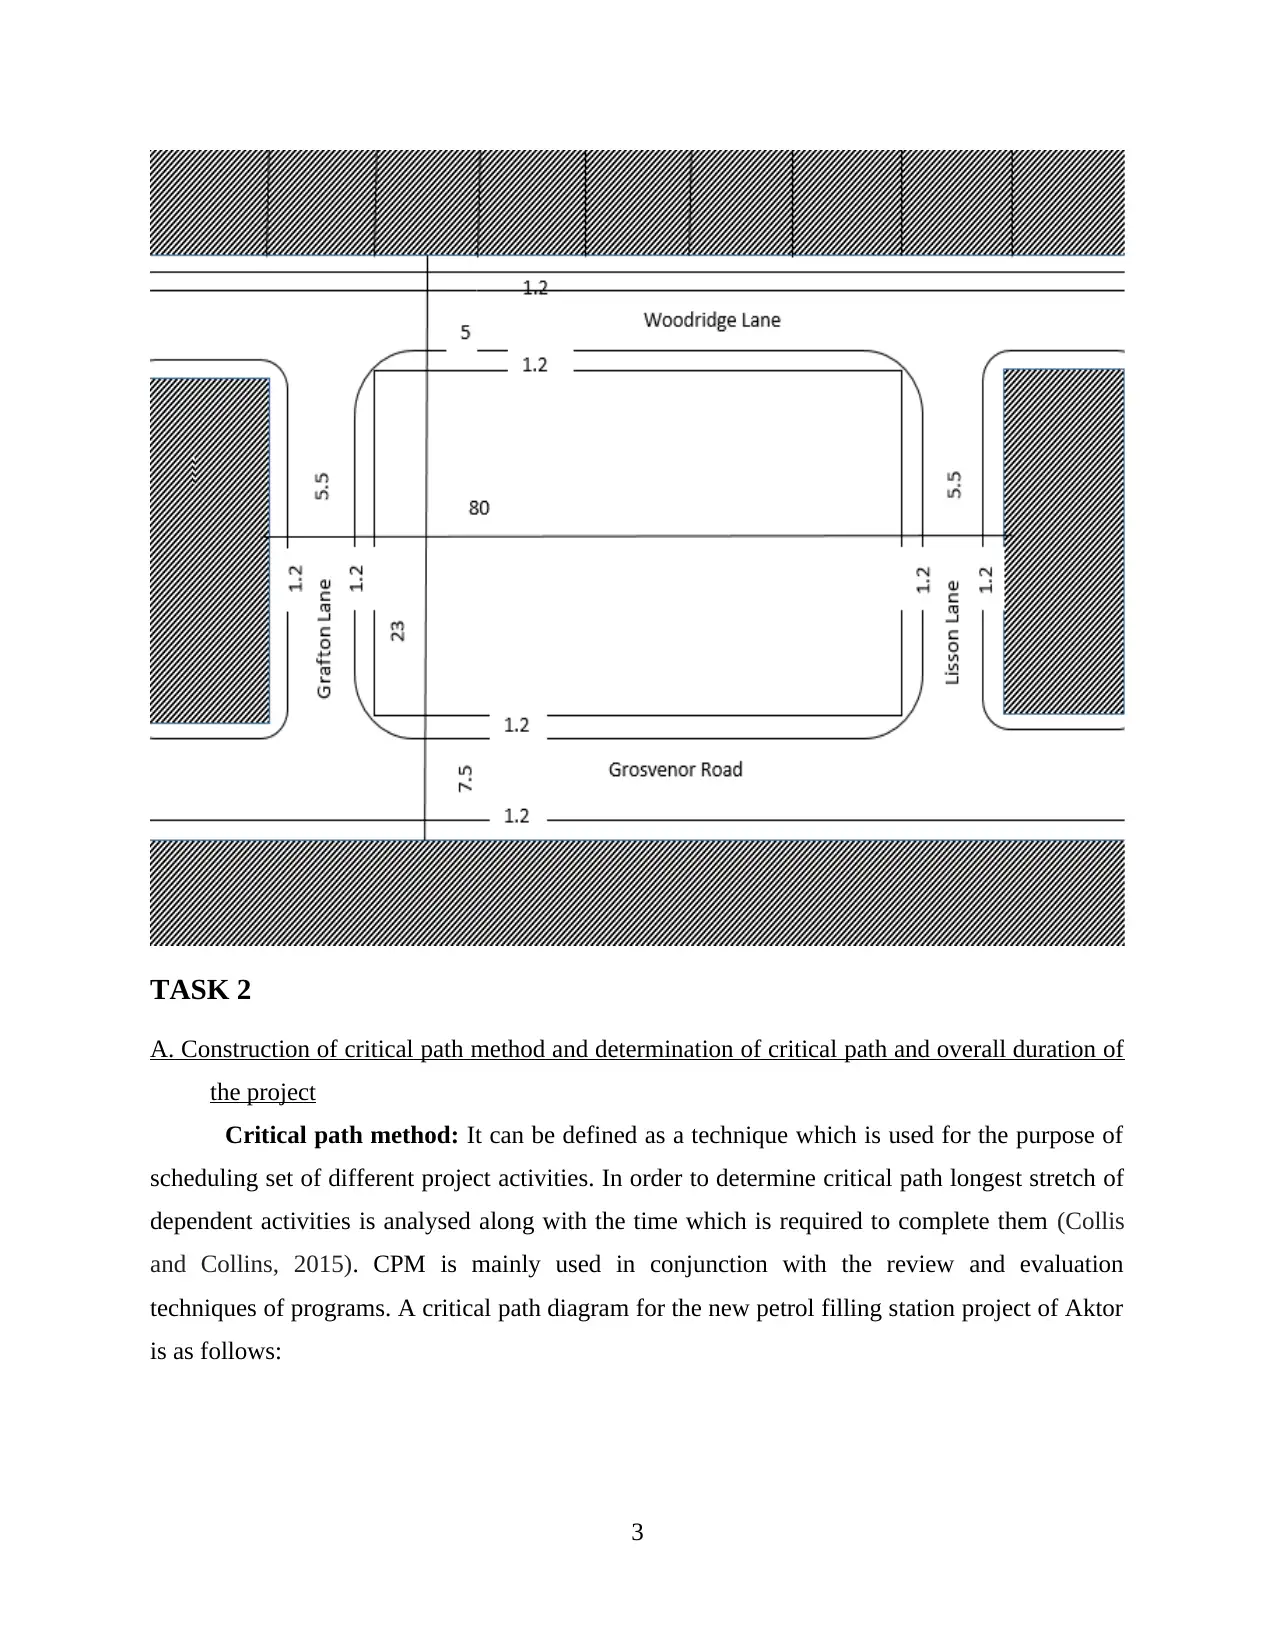
A. Construction of critical path method and determination of critical path and overall duration of
the project
Critical path method: It can be defined as a technique which is used for the purpose of
scheduling set of different project activities. In order to determine critical path longest stretch of
dependent activities is analysed along with the time which is required to complete them (Collis
and Collins, 2015). CPM is mainly used in conjunction with the review and evaluation
techniques of programs. A critical path diagram for the new petrol filling station project of Aktor
is as follows:
3
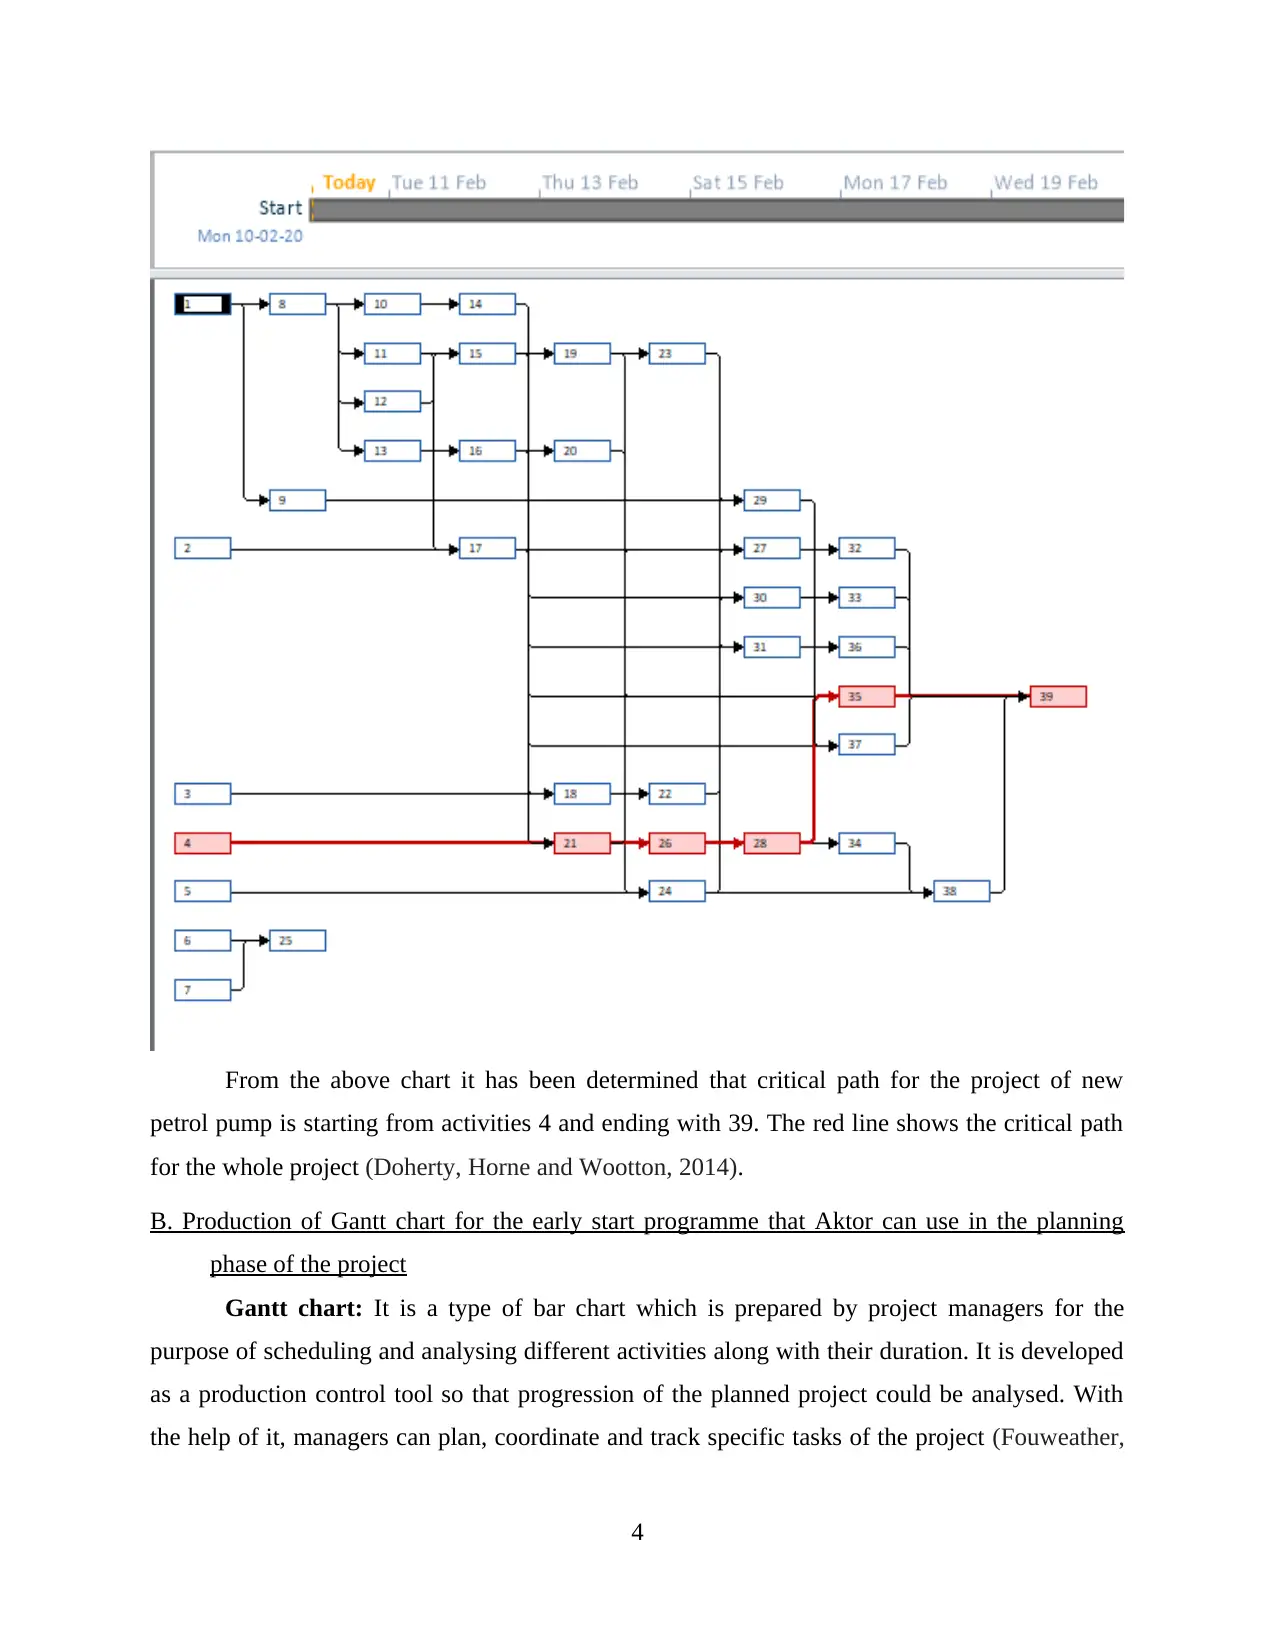
From the above chart it has been determined that critical path for the project of new
petrol pump is starting from activities 4 and ending with 39. The red line shows the critical path
for the whole project (Doherty, Horne and Wootton, 2014).
B. Production of Gantt chart for the early start programme that Aktor can use in the planning
phase of the project
Gantt chart: It is a type of bar chart which is prepared by project managers for the
purpose of scheduling and analysing different activities along with their duration. It is developed
as a production control tool so that progression of the planned project could be analysed. With
the help of it, managers can plan, coordinate and track specific tasks of the project (Fouweather,
4
⊘ This is a preview!⊘
Do you want full access?
Subscribe today to unlock all pages.
Trusted by 1+ million students worldwide
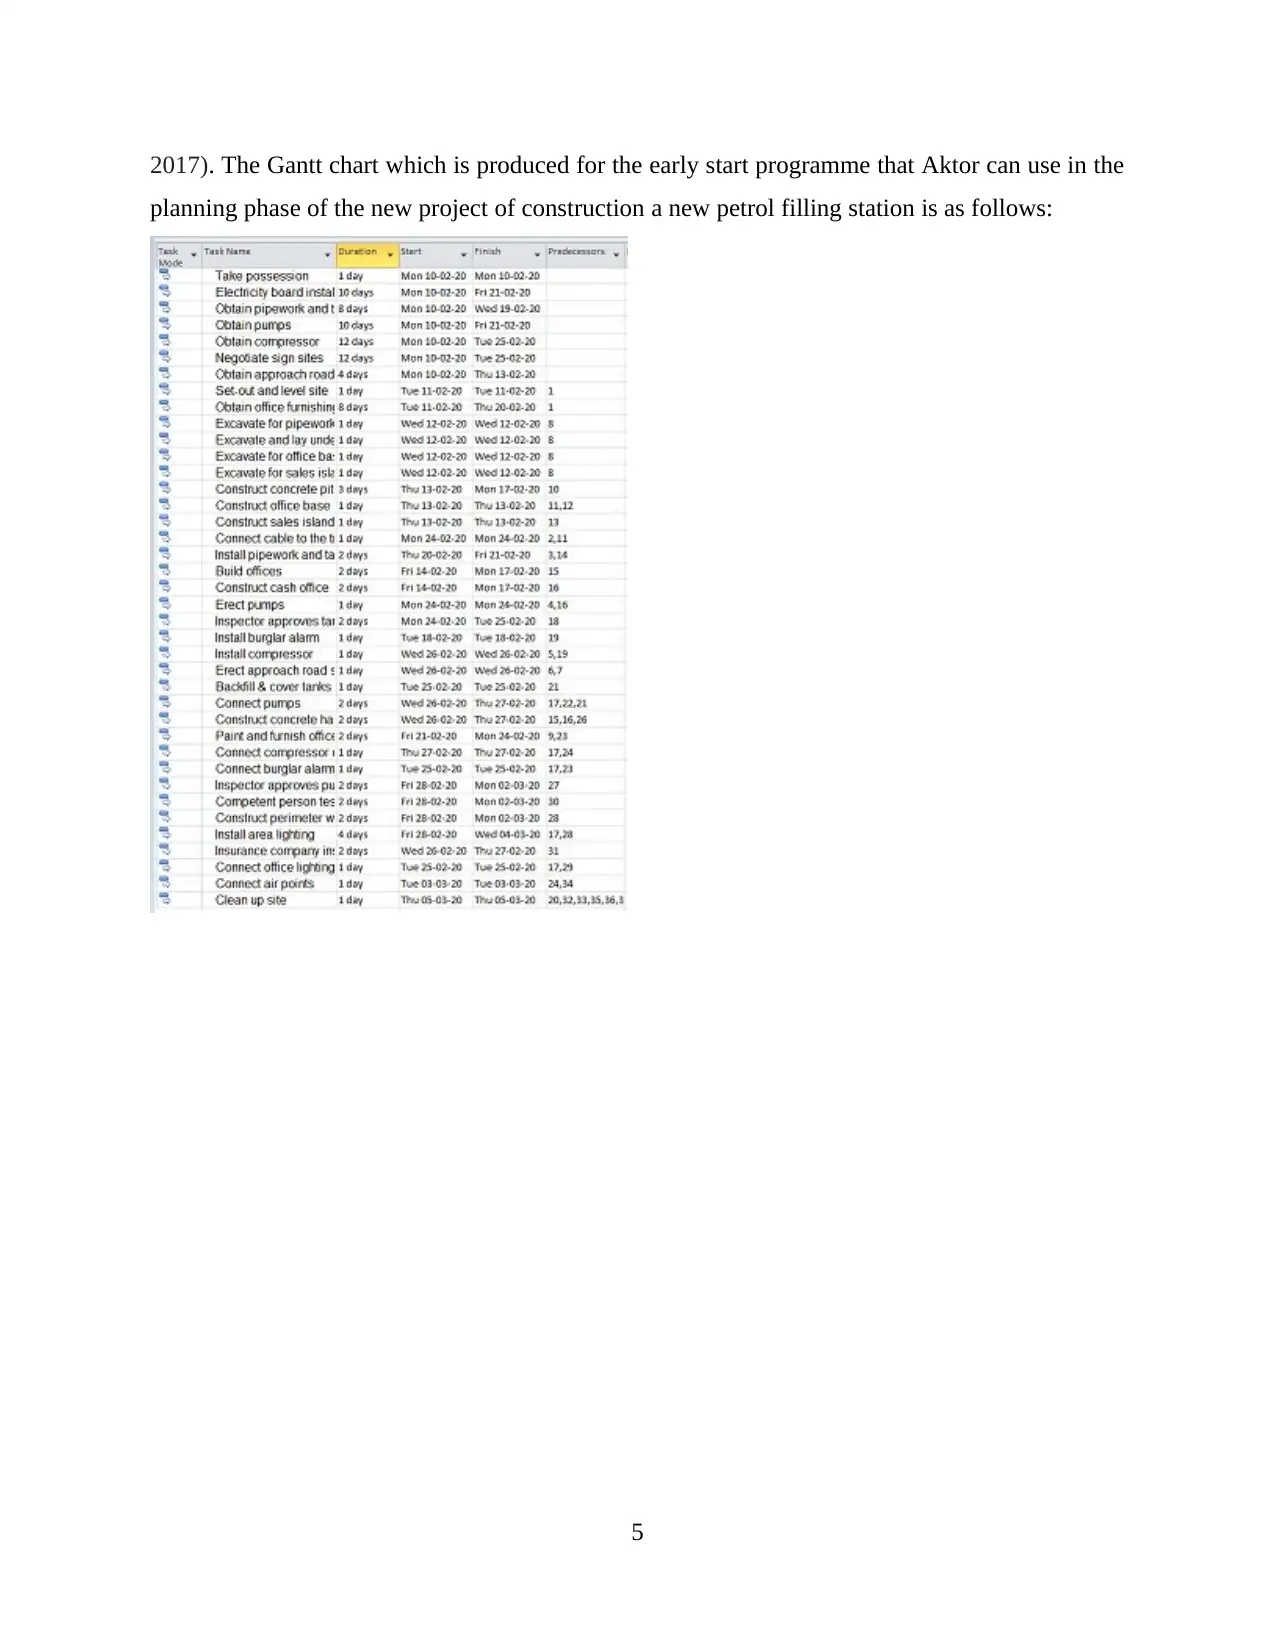
2017). The Gantt chart which is produced for the early start programme that Aktor can use in the
planning phase of the new project of construction a new petrol filling station is as follows:
5
planning phase of the new project of construction a new petrol filling station is as follows:
5
Paraphrase This Document
Need a fresh take? Get an instant paraphrase of this document with our AI Paraphraser
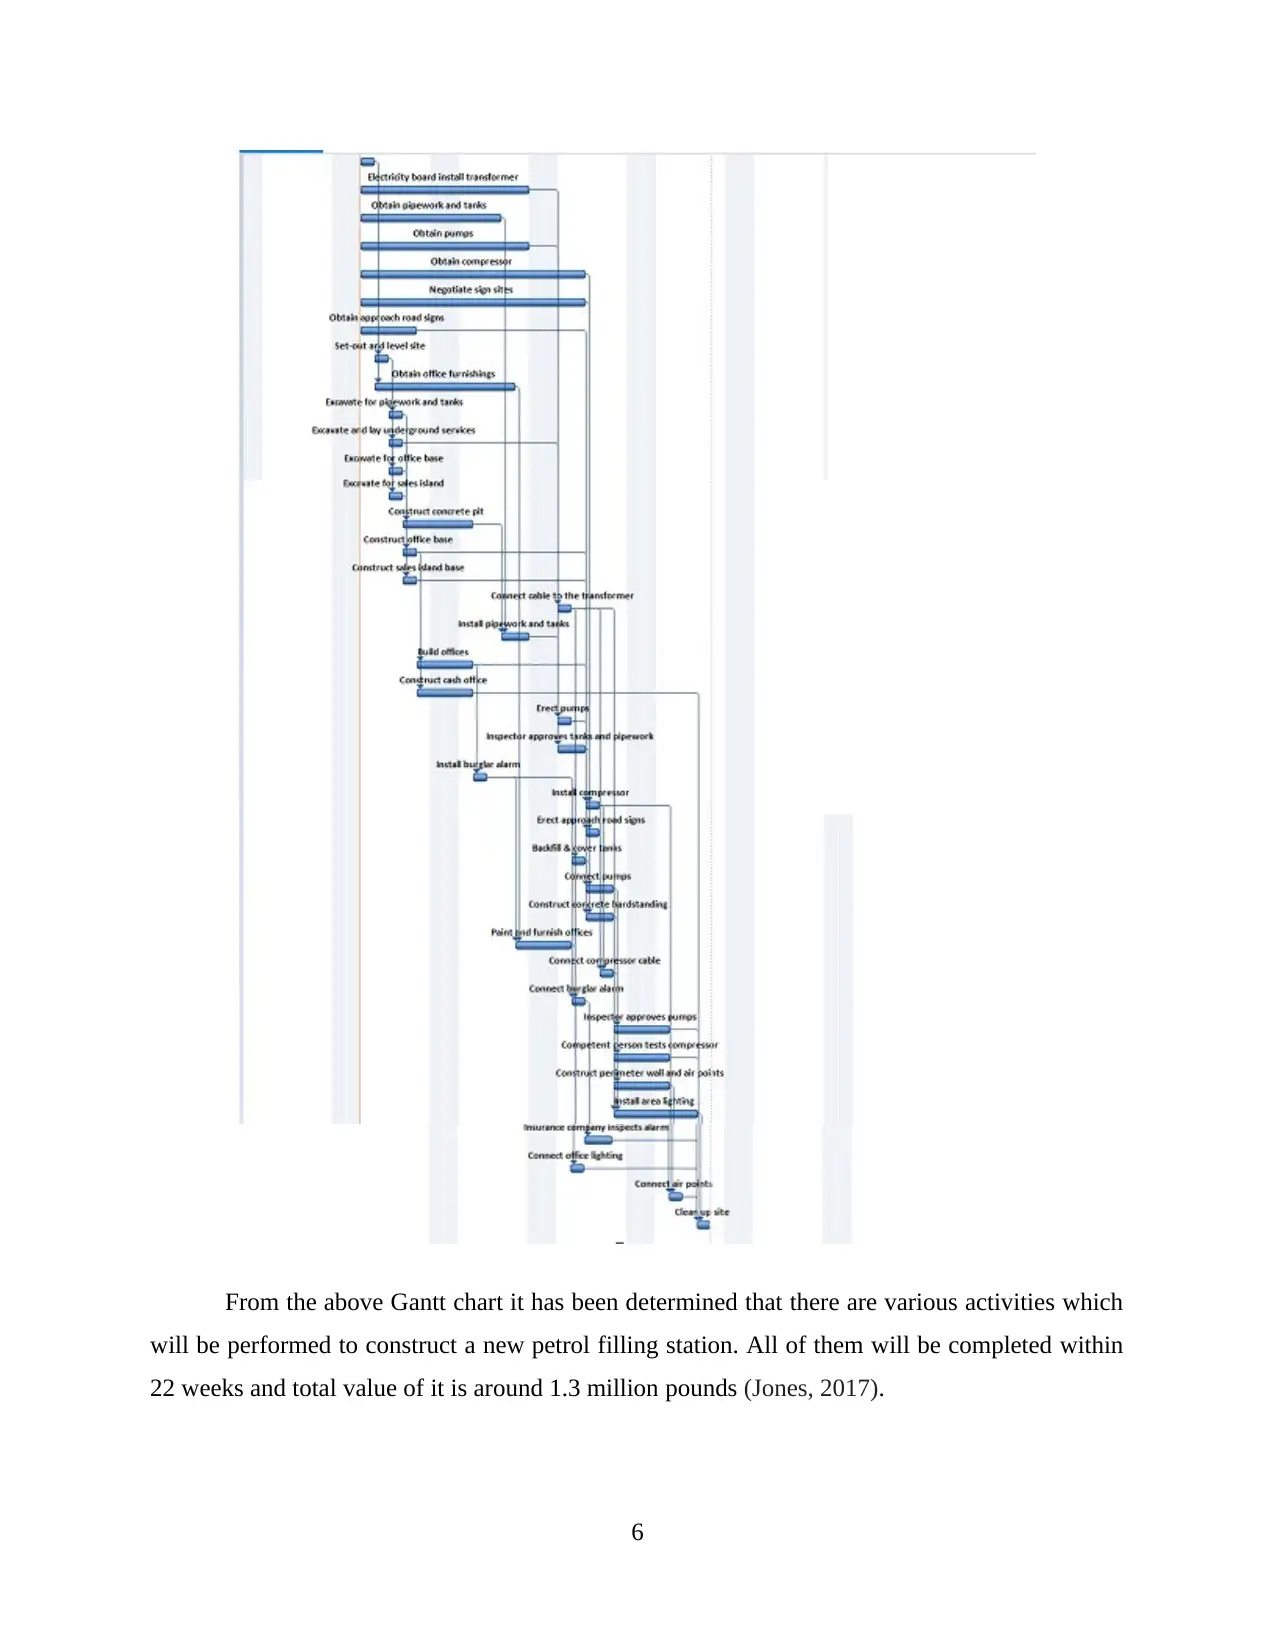
From the above Gantt chart it has been determined that there are various activities which
will be performed to construct a new petrol filling station. All of them will be completed within
22 weeks and total value of it is around 1.3 million pounds (Jones, 2017).
6
will be performed to construct a new petrol filling station. All of them will be completed within
22 weeks and total value of it is around 1.3 million pounds (Jones, 2017).
6
C. Calculation of probability of the project completion within timescale originally estimated in
part a
Probability of project completion: It can be defined as the process of determining the
chances of happing an event (Probability, 2020). The actual value of it varies between 0 to 1. In
the results 0 shows the impossibility of event and 1 indicates the certainty of the same (Kabir and
Sumi, 2014). In order to determine the possibility of successful completion of the project of new
patrol filling station probability of the same is calculated. Calculation of it is as follows:
Formula: P (A) = n (E) – n (S)
= 2 / 6
= 0.33
From the above calculation it has been determined that there is 33% chances of that the
project will be completed in the pre-decided time limit and meet the targets.
D. Determination of the most cost effective way in which project's overall duration can be
accelerated by three weeks
From the table 3 of new petrol filling station's crashing data it has been determined that
the highest crashing cost will be faced by activity T and on the other hand the lowest cost will be
for activity G1. Minimum crashed duration for T and D1 are 1 and 1. Normal duration for both
of them is same as the other one (Ko, 2014).
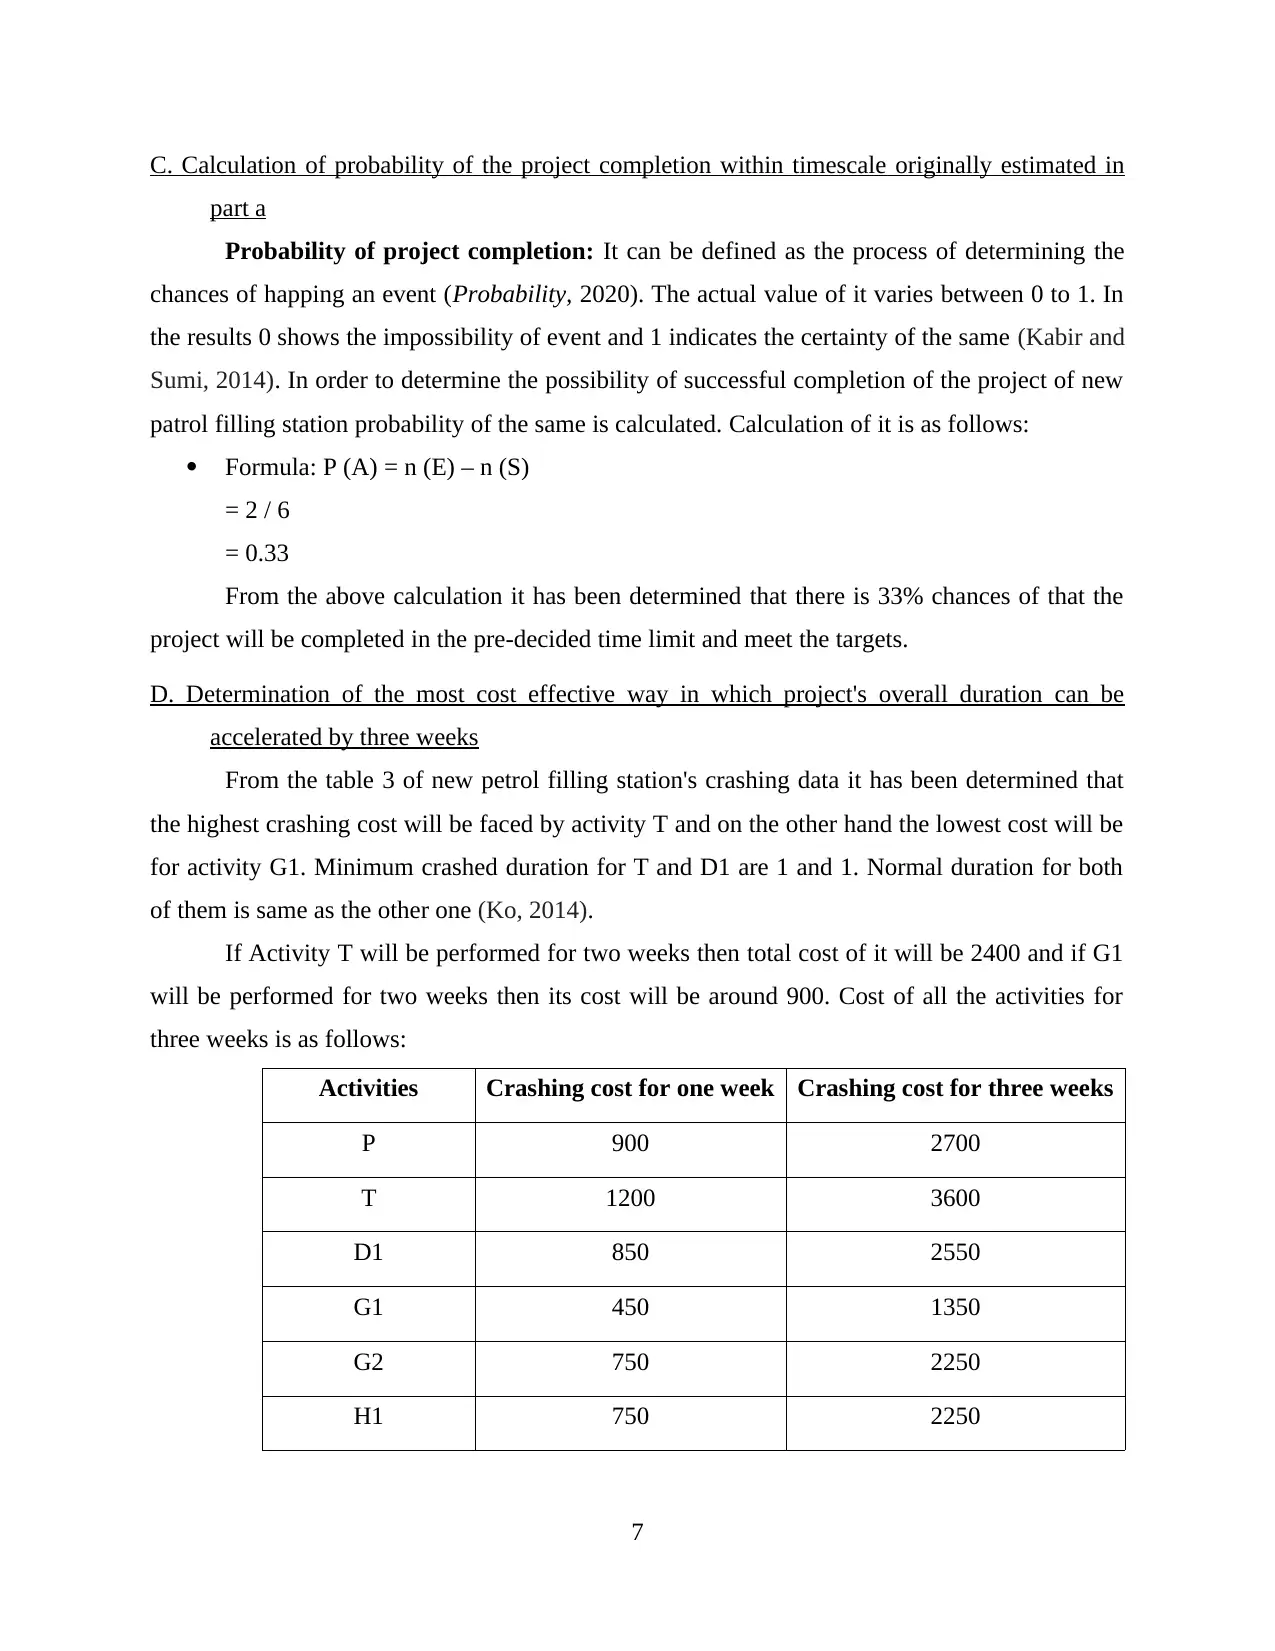
If Activity T will be performed for two weeks then total cost of it will be 2400 and if G1
will be performed for two weeks then its cost will be around 900. Cost of all the activities for
three weeks is as follows:
Activities Crashing cost for one week Crashing cost for three weeks
P 900 2700
T 1200 3600
D1 850 2550
G1 450 1350
G2 750 2250
H1 750 2250
7
part a
Probability of project completion: It can be defined as the process of determining the
chances of happing an event (Probability, 2020). The actual value of it varies between 0 to 1. In
the results 0 shows the impossibility of event and 1 indicates the certainty of the same (Kabir and
Sumi, 2014). In order to determine the possibility of successful completion of the project of new
patrol filling station probability of the same is calculated. Calculation of it is as follows:
Formula: P (A) = n (E) – n (S)
= 2 / 6
= 0.33
From the above calculation it has been determined that there is 33% chances of that the
project will be completed in the pre-decided time limit and meet the targets.
D. Determination of the most cost effective way in which project's overall duration can be
accelerated by three weeks
From the table 3 of new petrol filling station's crashing data it has been determined that
the highest crashing cost will be faced by activity T and on the other hand the lowest cost will be
for activity G1. Minimum crashed duration for T and D1 are 1 and 1. Normal duration for both
of them is same as the other one (Ko, 2014).
If Activity T will be performed for two weeks then total cost of it will be 2400 and if G1
will be performed for two weeks then its cost will be around 900. Cost of all the activities for
three weeks is as follows:
Activities Crashing cost for one week Crashing cost for three weeks
P 900 2700
T 1200 3600
D1 850 2550
G1 450 1350
G2 750 2250
H1 750 2250
7
⊘ This is a preview!⊘
Do you want full access?
Subscribe today to unlock all pages.
Trusted by 1+ million students worldwide
From the above table it has been determined that crashing cost of G1 activity is the
lowest and the highest one is related to T. By observing all of the costs for three weeks it has
been analysed that most cost effective way in which project's duration can be accelerated by
three weeks is activity G1 as its cost is very low and by working on it the predetermined goals
will be accomplished successfully (Krishnaswamy, 2016).
TASK 3
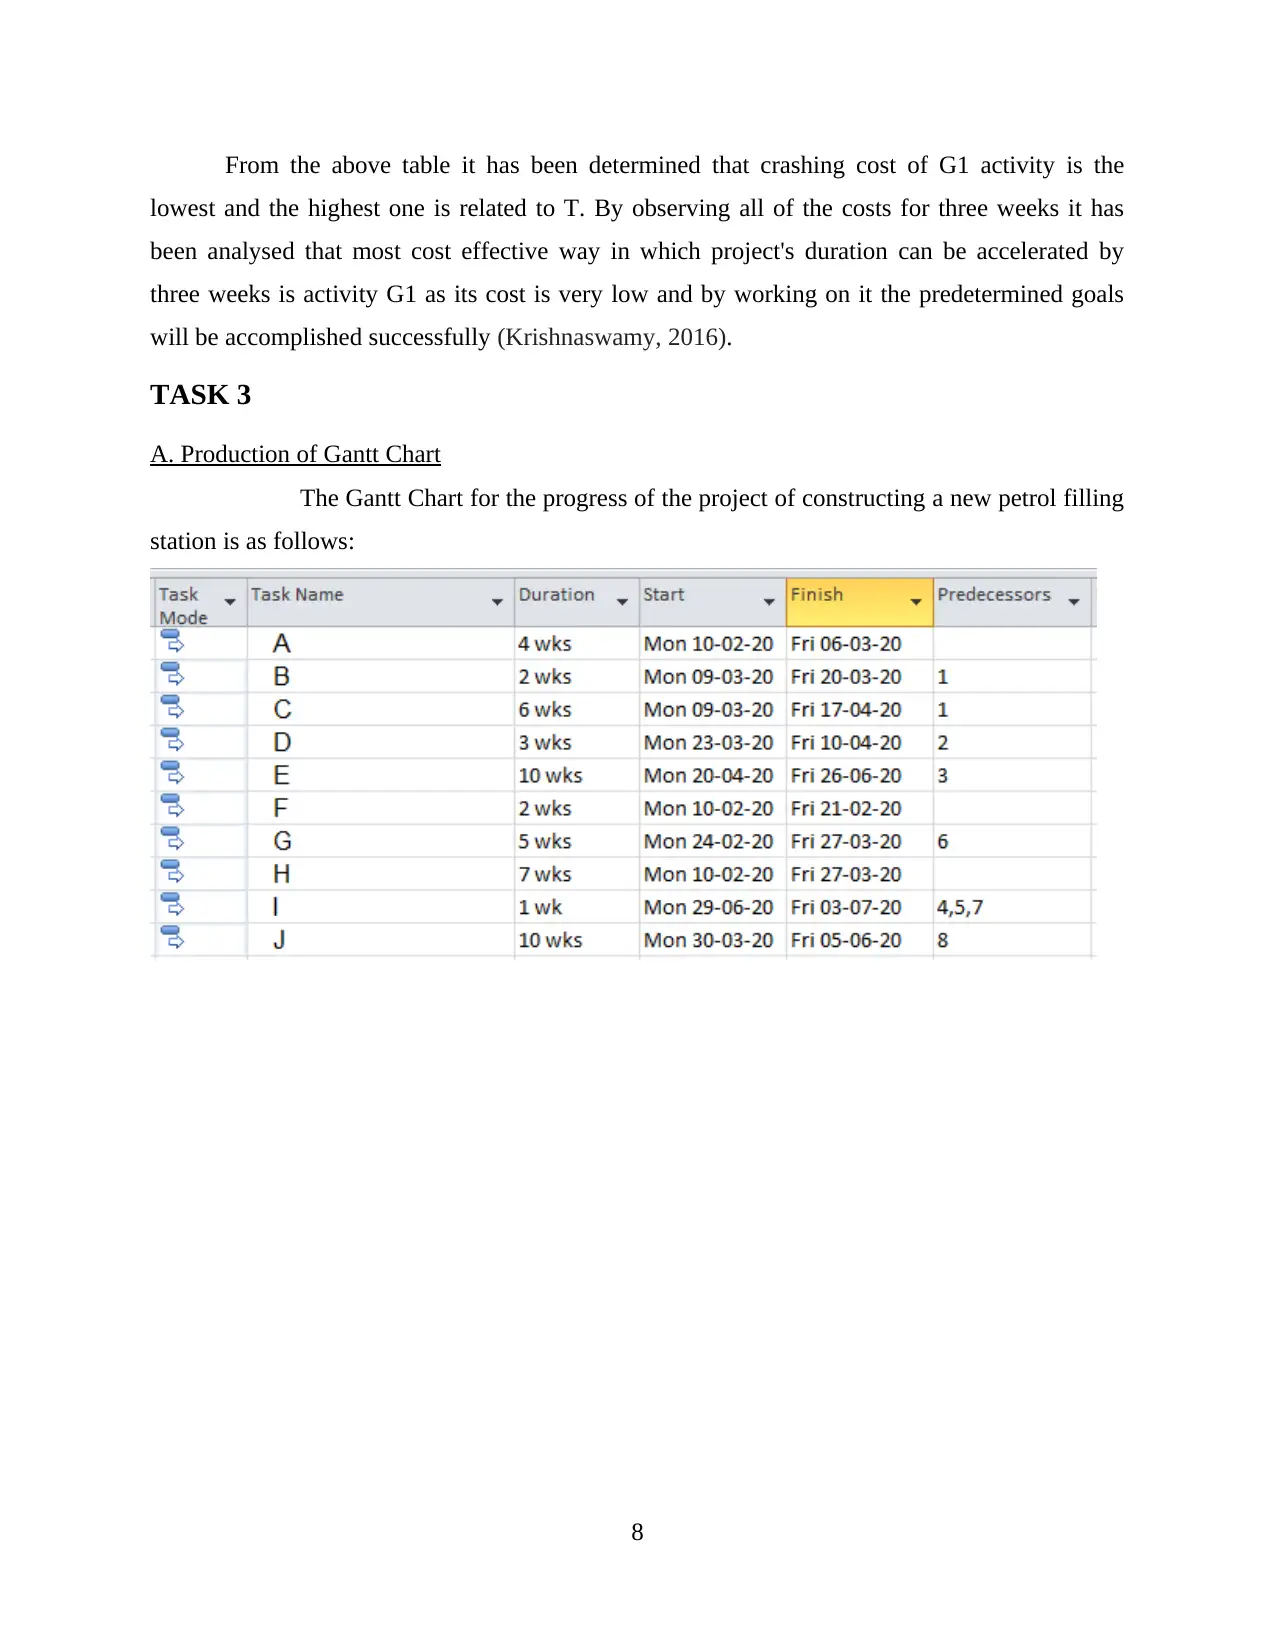
A. Production of Gantt Chart
The Gantt Chart for the progress of the project of constructing a new petrol filling
station is as follows:
8
lowest and the highest one is related to T. By observing all of the costs for three weeks it has
been analysed that most cost effective way in which project's duration can be accelerated by
three weeks is activity G1 as its cost is very low and by working on it the predetermined goals
will be accomplished successfully (Krishnaswamy, 2016).
TASK 3
A. Production of Gantt Chart
The Gantt Chart for the progress of the project of constructing a new petrol filling
station is as follows:
8
Paraphrase This Document
Need a fresh take? Get an instant paraphrase of this document with our AI Paraphraser
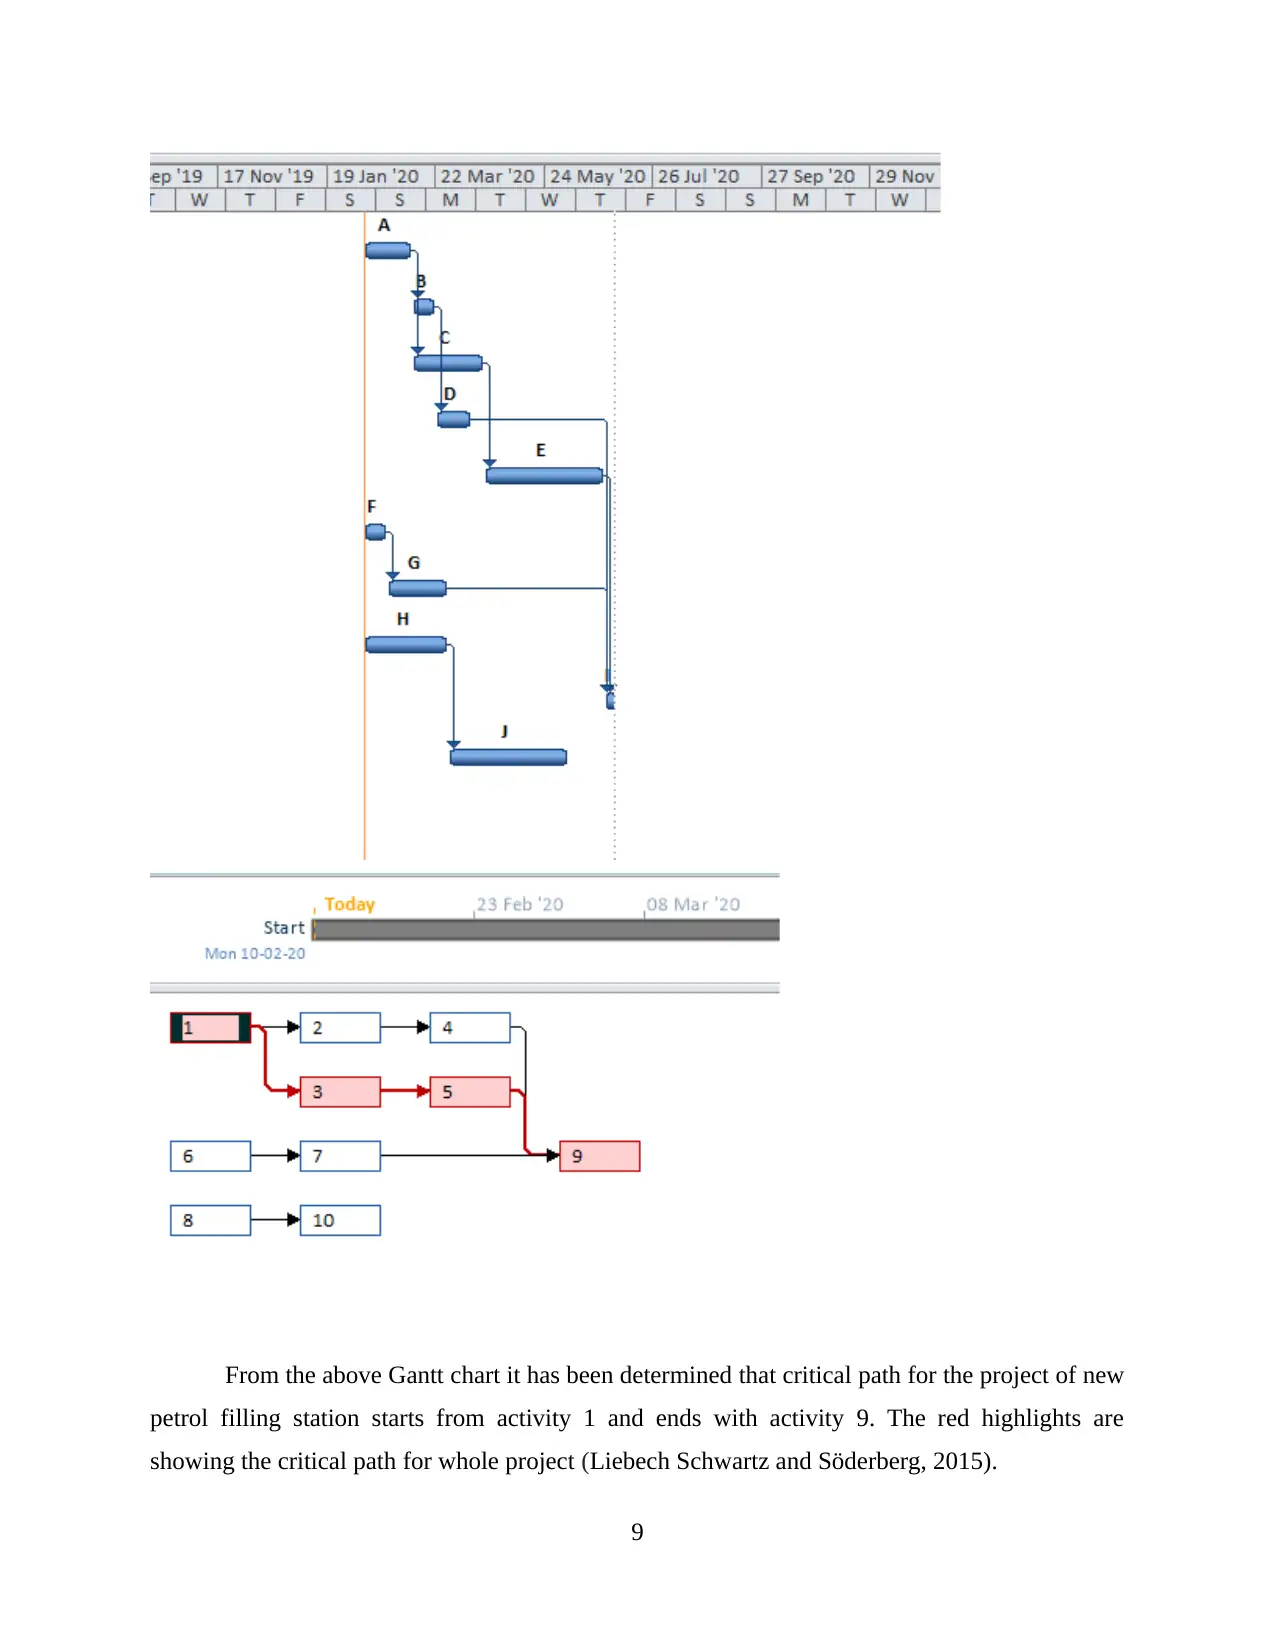
From the above Gantt chart it has been determined that critical path for the project of new
petrol filling station starts from activity 1 and ends with activity 9. The red highlights are
showing the critical path for whole project (Liebech Schwartz and Söderberg, 2015).
9
petrol filling station starts from activity 1 and ends with activity 9. The red highlights are
showing the critical path for whole project (Liebech Schwartz and Söderberg, 2015).
9
B. Calculation of planned value of the project at the end of week 10
Planned value: It can be defined as the authorised budget which is allocated to different
teams of the organisations for the purpose of accomplishing the targeted goals. It is very
important for the project managers to make sure that they analyse it before starting the work. It is
also considered as the baseline for a specific task. Main purpose of it is to facilitate the
management to assess the delivery of project so that its benefits for the organisation could be
determined. It is calculated for the purpose of monitoring the cost of project which is compared
to specific value of baseline. Calculation of it is as follows:
Formula: Completed percentage of project * total budget (project cost)
= 57% * 655
= 373.35 million pounds
Working notes:
Calculation of completed percentage of the project at the end of week 10 is as follows:
In order to calculate it average percentage of completed activities is taken.
= (100 + 100 + 40 + 80 + 0 + 100 + 50 + 100 + 0 + 0) / 10
= 570 / 10
= 57 (Percentage of completed project)
Calculation for the total cost of project is as follows:
The budget which is allocated to each activity is take to determine the total cost.
= 90 + 35 + 75 + 60 + 80 + 40 + 55 + 80 + 40 + 100
= 655 million pounds
C. Computation of earned value of the work completed at the end of week 10
Earned value: It can be defined as an approach which is mainly used for the purpose of
monitoring actual, completed work and project plan in order to analyse that planned activities are
performed properly or not (Manville, Matthias and Campbell, 2017). It shows that the time
which is spent by teams on a project will be sufficient to reach the goal or not. With the help of
it, progress of a project could be determined in terms of cost and time. It purpose is to get an
estimation of resources which will be used for completion of different tasks. Calculation of it is
as follows:
Formula = Percentage of completed project * Money spent on project (Budget used)
= 57% * 390
10
⊘ This is a preview!⊘
Do you want full access?
Subscribe today to unlock all pages.
Trusted by 1+ million students worldwide
1 out of 19
Related Documents


Your All-in-One AI-Powered Toolkit for Academic Success.
+13062052269
info@desklib.com
Available 24*7 on WhatsApp / Email
![[object Object]](/_next/static/media/star-bottom.7253800d.svg)
Unlock your academic potential
Copyright © 2020–2026 A2Z Services. All Rights Reserved. Developed and managed by ZUCOL.