Management Accounting Assignment: Cost Analysis and CVP
VerifiedAdded on 2020/05/28
|6
|1178
|156
Homework Assignment
AI Summary
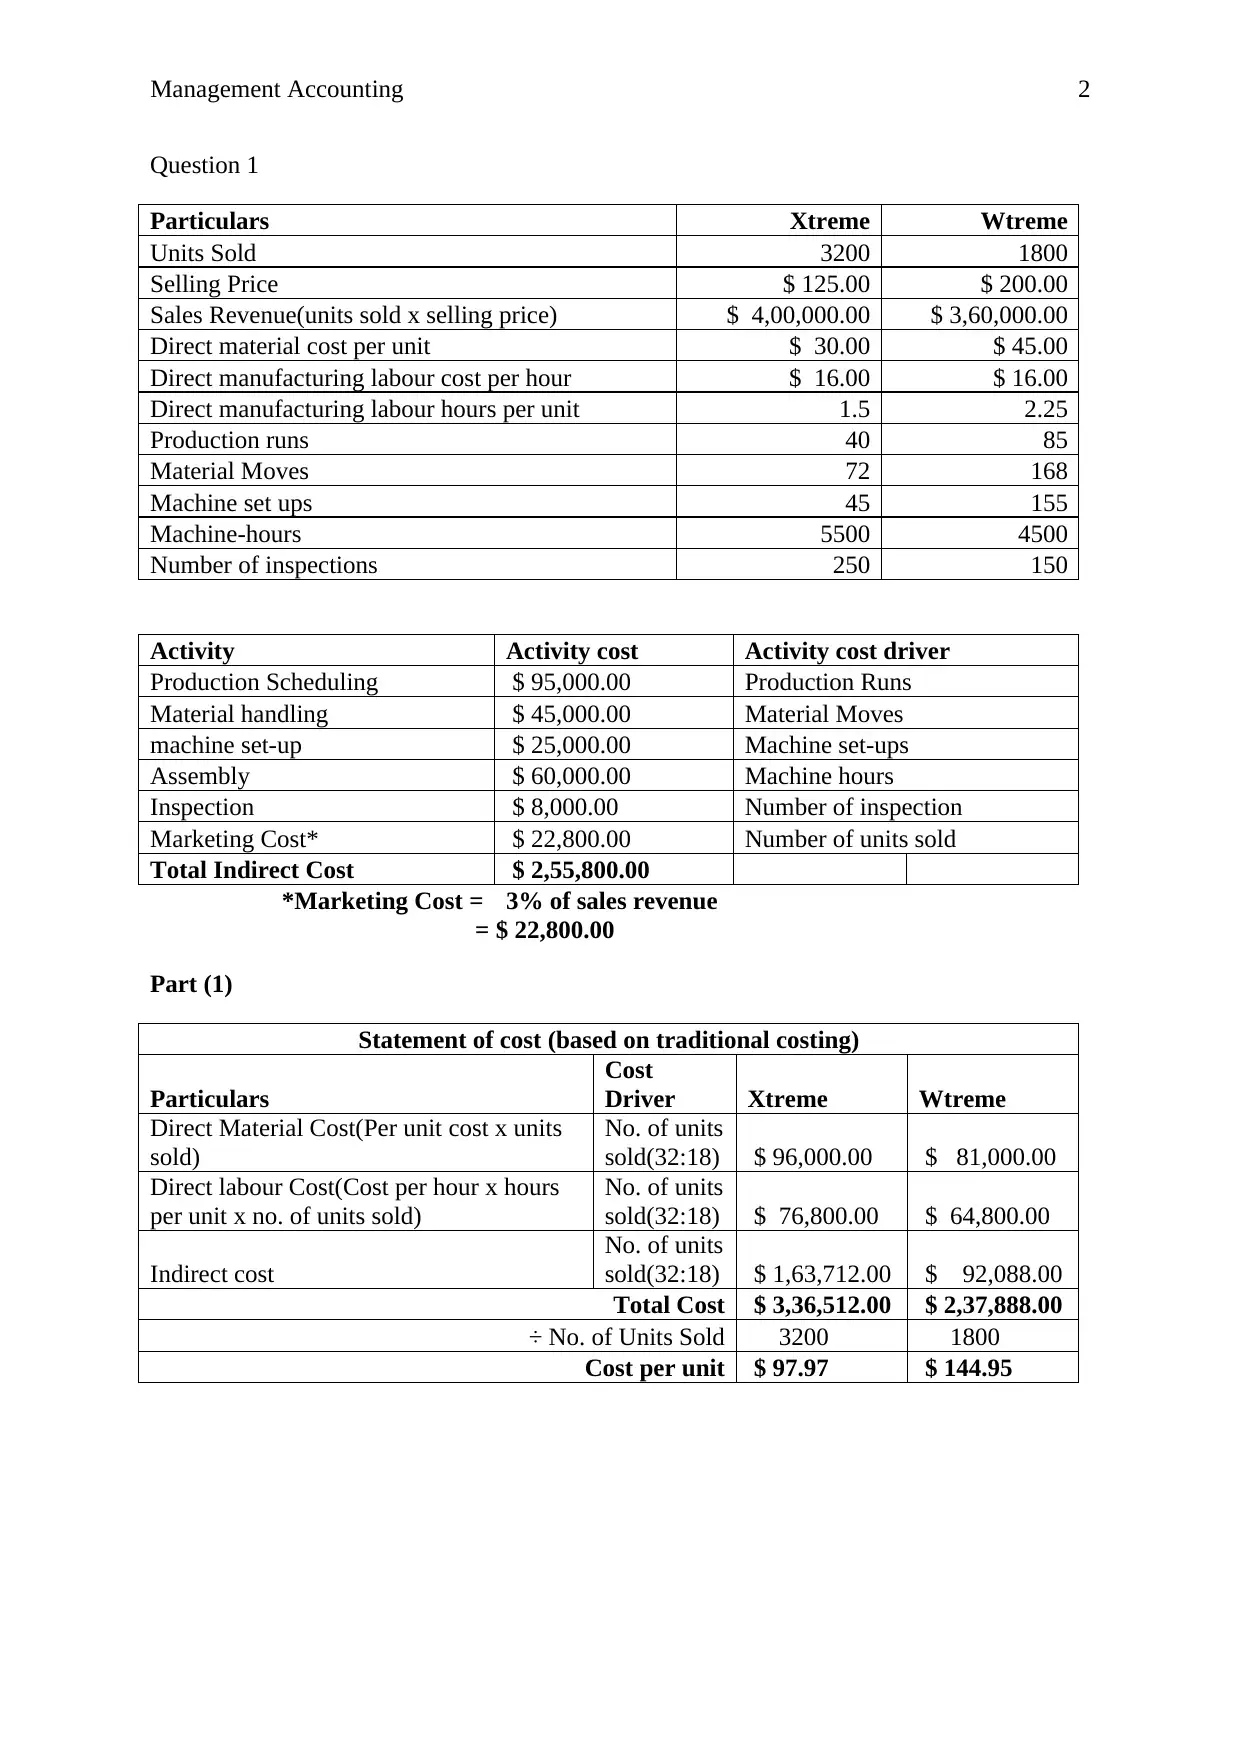
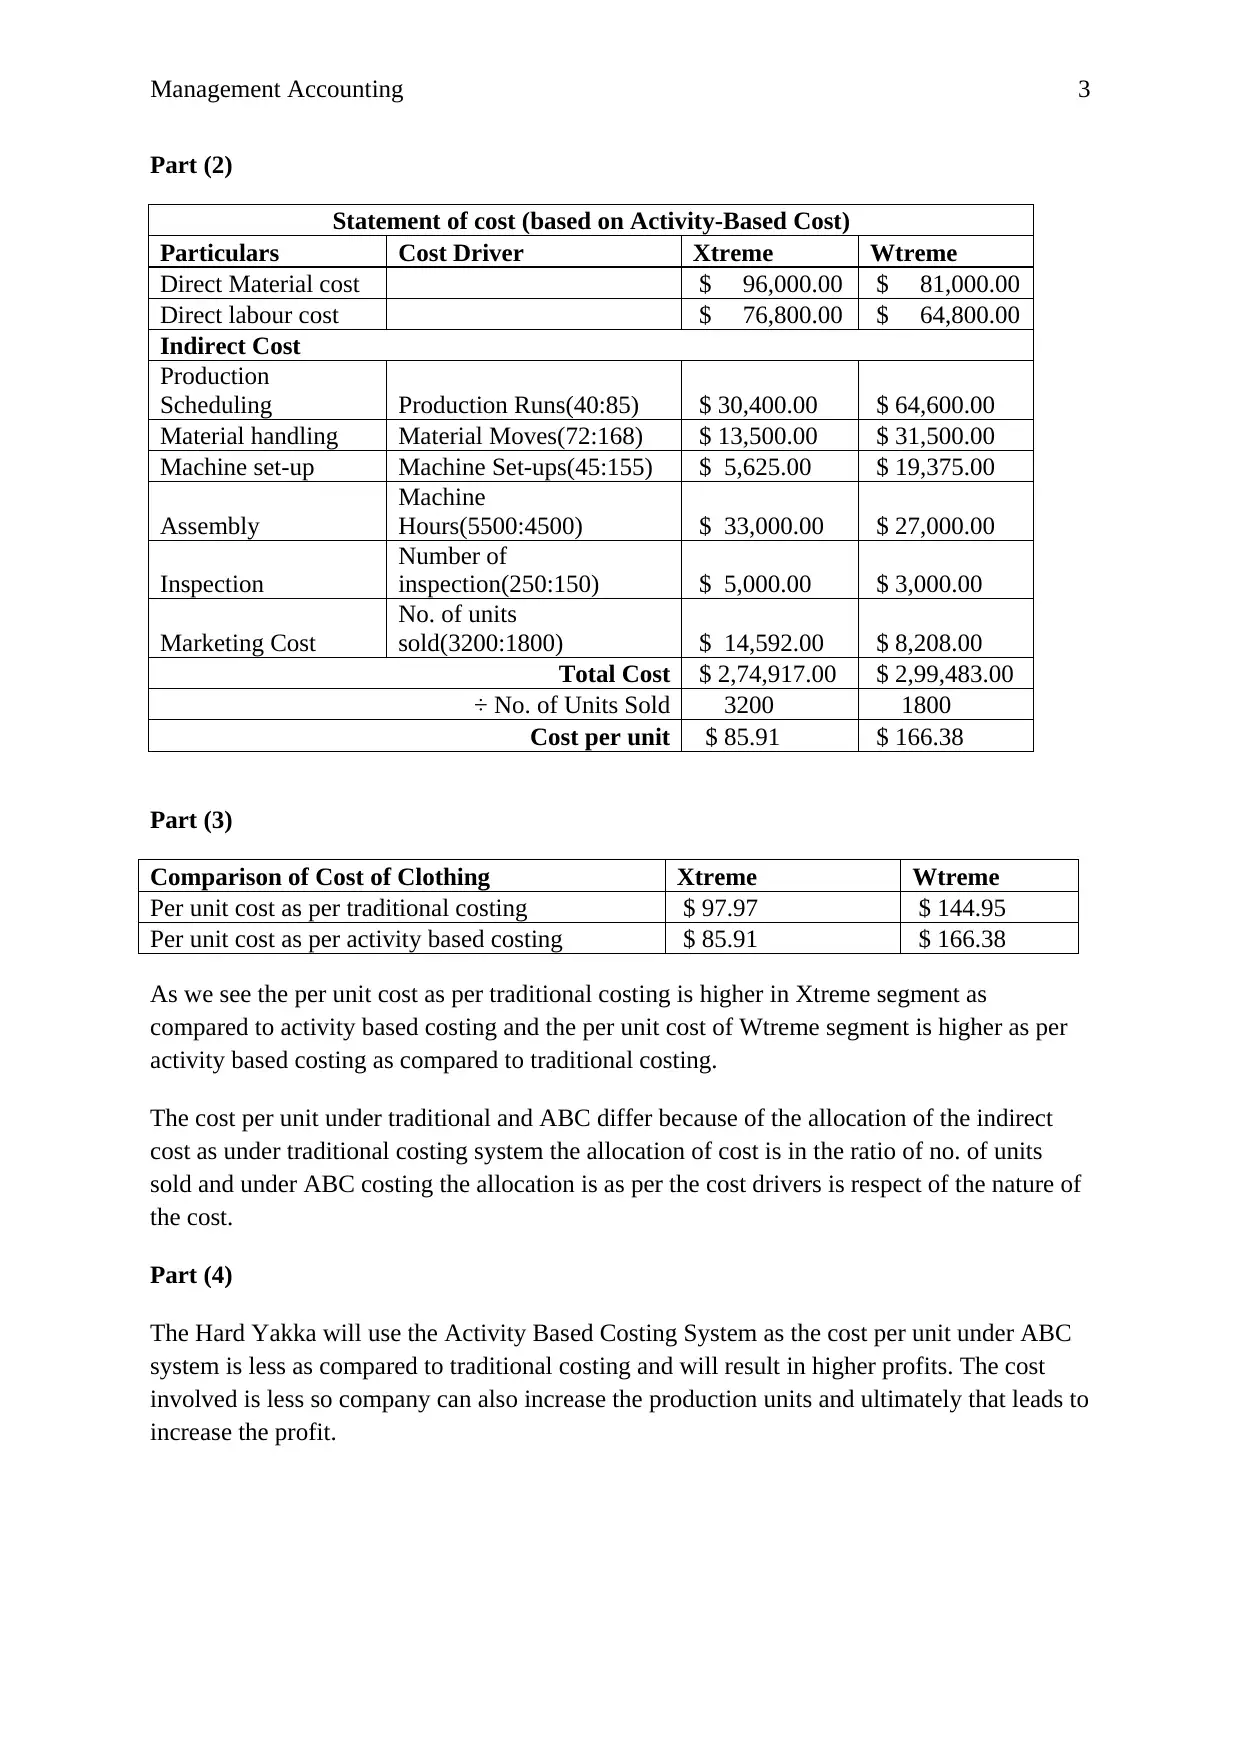
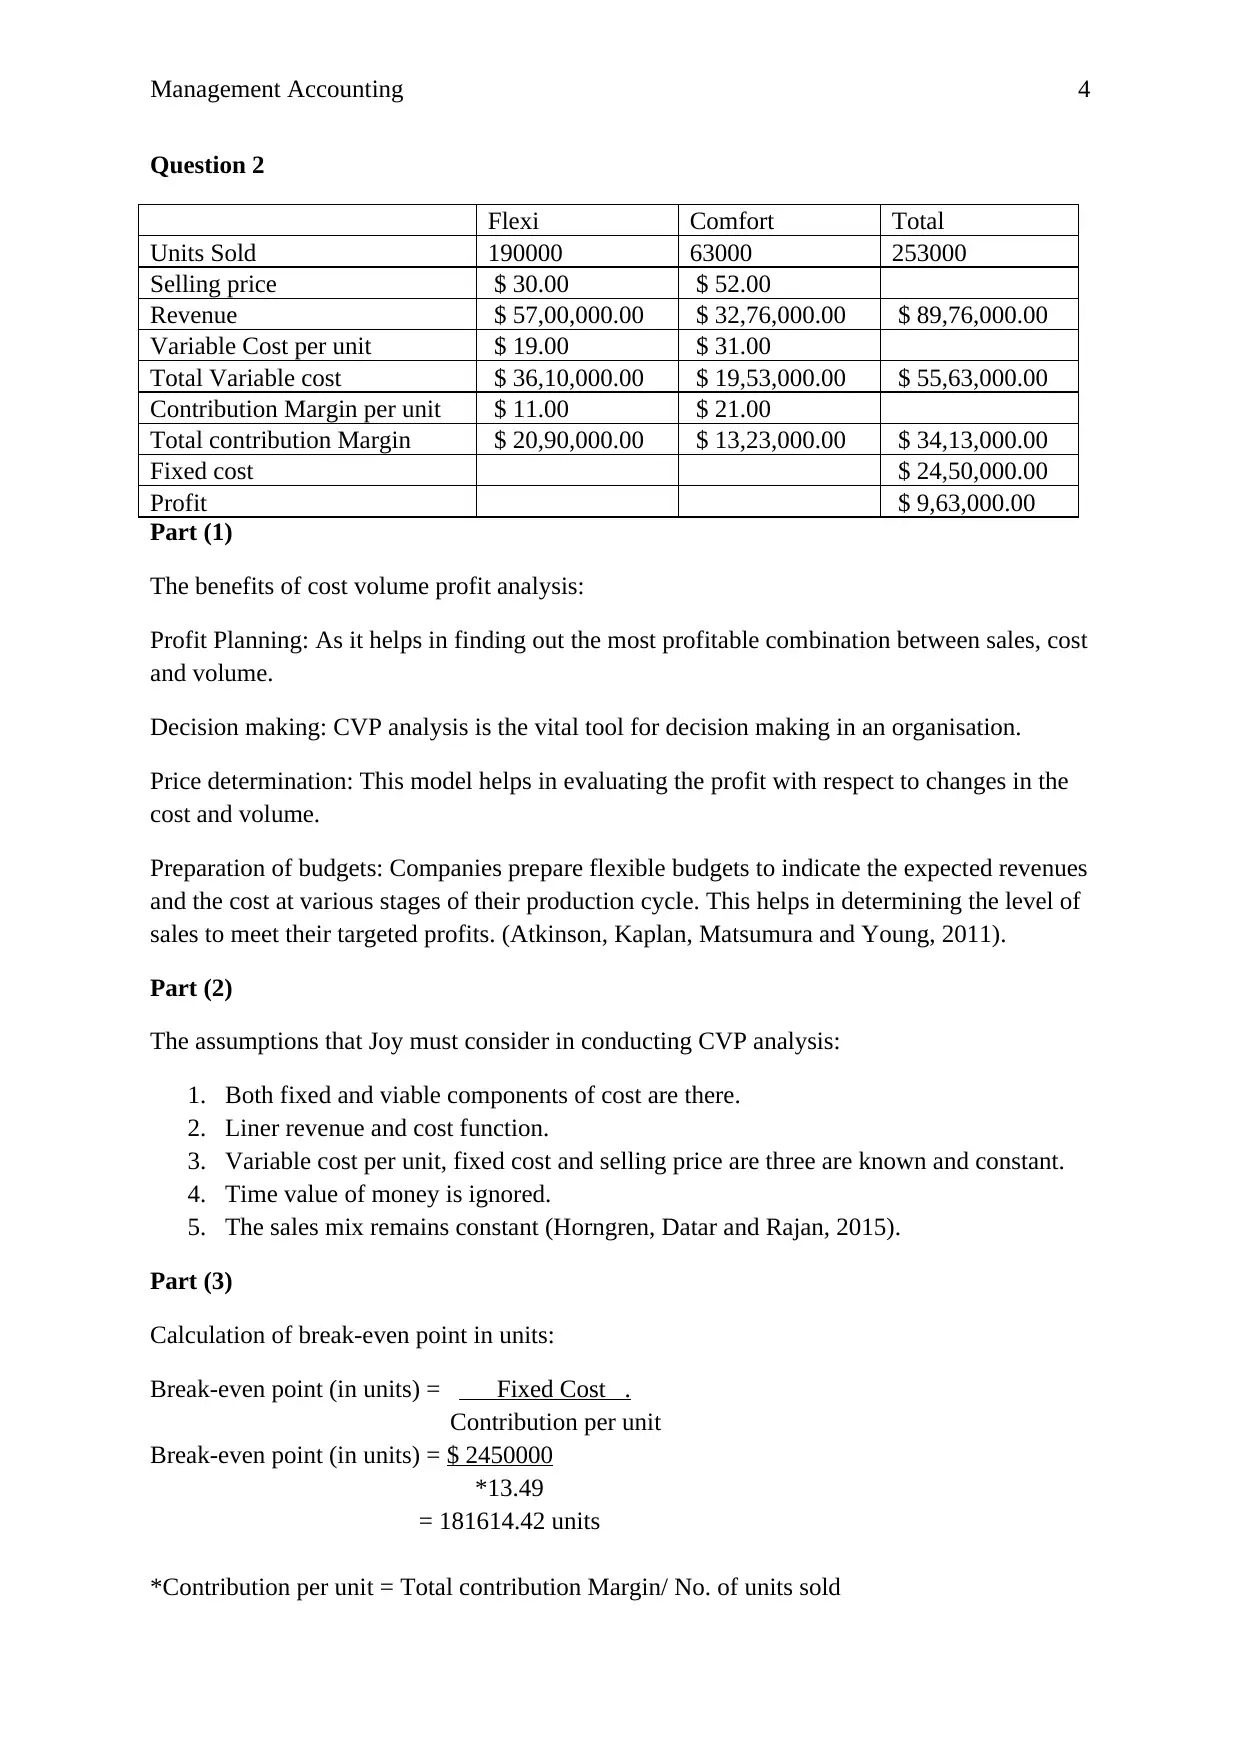
This document presents a comprehensive solution to a management accounting assignment. The solution begins with a detailed cost analysis using both traditional costing and activity-based costing (ABC) methods, comparing the results and explaining the differences in per-unit costs for two produ...

Running Head: Management Accounting
Management Accounting
Paraphrase This Document
Need a fresh take? Get an instant paraphrase of this document with our AI Paraphraser

Management Accounting 2
Question 1
Particulars Xtreme Wtreme
Units Sold 3200 1800
Selling Price $ 125.00 $ 200.00
Sales Revenue(units sold x selling price) $ 4,00,000.00 $ 3,60,000.00
Direct material cost per unit $ 30.00 $ 45.00
Direct manufacturing labour cost per hour $ 16.00 $ 16.00
Direct manufacturing labour hours per unit 1.5 2.25
Production runs 40 85
Material Moves 72 168
Machine set ups 45 155
Machine-hours 5500 4500
Number of inspections 250 150
Activity Activity cost Activity cost driver
Production Scheduling $ 95,000.00 Production Runs
Material handling $ 45,000.00 Material Moves
machine set-up $ 25,000.00 Machine set-ups
Assembly $ 60,000.00 Machine hours
Inspection $ 8,000.00 Number of inspection
Marketing Cost* $ 22,800.00 Number of units sold
Total Indirect Cost $ 2,55,800.00
*Marketing Cost = 3% of sales revenue
= $ 22,800.00
Part (1)
Statement of cost (based on traditional costing)
Particulars
Cost
Driver Xtreme Wtreme
Direct Material Cost(Per unit cost x units
sold)
No. of units
sold(32:18) $ 96,000.00 $ 81,000.00
Direct labour Cost(Cost per hour x hours
per unit x no. of units sold)
No. of units
sold(32:18) $ 76,800.00 $ 64,800.00
Indirect cost
No. of units
sold(32:18) $ 1,63,712.00 $ 92,088.00
Total Cost $ 3,36,512.00 $ 2,37,888.00
÷ No. of Units Sold 3200 1800
Cost per unit $ 97.97 $ 144.95

Management Accounting 3
Part (2)
Statement of cost (based on Activity-Based Cost)
Particulars Cost Driver Xtreme Wtreme
Direct Material cost $ 96,000.00 $ 81,000.00
Direct labour cost $ 76,800.00 $ 64,800.00
Indirect Cost
Production
Scheduling Production Runs(40:85) $ 30,400.00 $ 64,600.00
Material handling Material Moves(72:168) $ 13,500.00 $ 31,500.00
Machine set-up Machine Set-ups(45:155) $ 5,625.00 $ 19,375.00
Assembly
Machine
Hours(5500:4500) $ 33,000.00 $ 27,000.00
Inspection
Number of
inspection(250:150) $ 5,000.00 $ 3,000.00
Marketing Cost
No. of units
sold(3200:1800) $ 14,592.00 $ 8,208.00
Total Cost $ 2,74,917.00 $ 2,99,483.00
÷ No. of Units Sold 3200 1800
Cost per unit $ 85.91 $ 166.38
Part (3)
Comparison of Cost of Clothing Xtreme Wtreme
Per unit cost as per traditional costing $ 97.97 $ 144.95
Per unit cost as per activity based costing $ 85.91 $ 166.38
As we see the per unit cost as per traditional costing is higher in Xtreme segment as
compared to activity based costing and the per unit cost of Wtreme segment is higher as per
activity based costing as compared to traditional costing.
The cost per unit under traditional and ABC differ because of the allocation of the indirect
cost as under traditional costing system the allocation of cost is in the ratio of no. of units
sold and under ABC costing the allocation is as per the cost drivers is respect of the nature of
the cost.
Part (4)
The Hard Yakka will use the Activity Based Costing System as the cost per unit under ABC
system is less as compared to traditional costing and will result in higher profits. The cost
involved is less so company can also increase the production units and ultimately that leads to
increase the profit.
You're viewing a preview
Unlock full access by subscribing today!

Management Accounting 4
Question 2
Flexi Comfort Total
Units Sold 190000 63000 253000
Selling price $ 30.00 $ 52.00
Revenue $ 57,00,000.00 $ 32,76,000.00 $ 89,76,000.00
Variable Cost per unit $ 19.00 $ 31.00
Total Variable cost $ 36,10,000.00 $ 19,53,000.00 $ 55,63,000.00
Contribution Margin per unit $ 11.00 $ 21.00
Total contribution Margin $ 20,90,000.00 $ 13,23,000.00 $ 34,13,000.00
Fixed cost $ 24,50,000.00
Profit $ 9,63,000.00
Part (1)
The benefits of cost volume profit analysis:
Profit Planning: As it helps in finding out the most profitable combination between sales, cost
and volume.
Decision making: CVP analysis is the vital tool for decision making in an organisation.
Price determination: This model helps in evaluating the profit with respect to changes in the
cost and volume.
Preparation of budgets: Companies prepare flexible budgets to indicate the expected revenues
and the cost at various stages of their production cycle. This helps in determining the level of
sales to meet their targeted profits. (Atkinson, Kaplan, Matsumura and Young, 2011).
Part (2)
The assumptions that Joy must consider in conducting CVP analysis:
1. Both fixed and viable components of cost are there.
2. Liner revenue and cost function.
3. Variable cost per unit, fixed cost and selling price are three are known and constant.
4. Time value of money is ignored.
5. The sales mix remains constant (Horngren, Datar and Rajan, 2015).
Part (3)
Calculation of break-even point in units:
Break-even point (in units) = Fixed Cost .
Contribution per unit
Break-even point (in units) = $ 2450000
*13.49
= 181614.42 units
*Contribution per unit = Total contribution Margin/ No. of units sold
Paraphrase This Document
Need a fresh take? Get an instant paraphrase of this document with our AI Paraphraser

Management Accounting 5
= 3413000/ 253000
= 13.49 per unit
Part (4)
- If only Flexi chairs are sold:
Break-even point (in units) = Fixed Cost/ Contribution per unit
= 2450000/ 11
= 2227272.27 units
- If only Comfort chairs are sold:
Break-even point (in units) = Fixed Cost/ Contribution per unit
= 2450000/ 21
= 116666.67 units
Part (5)
Flexi Comfort Total
Units Sold 200000 65000 265000
Selling price $ 30.00 $ 52.00
Revenue $ 60,00,000.00 $ 33,80,000.00 $ 89,76,000.00
Variable Cost per unit $ 19.00 $ 31.00
Total Variable cost $ 38,00,000.00 $ 20,15,000.00 $ 55,63,000.00
Contribution Margin per unit $ 11.00 $ 21.00 $ 13.45
Total contribution Margin $ 22,00,000.00 $ 13,65,000.00 $ 35,65,000.00
Fixed cost $ 24,50,000.00
Profit $ 11,15,000.00
Calculation of break-even point in units:
Break-even point (in units) = Fixed Cost .
Contribution per unit
Break-even point (in units) = $ 2450000
*13.45
= 182117.81 units
* Contribution per unit = Total Contribution Margin/ No of units sold
= 3565000/ 265000
= 13.45
Part (6)
The break-even point is at 181614.42 units and the company is selling 263000 units. The
company is above break-even point and earning huge profit with the desired sales mix. The
company should always follow cost volume profit analysis as the company can make the
most profitable sales mix with CVP analysis.

Management Accounting 6
References:
Atkinson, A. A., Kaplan, R. S., Matsumura, E. M. and Young, S. M. 2011, Management
Accounting: Information for Decision Making and Strategy Execution, 6th Edition, Pearson
Education.
Horngren, C. T., Datar, S. M. and Rajan, M. V. 2015, Cost Accounting: A Managerial
Emphasis, 15th Edition (Global Edition), Pearson Education.
You're viewing a preview
Unlock full access by subscribing today!
1 out of 6
Related Documents

Your All-in-One AI-Powered Toolkit for Academic Success.
+13062052269
info@desklib.com
Available 24*7 on WhatsApp / Email
Unlock your academic potential
© 2024 | Zucol Services PVT LTD | All rights reserved.