Management Accounting Report: Hospital Cost Analysis and Prediction
VerifiedAdded on 2020/01/21
|21
|3972
|102
Report
AI Summary
This report delves into a comprehensive management accounting analysis, focusing on a hospital's operational costs and financial performance. It begins with a scatter diagram and high-low method to analyze administrative costs against patient load, followed by regression analysis for cost prediction. The report explores the impact of emergency procedures on administrative costs, evaluating the suitability of different prediction tools. It then covers equivalent units, cost per unit, and assignment of production costs, including a weighted average cost analysis. Further, the report addresses overhead allocation, calculating overhead rates, comparing actual and budgeted costs, and assessing the accuracy of cost estimation methods. Activity-based costing (ABC) is applied to determine service pricing, cash receipts, and budget preparation. The report also examines cost reallocation using direct, step-down, and reciprocal service methods, followed by a linear programming (LPP) analysis for meal preparation. Finally, it concludes with a cost quality report and comments on quality cost performance.
MANAGEMENT
ACCCOUNTING
ACCCOUNTING
Paraphrase This Document
Need a fresh take? Get an instant paraphrase of this document with our AI Paraphraser
TABLE OF CONTENTS
QUESTION 1..................................................................................................................................4
(1)Scatter diagram of administrative cost and patients load during first year of operations.......4
(2) High low method of management accounting for forecast....................................................4
(3) Prediction of administrative cost when 800 patients visit the hospital..................................5
(4) Regression analysis................................................................................................................5
(5) Impact of emergency procedures on the administrative cost.................................................7
(6) Suitability of tools used for predicting value of the variable.................................................8
QUESTION 2..................................................................................................................................9
(a)Equivalent units for material and conversion..........................................................................9
(b)Cost per equivalent unit for material and conversion.............................................................9
© Assignment of production cost................................................................................................9
(d)Weighted average unit cost of leather belts completed and transferred to finished goods...10
(2) Comment of the cost per belt of 11.50 which firm used for planning and control..............10
QUESTION 3................................................................................................................................10
1. Calculating the manufacturing overhead cost........................................................................10
2. Stating the overhead estimation which is highly true............................................................11
3. Calculating actual manufacturing overhead cost...................................................................11
Actual cost.................................................................................................................................12
4. Estimating the cost of overhead which is more accurate.......................................................12
QUESTION 4................................................................................................................................12
1. Calculation of the activity rates.............................................................................................12
2. Using activity based costing to prepare the wages and salary as well as business tax return
...................................................................................................................................................13
3. Evaluating the pricing policy which is used by the firm.......................................................14
Question 5......................................................................................................................................14
(1)Scheduled budgeted cash receipts.........................................................................................14
(2)Budgeted P&L statement for month of December................................................................14
(3)Balance in account payable on 31st December......................................................................14
QUESTION 6................................................................................................................................15
1. Using direct method to reallocate the budgeted cost.............................................................15
2. Stating the reallocation of the cost of human resources and computing on the basis of step
down method.............................................................................................................................15
3. Using the reciprocal service method for the purpose of reallocation....................................16
Question 7......................................................................................................................................17
(1)Objective function and constraints........................................................................................18
(2) Graph on constraints of Madras curry kitchen meal preparation process............................18
(3) Number of units to be produced to achieve objective..........................................................19
(4) Value of Madras curry kitchen contribution margin............................................................19
QUESTION 8................................................................................................................................19
1. Preparing a cost quality report for model ABC.....................................................................19
2. Commenting on the quality cost performance.......................................................................19
Table 1Variables used in calculation in high low method...............................................................4
Table 2Calculation of cost...............................................................................................................4
Table 3Regression statistics.............................................................................................................7
Table 4ANNOVA table...................................................................................................................8
Table 5 Coefficient table.................................................................................................................8
Table 6 Cost of material and conversion.........................................................................................9
Table 7 Assignment of cost for completed task and work in progress............................................9
Table 8 Weighted average cost......................................................................................................10
Table 9Computation of actual overhead rate.................................................................................11
Table 10Cash receipts of business firm in the month of December..............................................14
Table 11Income statement.............................................................................................................14
Table 12Account payable..............................................................................................................15
Table 13Values of HR and computing used for allocation............................................................16
Table 14Allocation by using step down method...........................................................................16
Table 15 LPP for Indian and Portuguese Cuisine..........................................................................17
Table 16Calculation for constraint 1.............................................................................................18
Table 17 Calculation for constraint 2............................................................................................18
Table 18 Computation for constraint 3..........................................................................................18
⊘ This is a preview!⊘
Do you want full access?
Subscribe today to unlock all pages.
Trusted by 1+ million students worldwide
Figure 1Scatter diagram of patient load and administrative cost....................................................5
Figure 2Chart predicting administrative cost on the basis of patient load......................................6
Figure 3Equation for predicting the administrative cost on the basis of patient load.....................7
Figure 4Equation for patient load and chart....................................................................................8
Figure 5Charting on LPP...............................................................................................................20
Paraphrase This Document
Need a fresh take? Get an instant paraphrase of this document with our AI Paraphraser
QUESTION 1
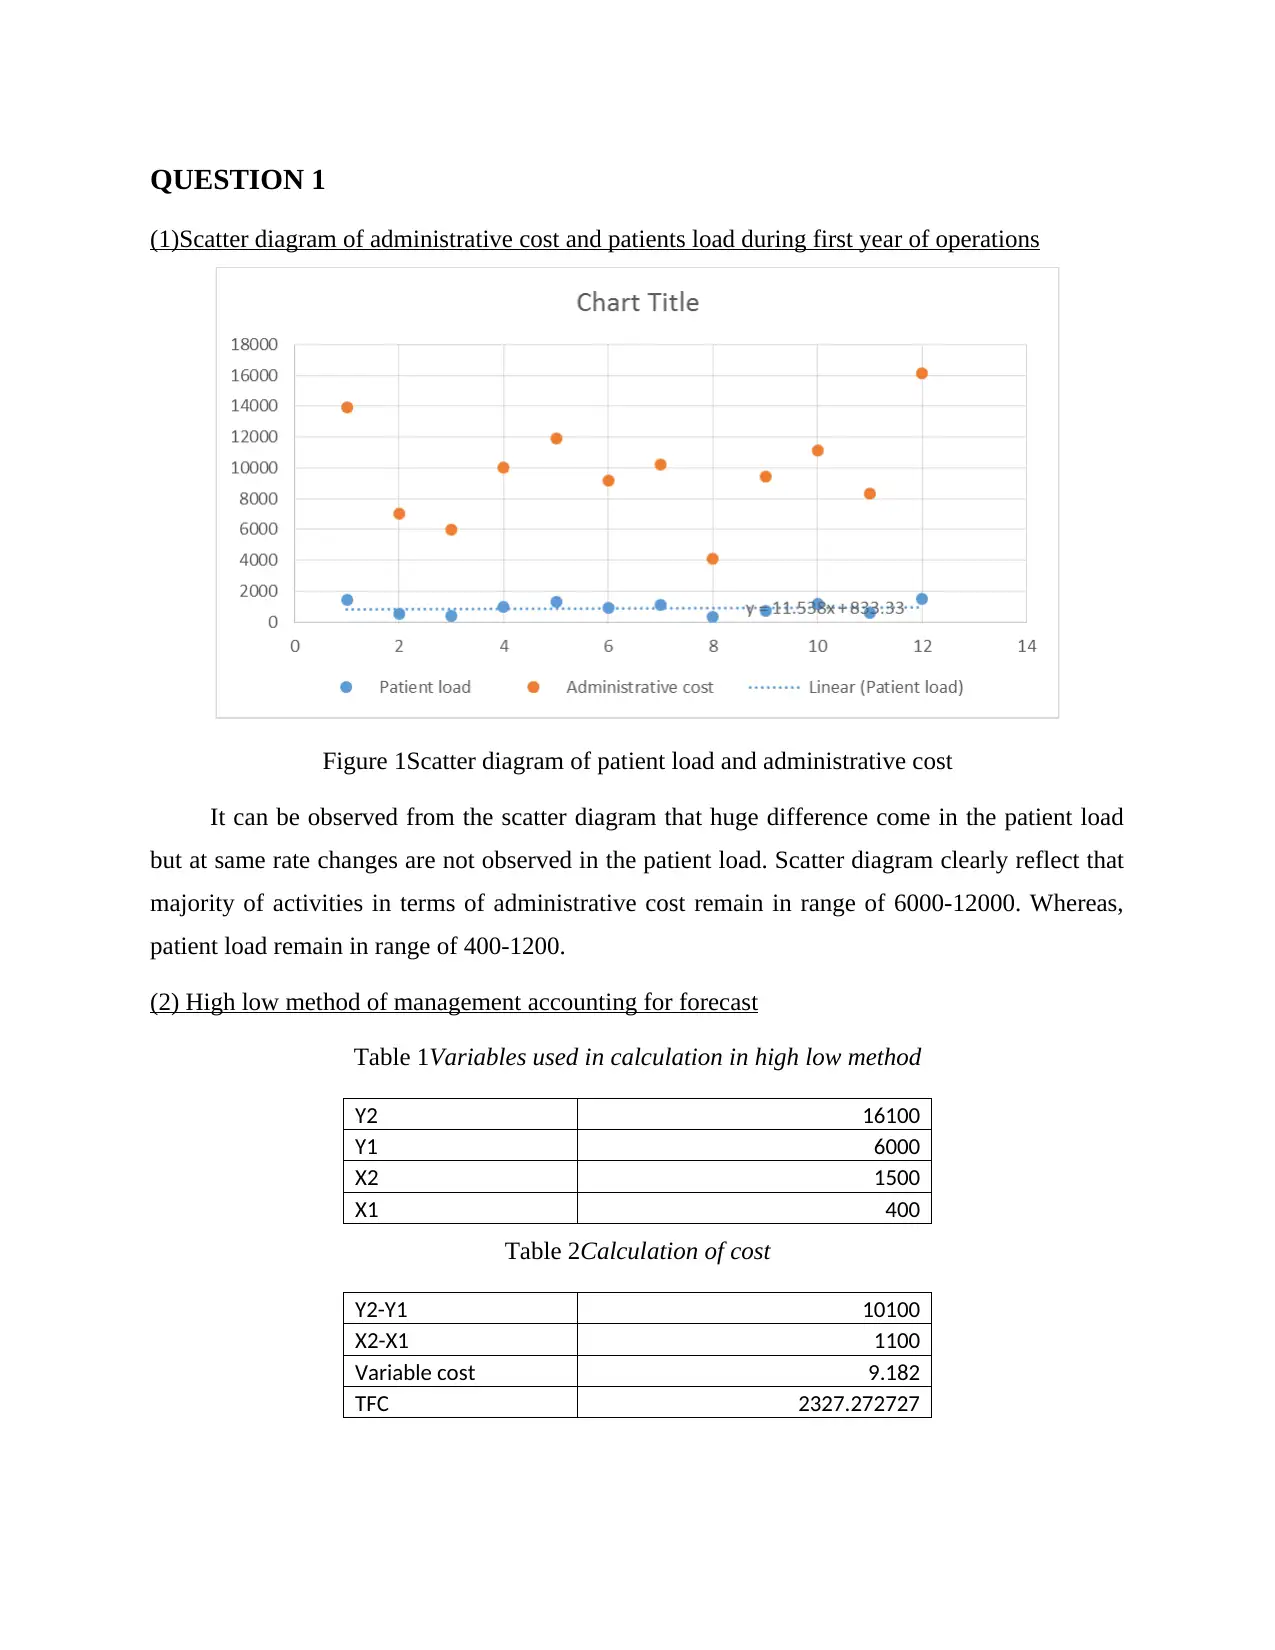
(1)Scatter diagram of administrative cost and patients load during first year of operations
Figure 1Scatter diagram of patient load and administrative cost
It can be observed from the scatter diagram that huge difference come in the patient load
but at same rate changes are not observed in the patient load. Scatter diagram clearly reflect that
majority of activities in terms of administrative cost remain in range of 6000-12000. Whereas,
patient load remain in range of 400-1200.
(2) High low method of management accounting for forecast
Table 1Variables used in calculation in high low method
Y2 16100
Y1 6000
X2 1500
X1 400
Table 2Calculation of cost
Y2-Y1 10100
X2-X1 1100
Variable cost 9.182
TFC 2327.272727
On the basis of high low method it is identified that variable cost for each patient load is 9.182
and fixed cost for same is 2327. This is computed by considering cost of high and low range of
business activities. Equation used in entire calculation is given below.
Variable cost= Y2-Y1/X2-X1
TFC= Y2-bX2
(3) Prediction of administrative cost when 800 patients visit the hospital
Regression equation in the above given scatter diagram is y=11538x+833.33. In order to
predict administrative cost on the basis of this equation number of patients that are expected to
arrive in the hospital are taken in to consideration. Hence, y= 11538*800+833.33 which means
y=10063. Thus, it is clear that administrative cost for 800 patients in the hospital will be 10063.
(4) Regression analysis
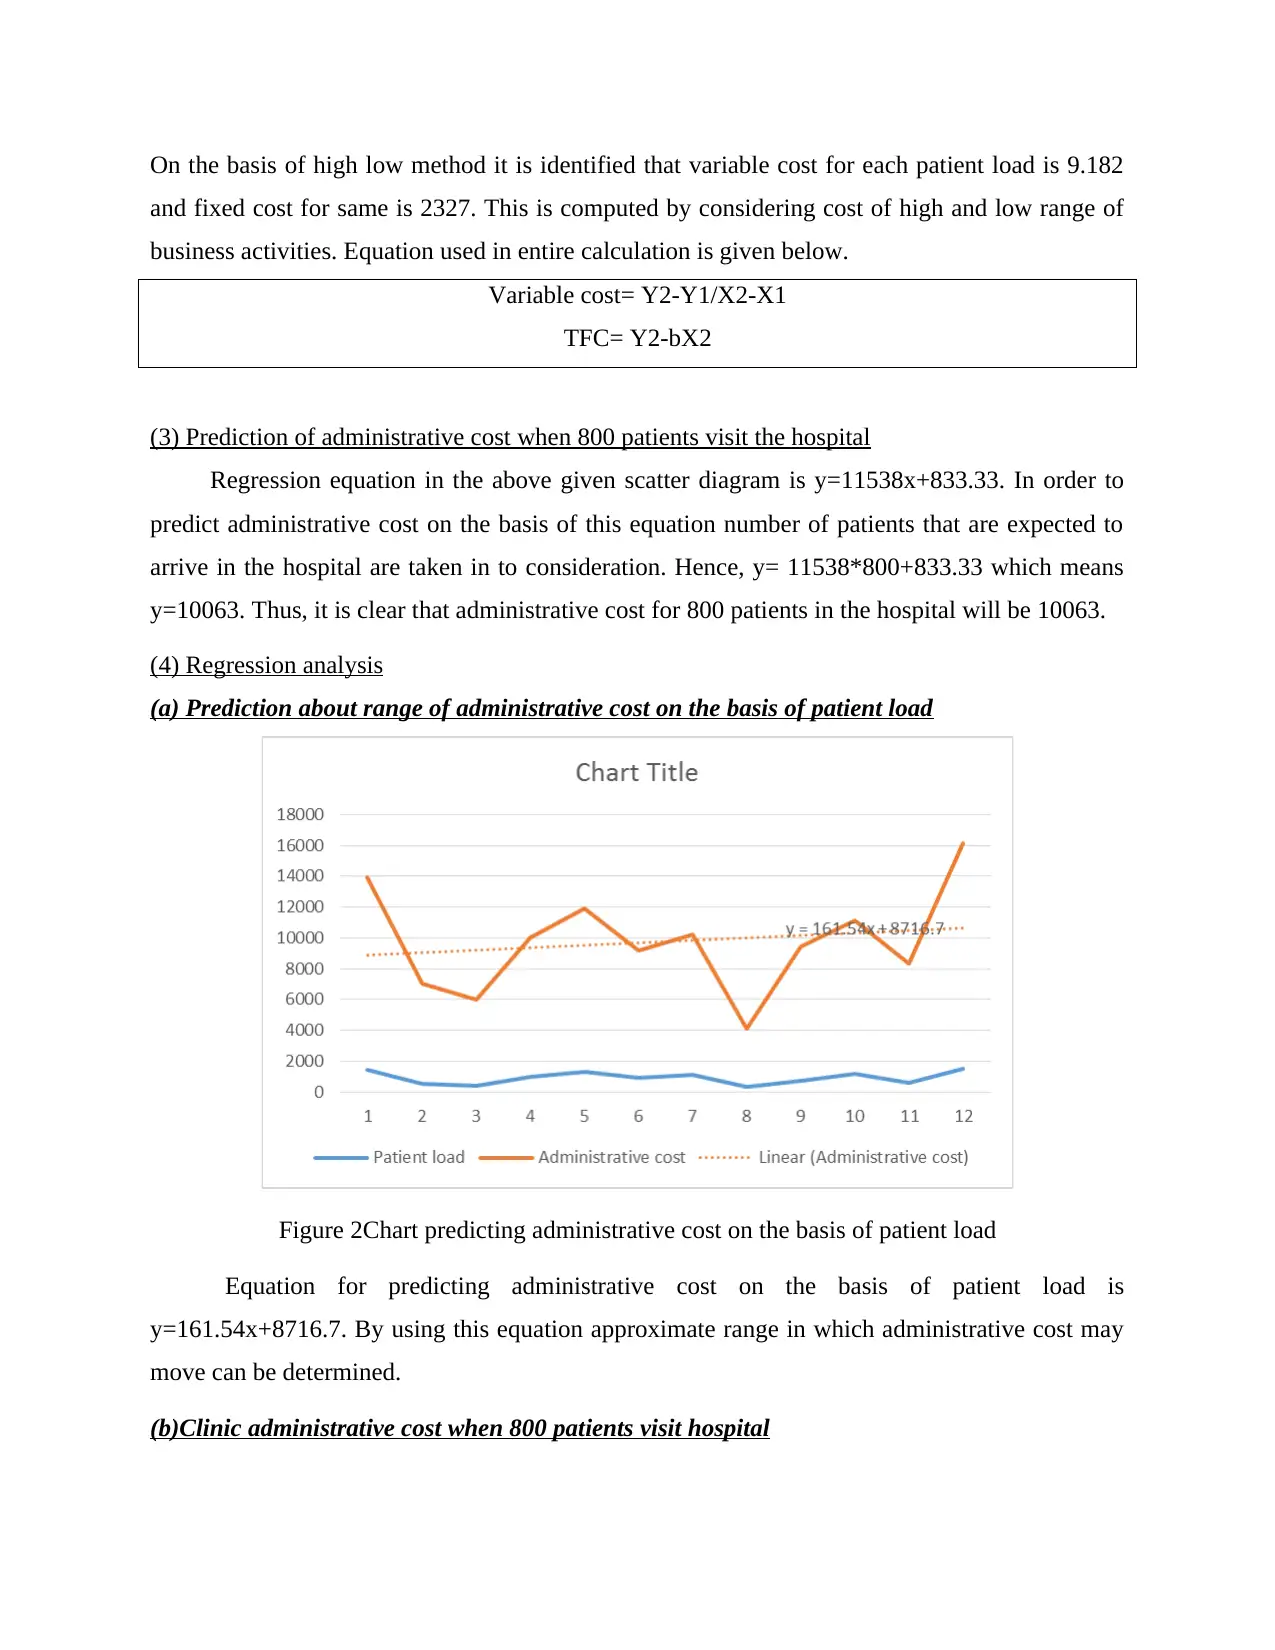
(a) Prediction about range of administrative cost on the basis of patient load
Figure 2Chart predicting administrative cost on the basis of patient load
Equation for predicting administrative cost on the basis of patient load is
y=161.54x+8716.7. By using this equation approximate range in which administrative cost may
move can be determined.
(b)Clinic administrative cost when 800 patients visit hospital
and fixed cost for same is 2327. This is computed by considering cost of high and low range of
business activities. Equation used in entire calculation is given below.
Variable cost= Y2-Y1/X2-X1
TFC= Y2-bX2
(3) Prediction of administrative cost when 800 patients visit the hospital
Regression equation in the above given scatter diagram is y=11538x+833.33. In order to
predict administrative cost on the basis of this equation number of patients that are expected to
arrive in the hospital are taken in to consideration. Hence, y= 11538*800+833.33 which means
y=10063. Thus, it is clear that administrative cost for 800 patients in the hospital will be 10063.
(4) Regression analysis
(a) Prediction about range of administrative cost on the basis of patient load
Figure 2Chart predicting administrative cost on the basis of patient load
Equation for predicting administrative cost on the basis of patient load is
y=161.54x+8716.7. By using this equation approximate range in which administrative cost may
move can be determined.
(b)Clinic administrative cost when 800 patients visit hospital
⊘ This is a preview!⊘
Do you want full access?
Subscribe today to unlock all pages.
Trusted by 1+ million students worldwide
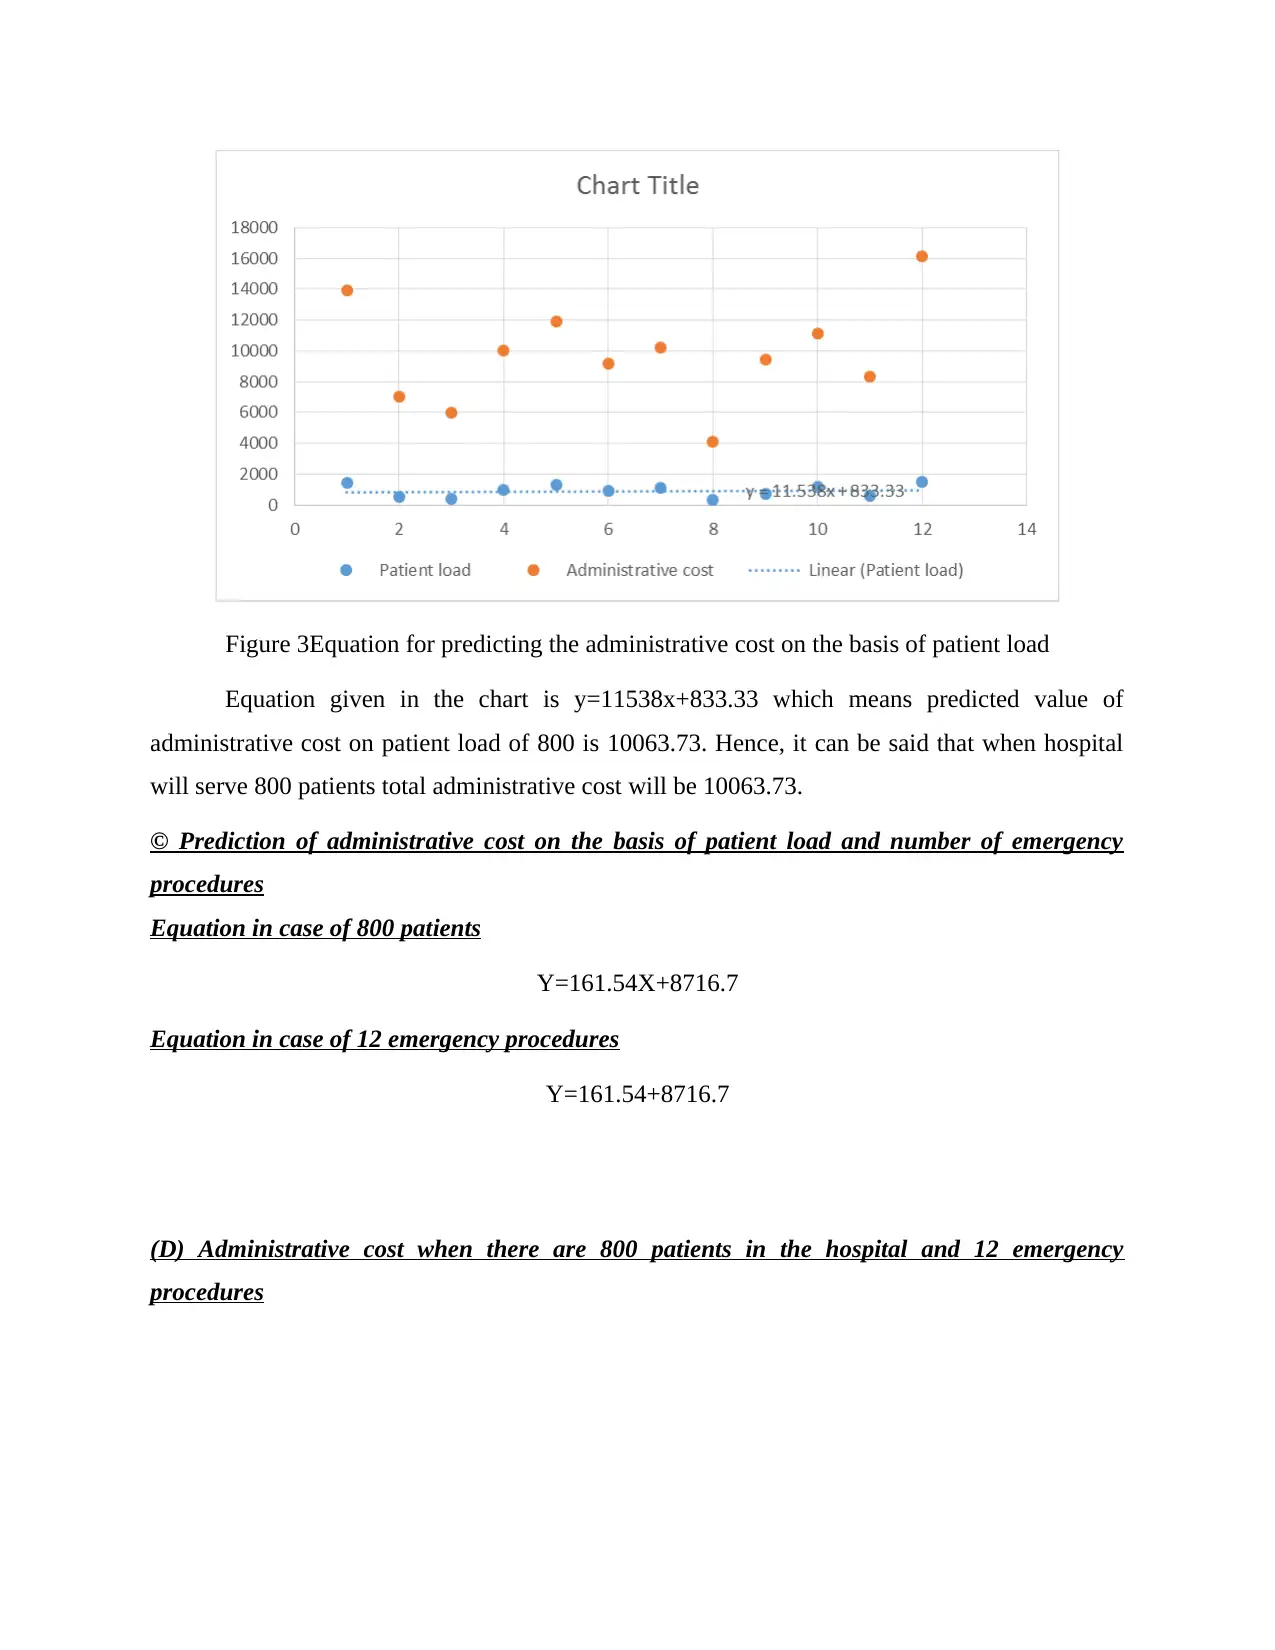
Figure 3Equation for predicting the administrative cost on the basis of patient load
Equation given in the chart is y=11538x+833.33 which means predicted value of
administrative cost on patient load of 800 is 10063.73. Hence, it can be said that when hospital
will serve 800 patients total administrative cost will be 10063.73.
© Prediction of administrative cost on the basis of patient load and number of emergency
procedures
Equation in case of 800 patients
Y=161.54X+8716.7
Equation in case of 12 emergency procedures
Y=161.54+8716.7
(D) Administrative cost when there are 800 patients in the hospital and 12 emergency
procedures
Paraphrase This Document
Need a fresh take? Get an instant paraphrase of this document with our AI Paraphraser
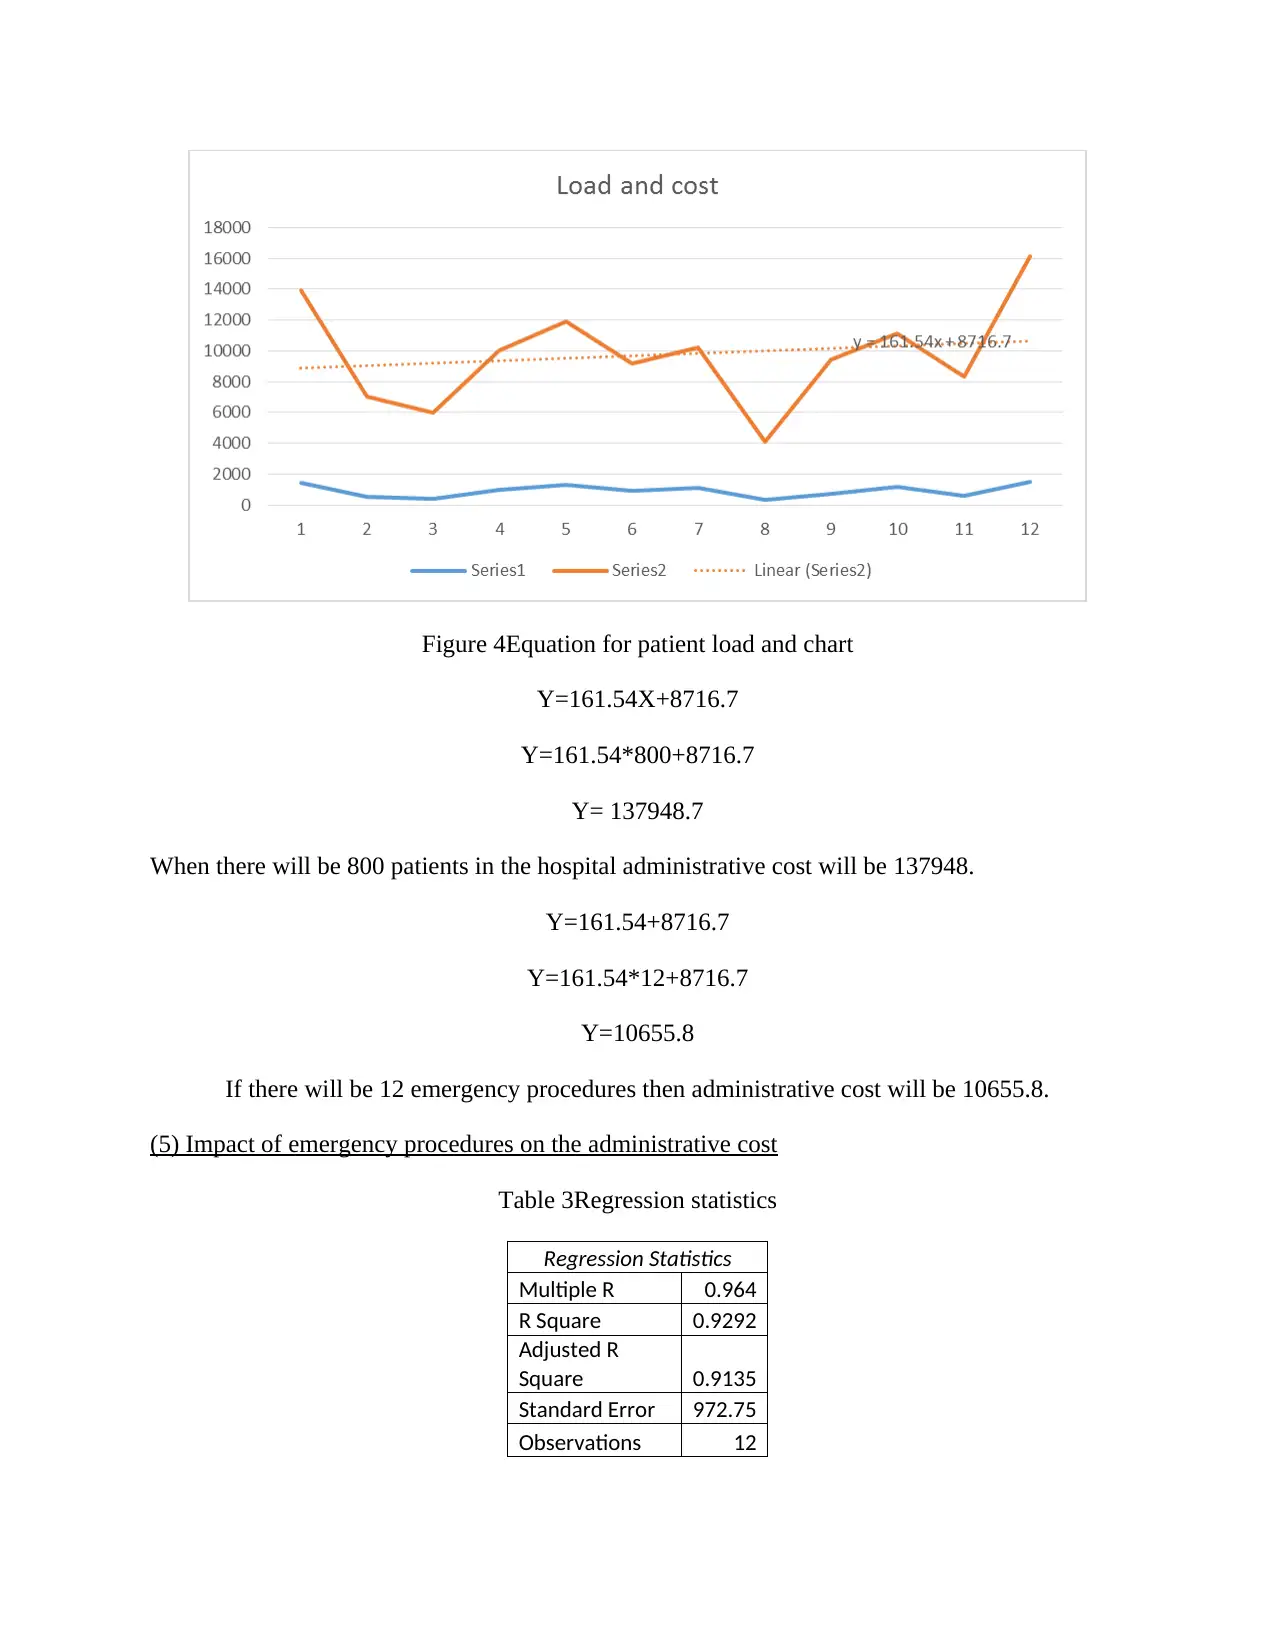
Figure 4Equation for patient load and chart
Y=161.54X+8716.7
Y=161.54*800+8716.7
Y= 137948.7
When there will be 800 patients in the hospital administrative cost will be 137948.
Y=161.54+8716.7
Y=161.54*12+8716.7
Y=10655.8
If there will be 12 emergency procedures then administrative cost will be 10655.8.
(5) Impact of emergency procedures on the administrative cost
Table 3Regression statistics
Regression Statistics
Multiple R 0.964
R Square 0.9292
Adjusted R
Square 0.9135
Standard Error 972.75
Observations 12
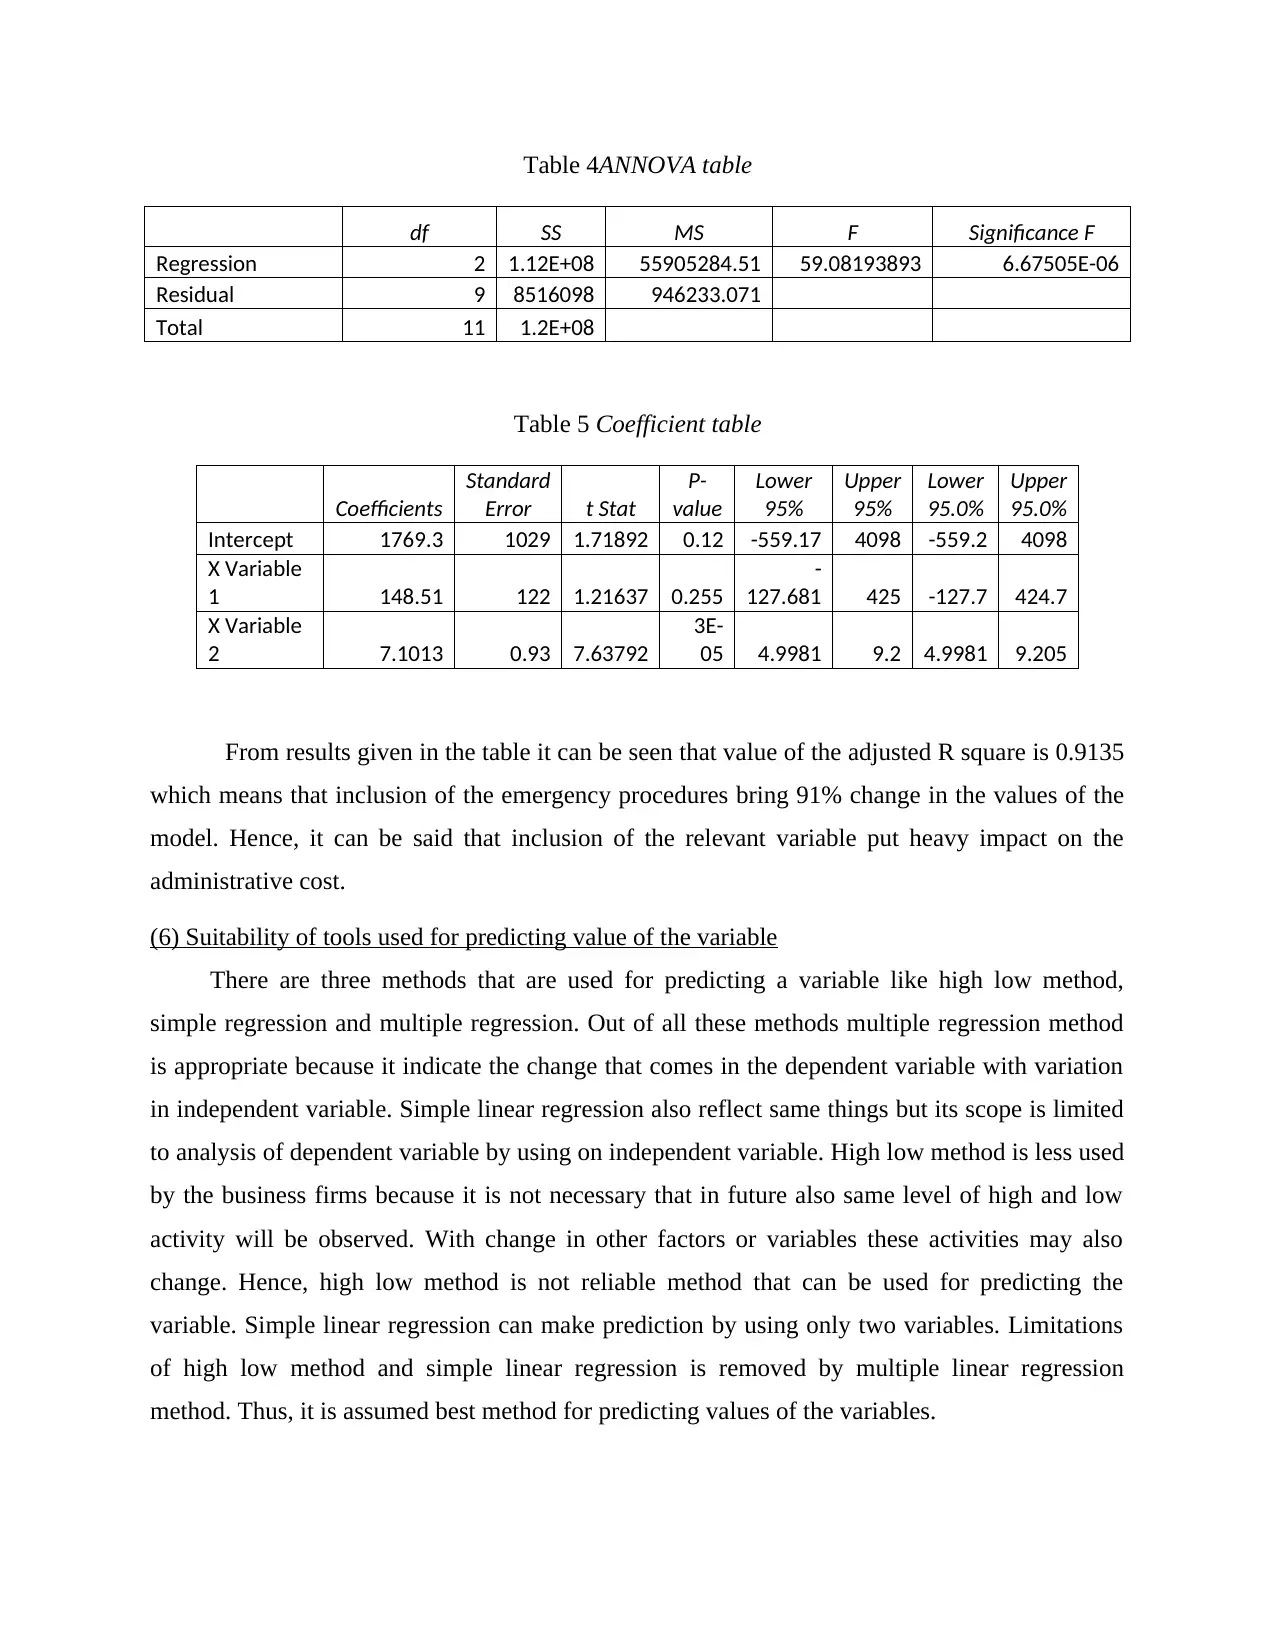
Table 4ANNOVA table
df SS MS F Significance F
Regression 2 1.12E+08 55905284.51 59.08193893 6.67505E-06
Residual 9 8516098 946233.071
Total 11 1.2E+08
Table 5 Coefficient table
Coefficients
Standard
Error t Stat
P-
value
Lower
95%
Upper
95%
Lower
95.0%
Upper
95.0%
Intercept 1769.3 1029 1.71892 0.12 -559.17 4098 -559.2 4098
X Variable
1 148.51 122 1.21637 0.255
-
127.681 425 -127.7 424.7
X Variable
2 7.1013 0.93 7.63792
3E-
05 4.9981 9.2 4.9981 9.205
From results given in the table it can be seen that value of the adjusted R square is 0.9135
which means that inclusion of the emergency procedures bring 91% change in the values of the
model. Hence, it can be said that inclusion of the relevant variable put heavy impact on the
administrative cost.
(6) Suitability of tools used for predicting value of the variable
There are three methods that are used for predicting a variable like high low method,
simple regression and multiple regression. Out of all these methods multiple regression method
is appropriate because it indicate the change that comes in the dependent variable with variation
in independent variable. Simple linear regression also reflect same things but its scope is limited
to analysis of dependent variable by using on independent variable. High low method is less used
by the business firms because it is not necessary that in future also same level of high and low
activity will be observed. With change in other factors or variables these activities may also
change. Hence, high low method is not reliable method that can be used for predicting the
variable. Simple linear regression can make prediction by using only two variables. Limitations
of high low method and simple linear regression is removed by multiple linear regression
method. Thus, it is assumed best method for predicting values of the variables.
⊘ This is a preview!⊘
Do you want full access?
Subscribe today to unlock all pages.
Trusted by 1+ million students worldwide
QUESTION 2
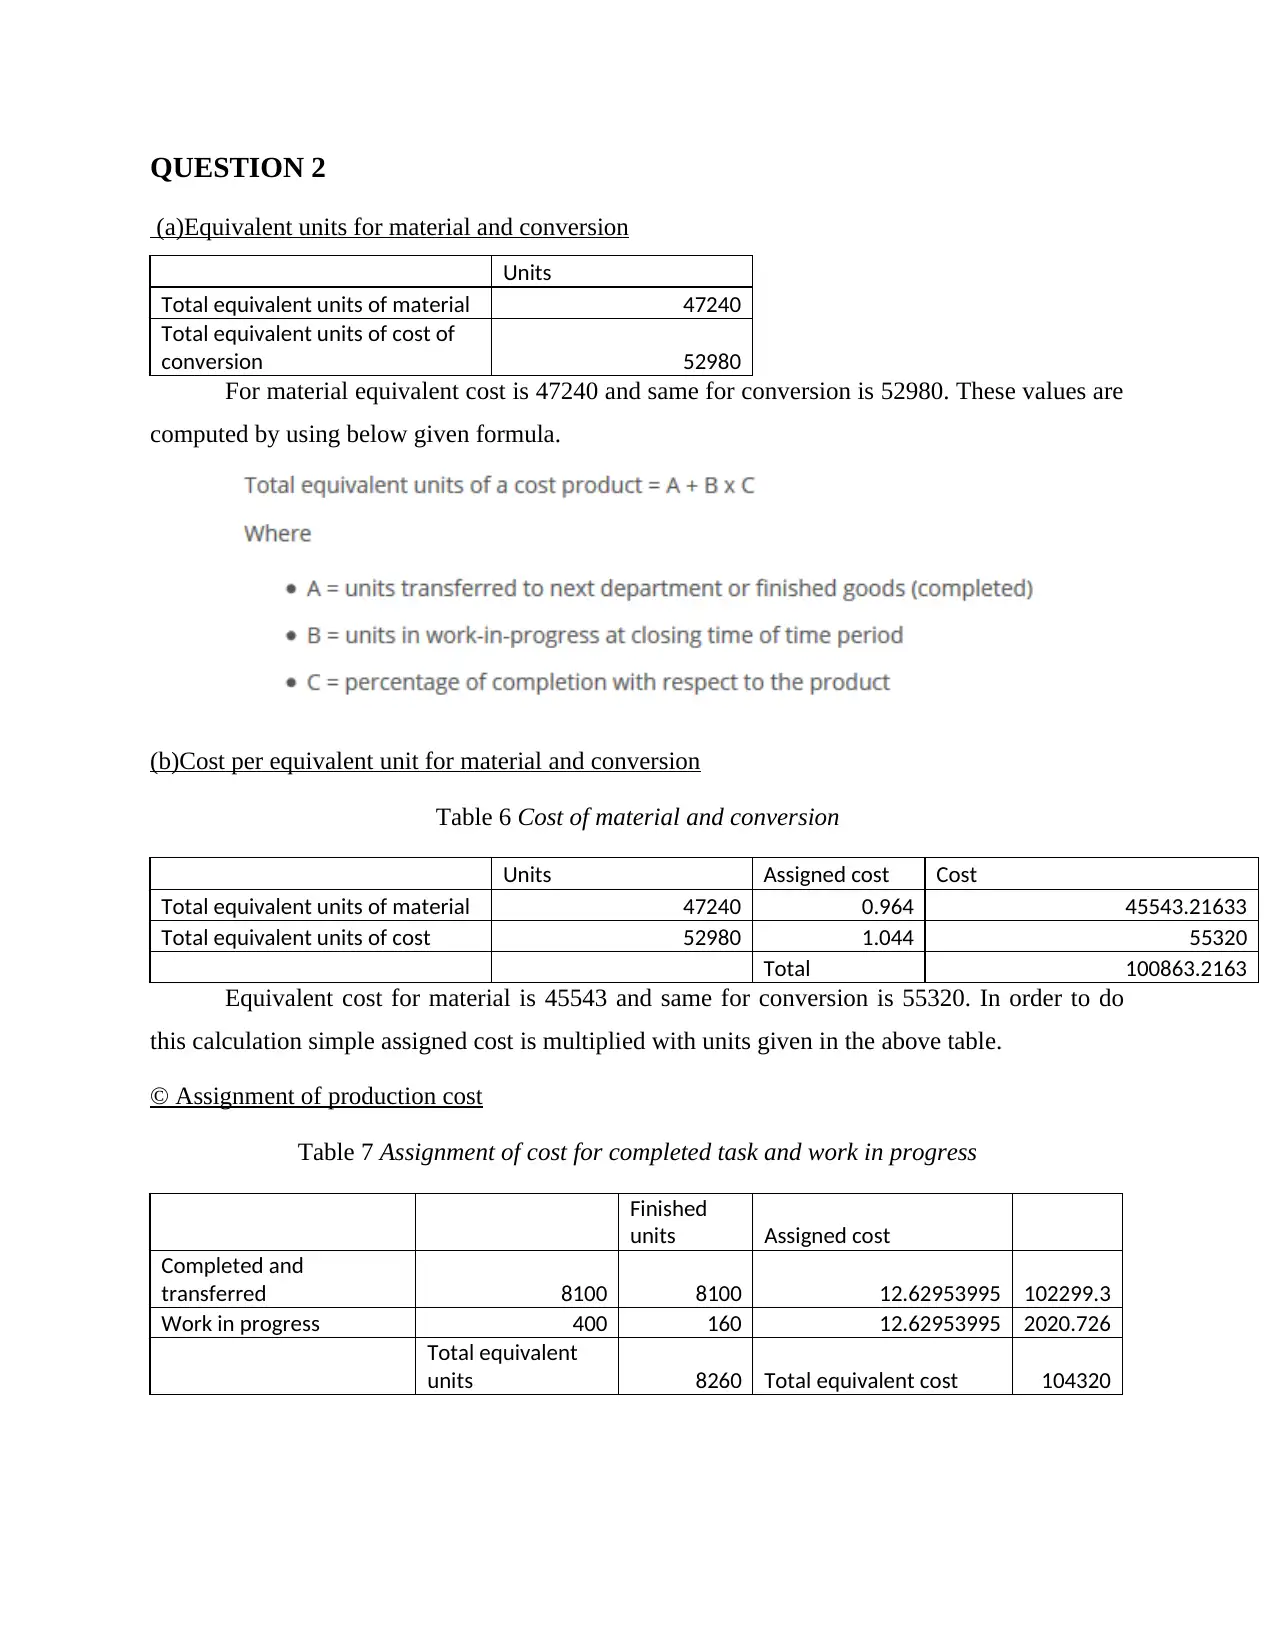
(a)Equivalent units for material and conversion
Units
Total equivalent units of material 47240
Total equivalent units of cost of
conversion 52980
For material equivalent cost is 47240 and same for conversion is 52980. These values are
computed by using below given formula.
(b)Cost per equivalent unit for material and conversion
Table 6 Cost of material and conversion
Units Assigned cost Cost
Total equivalent units of material 47240 0.964 45543.21633
Total equivalent units of cost 52980 1.044 55320
Total 100863.2163
Equivalent cost for material is 45543 and same for conversion is 55320. In order to do
this calculation simple assigned cost is multiplied with units given in the above table.
© Assignment of production cost
Table 7 Assignment of cost for completed task and work in progress
Finished
units Assigned cost
Completed and
transferred 8100 8100 12.62953995 102299.3
Work in progress 400 160 12.62953995 2020.726
Total equivalent
units 8260 Total equivalent cost 104320
Paraphrase This Document
Need a fresh take? Get an instant paraphrase of this document with our AI Paraphraser
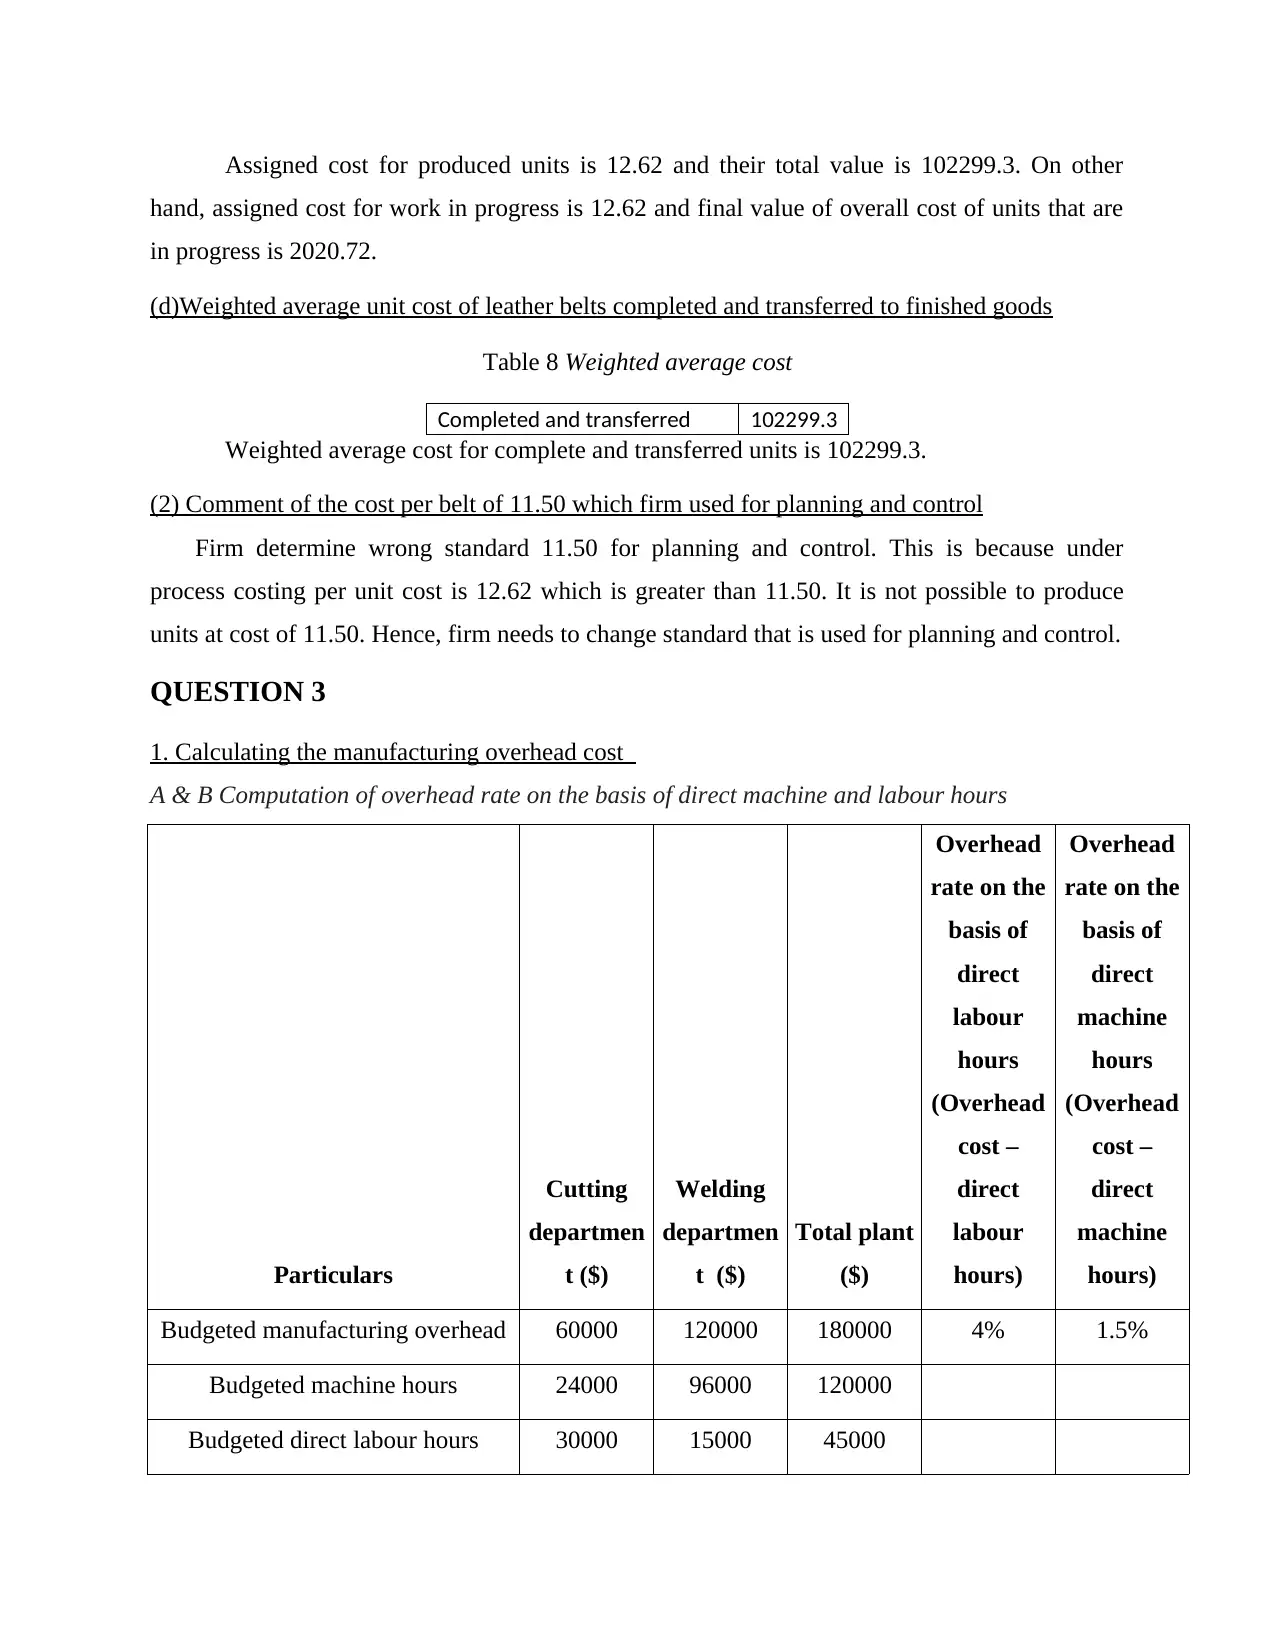
Assigned cost for produced units is 12.62 and their total value is 102299.3. On other
hand, assigned cost for work in progress is 12.62 and final value of overall cost of units that are
in progress is 2020.72.
(d)Weighted average unit cost of leather belts completed and transferred to finished goods
Table 8 Weighted average cost
Completed and transferred 102299.3
Weighted average cost for complete and transferred units is 102299.3.
(2) Comment of the cost per belt of 11.50 which firm used for planning and control
Firm determine wrong standard 11.50 for planning and control. This is because under
process costing per unit cost is 12.62 which is greater than 11.50. It is not possible to produce
units at cost of 11.50. Hence, firm needs to change standard that is used for planning and control.
QUESTION 3
1. Calculating the manufacturing overhead cost
A & B Computation of overhead rate on the basis of direct machine and labour hours
Particulars
Cutting
departmen
t ($)
Welding
departmen
t ($)
Total plant
($)
Overhead
rate on the
basis of
direct
labour
hours
(Overhead
cost –
direct
labour
hours)
Overhead
rate on the
basis of
direct
machine
hours
(Overhead
cost –
direct
machine
hours)
Budgeted manufacturing overhead 60000 120000 180000 4% 1.5%
Budgeted machine hours 24000 96000 120000
Budgeted direct labour hours 30000 15000 45000
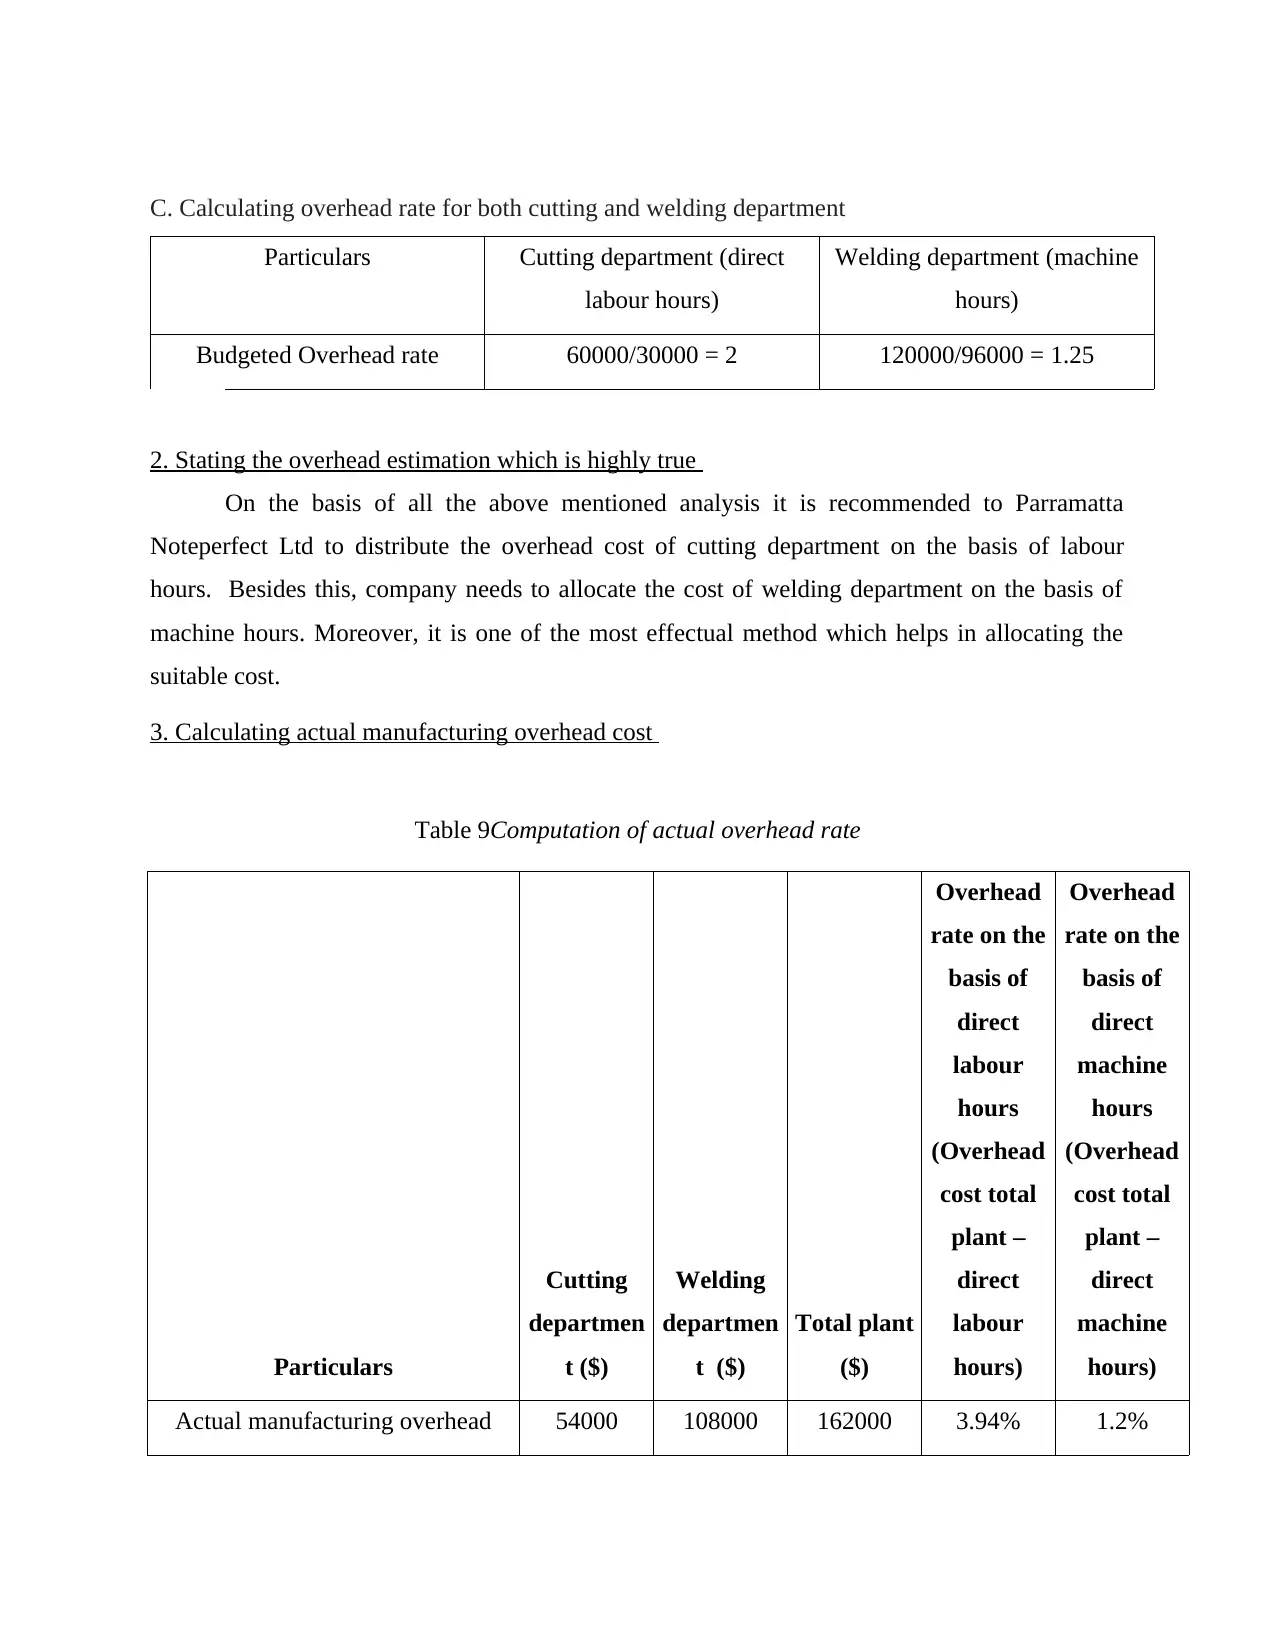
C. Calculating overhead rate for both cutting and welding department
Particulars Cutting department (direct
labour hours)
Welding department (machine
hours)
Budgeted Overhead rate 60000/30000 = 2 120000/96000 = 1.25
2. Stating the overhead estimation which is highly true
On the basis of all the above mentioned analysis it is recommended to Parramatta
Noteperfect Ltd to distribute the overhead cost of cutting department on the basis of labour
hours. Besides this, company needs to allocate the cost of welding department on the basis of
machine hours. Moreover, it is one of the most effectual method which helps in allocating the
suitable cost.
3. Calculating actual manufacturing overhead cost
Table 9Computation of actual overhead rate
Particulars
Cutting
departmen
t ($)
Welding
departmen
t ($)
Total plant
($)
Overhead
rate on the
basis of
direct
labour
hours
(Overhead
cost total
plant –
direct
labour
hours)
Overhead
rate on the
basis of
direct
machine
hours
(Overhead
cost total
plant –
direct
machine
hours)
Actual manufacturing overhead 54000 108000 162000 3.94% 1.2%
⊘ This is a preview!⊘
Do you want full access?
Subscribe today to unlock all pages.
Trusted by 1+ million students worldwide
1 out of 21
Related Documents


Your All-in-One AI-Powered Toolkit for Academic Success.
+13062052269
info@desklib.com
Available 24*7 on WhatsApp / Email
![[object Object]](/_next/static/media/star-bottom.7253800d.svg)
Unlock your academic potential
Copyright © 2020–2026 A2Z Services. All Rights Reserved. Developed and managed by ZUCOL.