Management Accounting Report: Costing, Profitability, and Budgeting
VerifiedAdded on 2023/06/18
|20
|3843
|277
Report
AI Summary
This management accounting report provides a detailed analysis of costing methods, break-even points, and variance analysis. It includes solutions to questions related to Plaistead Plc and Crawford Plc, covering topics such as contribution per unit, break-even sales revenue, margin of safety, profit estimation, and pricing strategies. The report also explores cost allocation methods for different departments, overhead recovery rates, and full job cost calculations. Additionally, it discusses the advantages and disadvantages of absorption costing and provides estimations of budgets and variances for Jayrod Plc. This comprehensive report offers valuable insights into management accounting principles and their practical applications.
Introduction to
management accounting
management accounting
Paraphrase This Document
Need a fresh take? Get an instant paraphrase of this document with our AI Paraphraser
Contents
Contents................................................................................................................................................2
Part 1.....................................................................................................................................................3
Question 2: Plaistead Plc..................................................................................................................3
Part 2.....................................................................................................................................................8
Question 3: Crawford Plc.................................................................................................................8
Part 3.....................................................................................................................................................3
Question 4:........................................................................................................................................3
REFERENCES...................................................................................................................................10
Part 1
Question 2: Plaistead Plc.
Answer to (a)
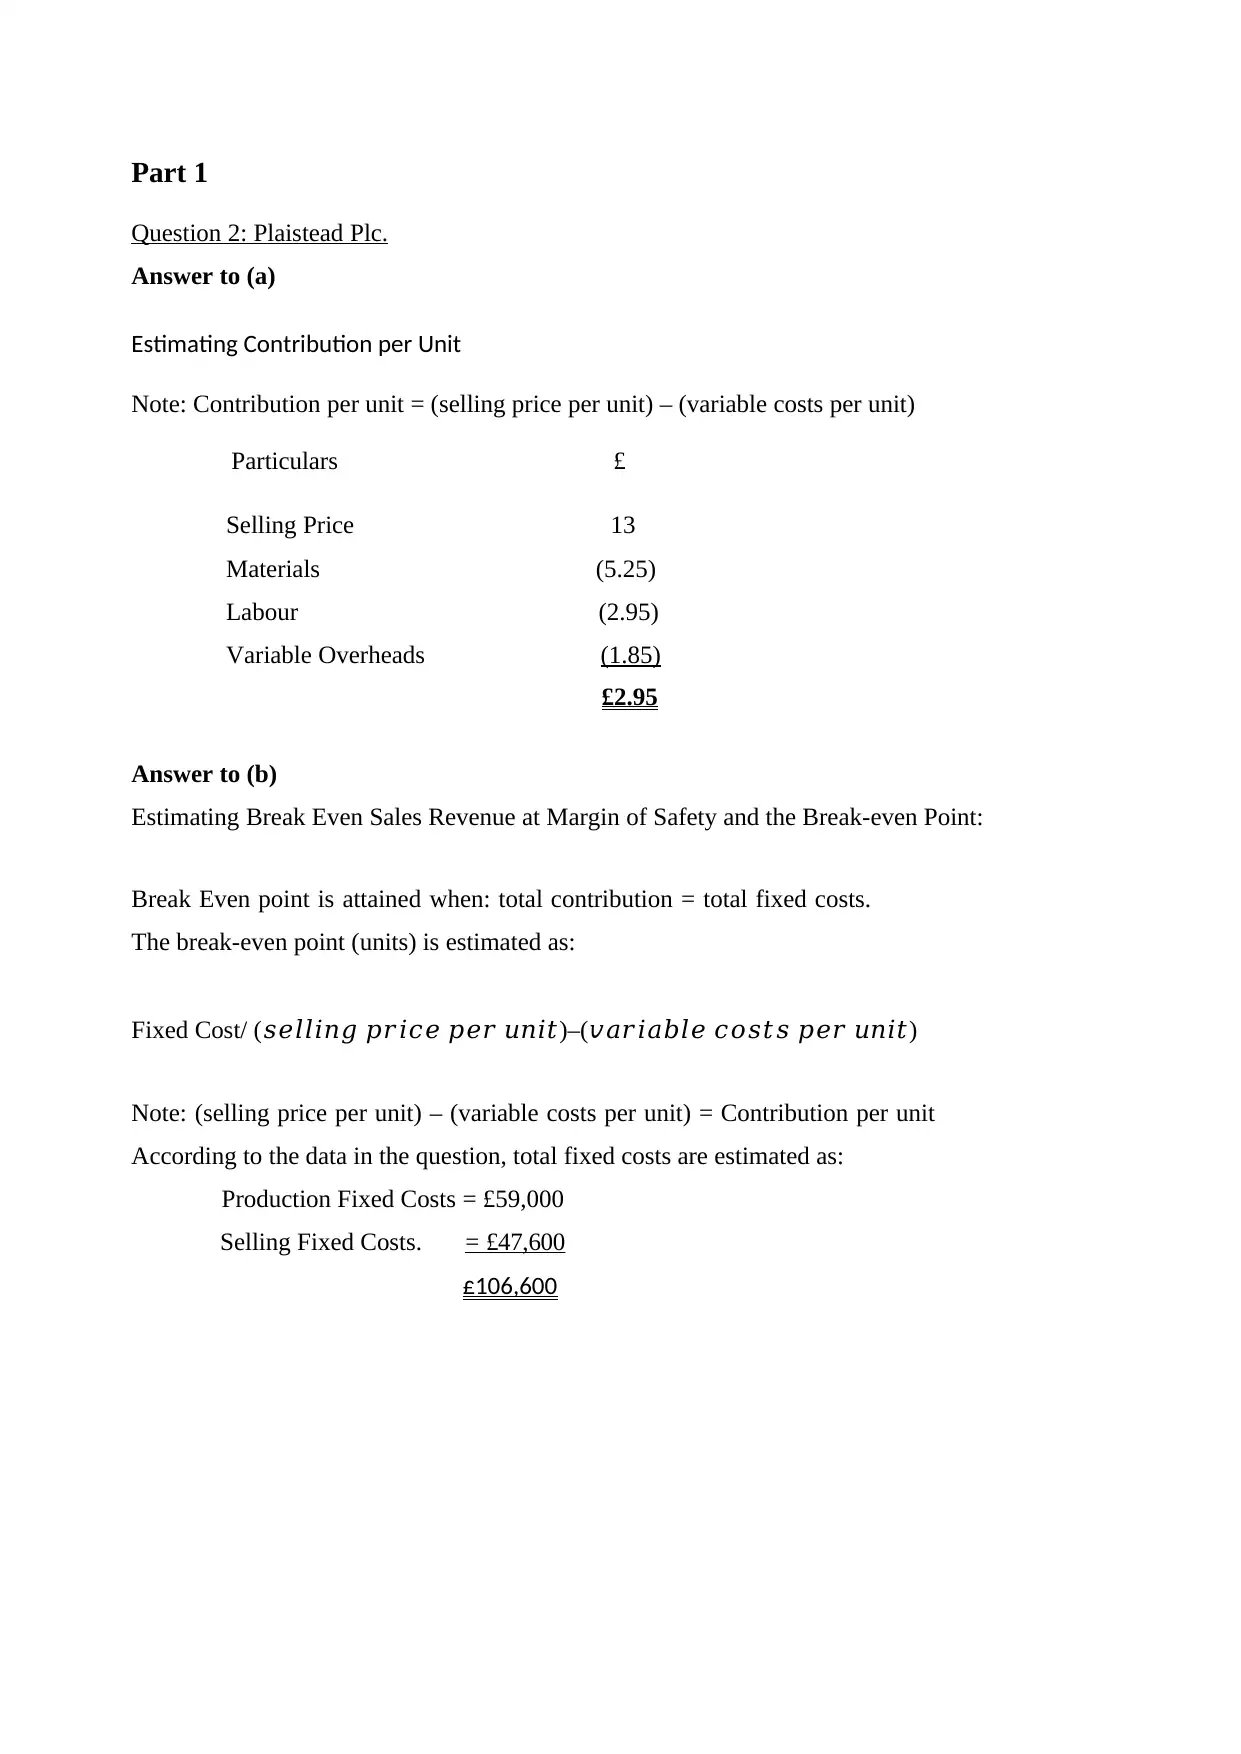
Estimating Contribution per Unit
Note: Contribution per unit = (selling price per unit) – (variable costs per unit)
Particulars £
Selling Price 13
Materials (5.25)
Labour (2.95)
Variable Overheads (1.85)
£2.95
Answer to (b)
Estimating Break Even Sales Revenue at Margin of Safety and the Break-even Point:
Break Even point is attained when: total contribution = total fixed costs.
The break-even point (units) is estimated as:
Fixed Cost/ (𝑠𝑒𝑙𝑙𝑖𝑛𝑔 𝑝𝑟𝑖𝑐𝑒 𝑝𝑒𝑟 𝑢𝑛𝑖𝑡)–(𝑣𝑎𝑟𝑖𝑎𝑏𝑙𝑒 𝑐𝑜𝑠𝑡𝑠 𝑝𝑒𝑟 𝑢𝑛𝑖𝑡)
Note: (selling price per unit) – (variable costs per unit) = Contribution per unit
According to the data in the question, total fixed costs are estimated as:
Production Fixed Costs = £59,000
Selling Fixed Costs. = £47,600
£106,600
Question 2: Plaistead Plc.
Answer to (a)
Estimating Contribution per Unit
Note: Contribution per unit = (selling price per unit) – (variable costs per unit)
Particulars £
Selling Price 13
Materials (5.25)
Labour (2.95)
Variable Overheads (1.85)
£2.95
Answer to (b)
Estimating Break Even Sales Revenue at Margin of Safety and the Break-even Point:
Break Even point is attained when: total contribution = total fixed costs.
The break-even point (units) is estimated as:
Fixed Cost/ (𝑠𝑒𝑙𝑙𝑖𝑛𝑔 𝑝𝑟𝑖𝑐𝑒 𝑝𝑒𝑟 𝑢𝑛𝑖𝑡)–(𝑣𝑎𝑟𝑖𝑎𝑏𝑙𝑒 𝑐𝑜𝑠𝑡𝑠 𝑝𝑒𝑟 𝑢𝑛𝑖𝑡)
Note: (selling price per unit) – (variable costs per unit) = Contribution per unit
According to the data in the question, total fixed costs are estimated as:
Production Fixed Costs = £59,000
Selling Fixed Costs. = £47,600
£106,600
⊘ This is a preview!⊘
Do you want full access?
Subscribe today to unlock all pages.
Trusted by 1+ million students worldwide
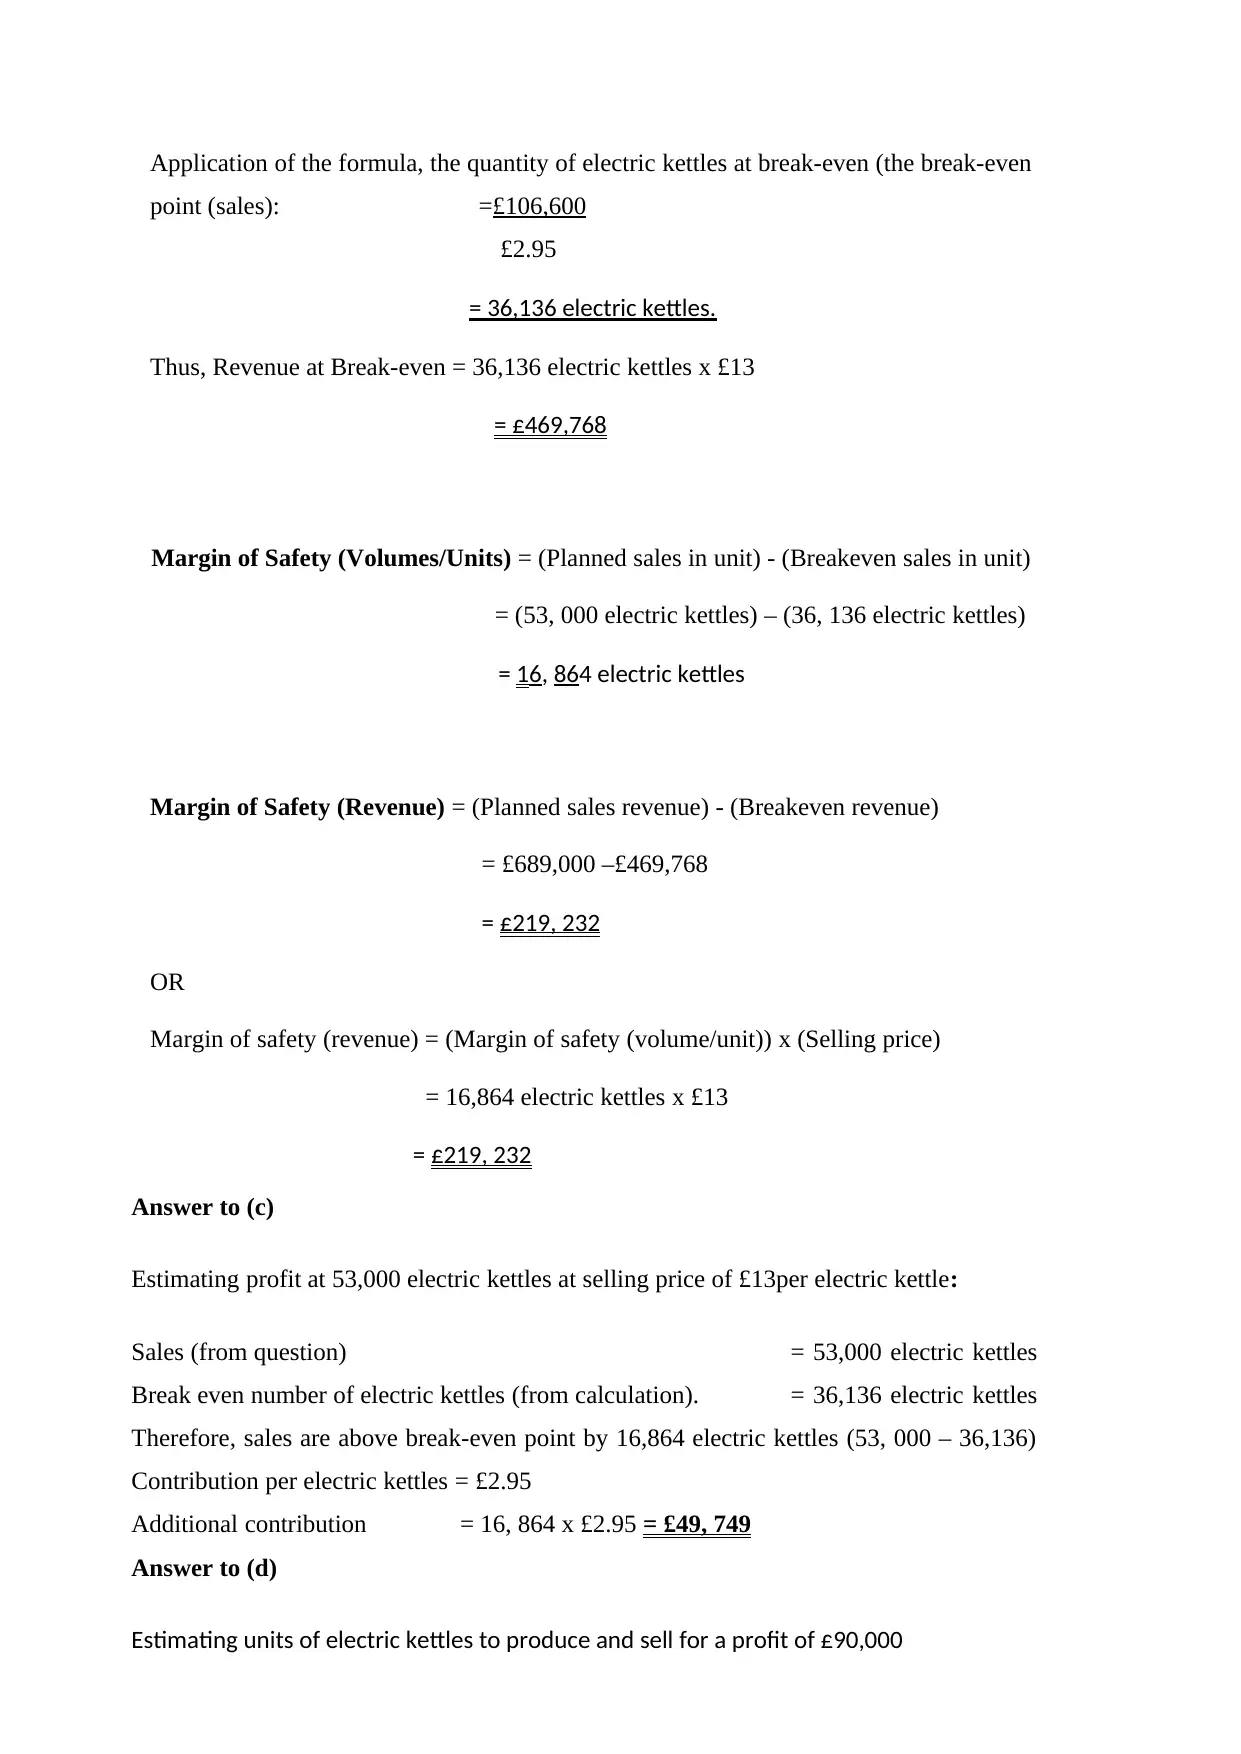
Application of the formula, the quantity of electric kettles at break-even (the break-even
point (sales): =£106,600
£2.95
= 36,136 electric kettles.
Thus, Revenue at Break-even = 36,136 electric kettles x £13
= £469,768
Margin of Safety (Volumes/Units) = (Planned sales in unit) - (Breakeven sales in unit)
= (53, 000 electric kettles) – (36, 136 electric kettles)
= 16, 864 electric kettles
Margin of Safety (Revenue) = (Planned sales revenue) - (Breakeven revenue)
= £689,000 –£469,768
= £219, 232
OR
Margin of safety (revenue) = (Margin of safety (volume/unit)) x (Selling price)
= 16,864 electric kettles x £13
= £219, 232
Answer to (c)
Estimating profit at 53,000 electric kettles at selling price of £13per electric kettle:
Sales (from question) = 53,000 electric kettles
Break even number of electric kettles (from calculation). = 36,136 electric kettles
Therefore, sales are above break-even point by 16,864 electric kettles (53, 000 – 36,136)
Contribution per electric kettles = £2.95
Additional contribution = 16, 864 x £2.95 = £49, 749
Answer to (d)
Estimating units of electric kettles to produce and sell for a profit of £90,000
Paraphrase This Document
Need a fresh take? Get an instant paraphrase of this document with our AI Paraphraser
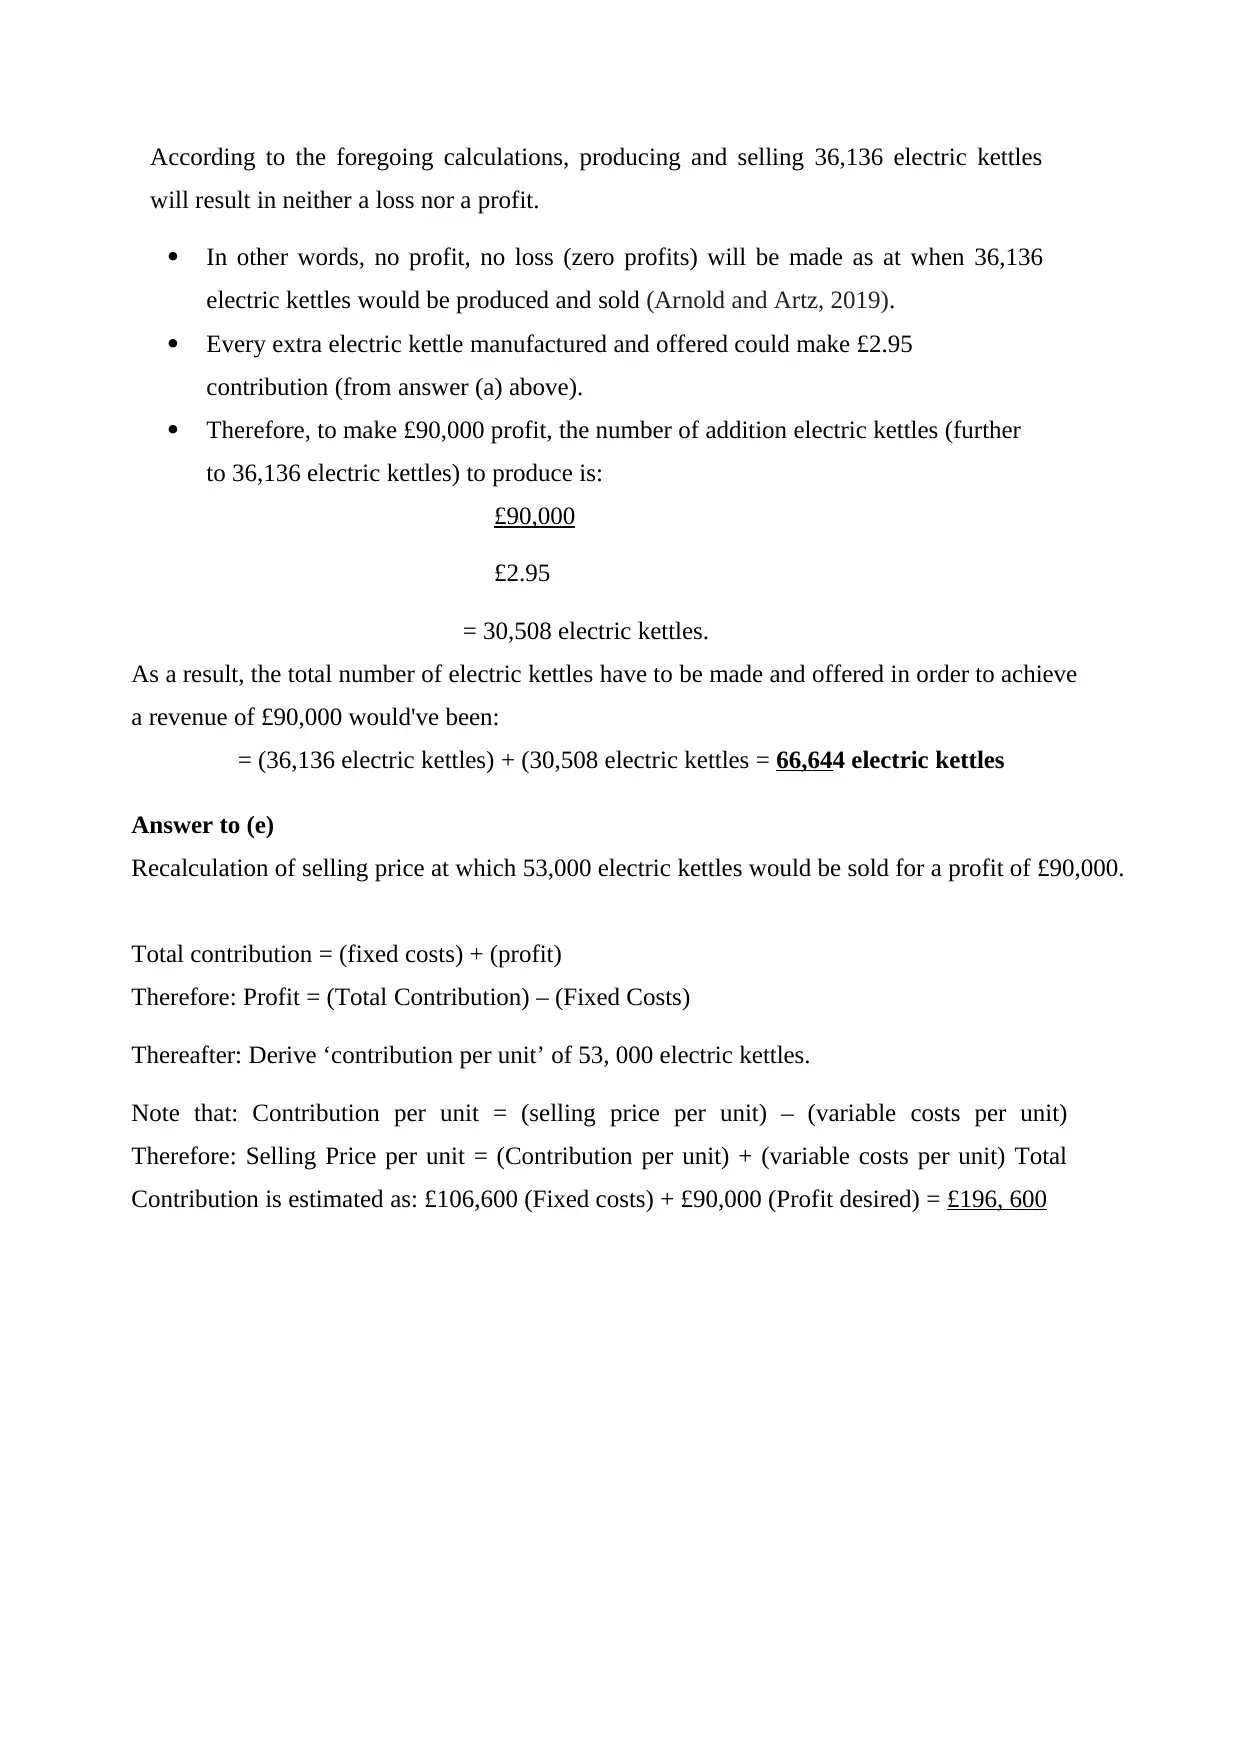
According to the foregoing calculations, producing and selling 36,136 electric kettles
will result in neither a loss nor a profit.
In other words, no profit, no loss (zero profits) will be made as at when 36,136
electric kettles would be produced and sold (Arnold and Artz, 2019).
Every extra electric kettle manufactured and offered could make £2.95
contribution (from answer (a) above).
Therefore, to make £90,000 profit, the number of addition electric kettles (further
to 36,136 electric kettles) to produce is:
£90,000
£2.95
= 30,508 electric kettles.
As a result, the total number of electric kettles have to be made and offered in order to achieve
a revenue of £90,000 would've been:
= (36,136 electric kettles) + (30,508 electric kettles = 66,644 electric kettles
Answer to (e)
Recalculation of selling price at which 53,000 electric kettles would be sold for a profit of £90,000.
Total contribution = (fixed costs) + (profit)
Therefore: Profit = (Total Contribution) – (Fixed Costs)
Thereafter: Derive ‘contribution per unit’ of 53, 000 electric kettles.
Note that: Contribution per unit = (selling price per unit) – (variable costs per unit)
Therefore: Selling Price per unit = (Contribution per unit) + (variable costs per unit) Total
Contribution is estimated as: £106,600 (Fixed costs) + £90,000 (Profit desired) = £196, 600
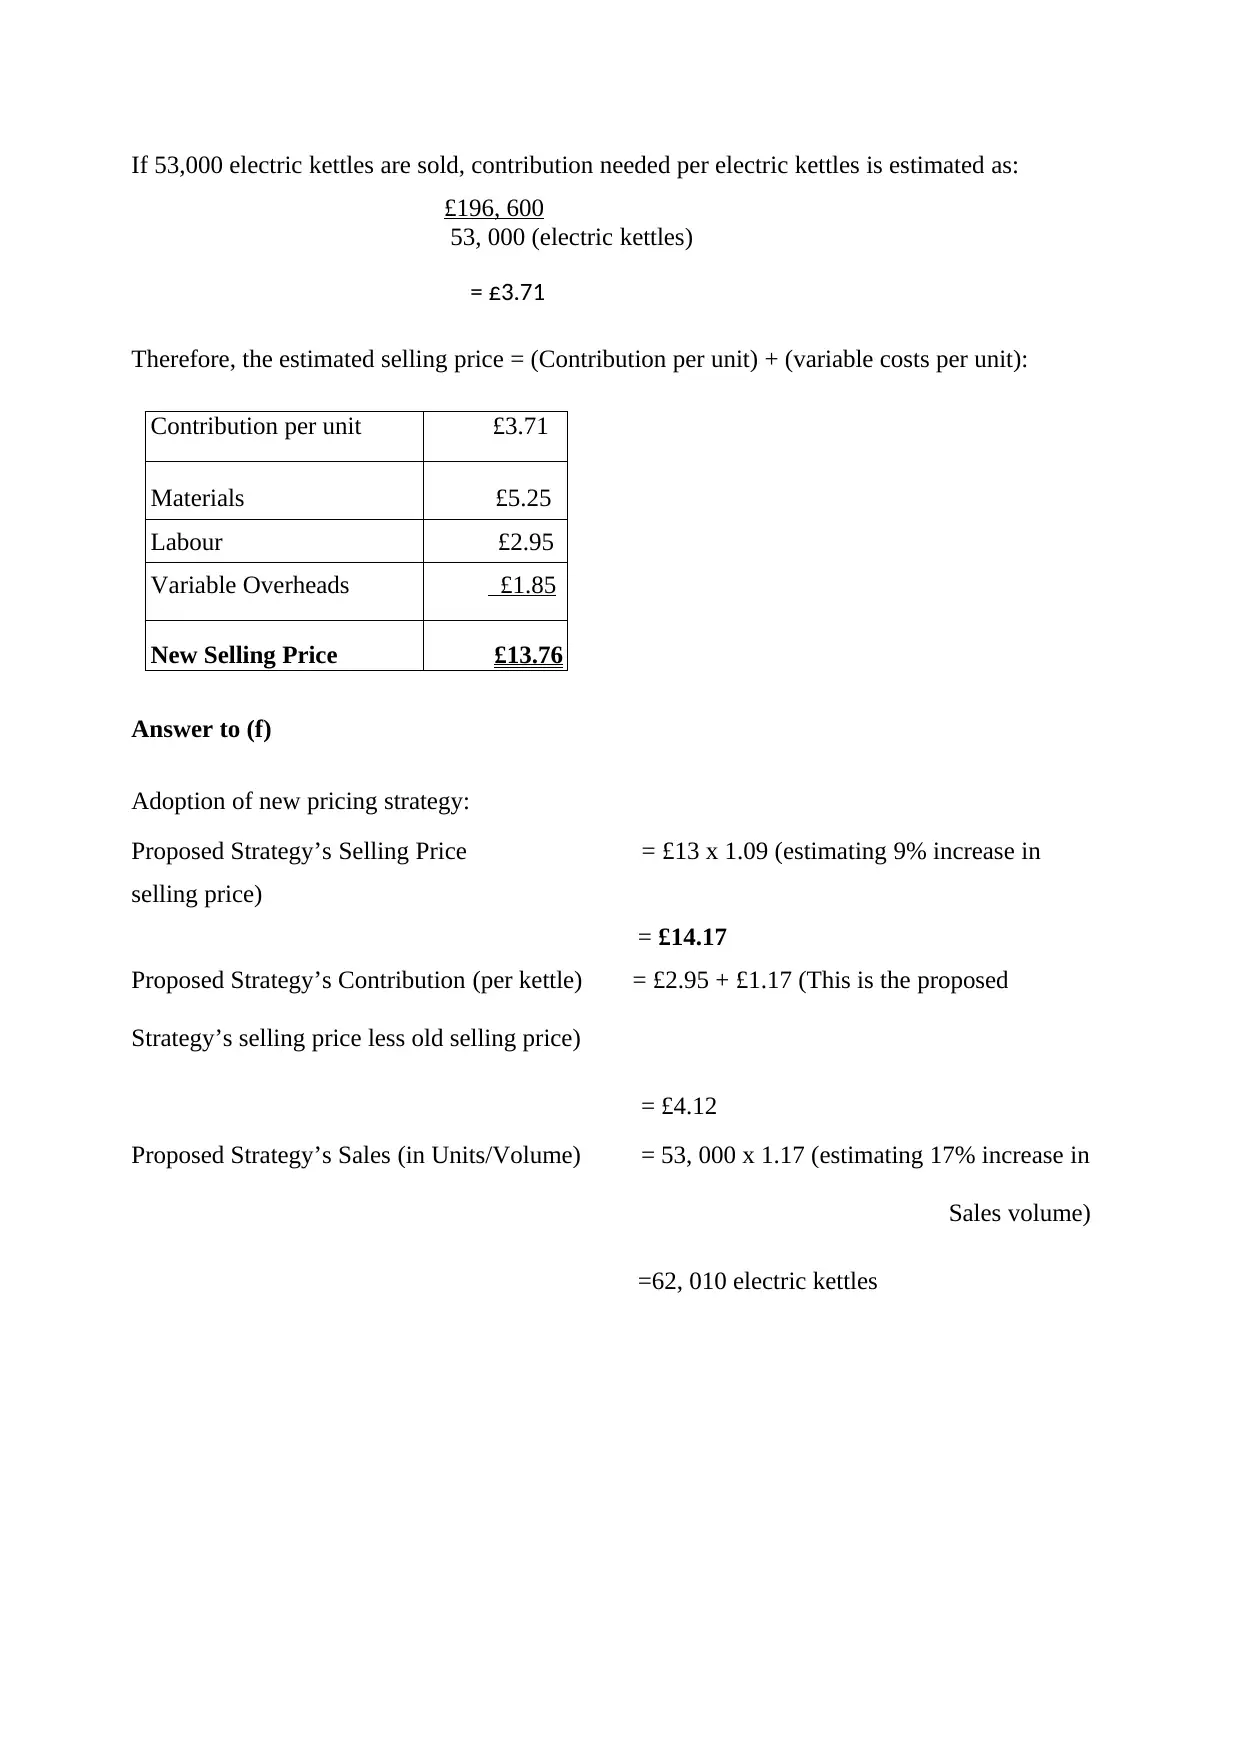
If 53,000 electric kettles are sold, contribution needed per electric kettles is estimated as:
£196, 600
53, 000 (electric kettles)
= £3.71
Therefore, the estimated selling price = (Contribution per unit) + (variable costs per unit):
Contribution per unit £3.71
Materials £5.25
Labour £2.95
Variable Overheads £1.85
New Selling Price £13.76
Answer to (f)
Adoption of new pricing strategy:
Proposed Strategy’s Selling Price = £13 x 1.09 (estimating 9% increase in
selling price)
= £14.17
Proposed Strategy’s Contribution (per kettle) = £2.95 + £1.17 (This is the proposed
Strategy’s selling price less old selling price)
= £4.12
Proposed Strategy’s Sales (in Units/Volume) = 53, 000 x 1.17 (estimating 17% increase in
Sales volume)
=62, 010 electric kettles
⊘ This is a preview!⊘
Do you want full access?
Subscribe today to unlock all pages.
Trusted by 1+ million students worldwide
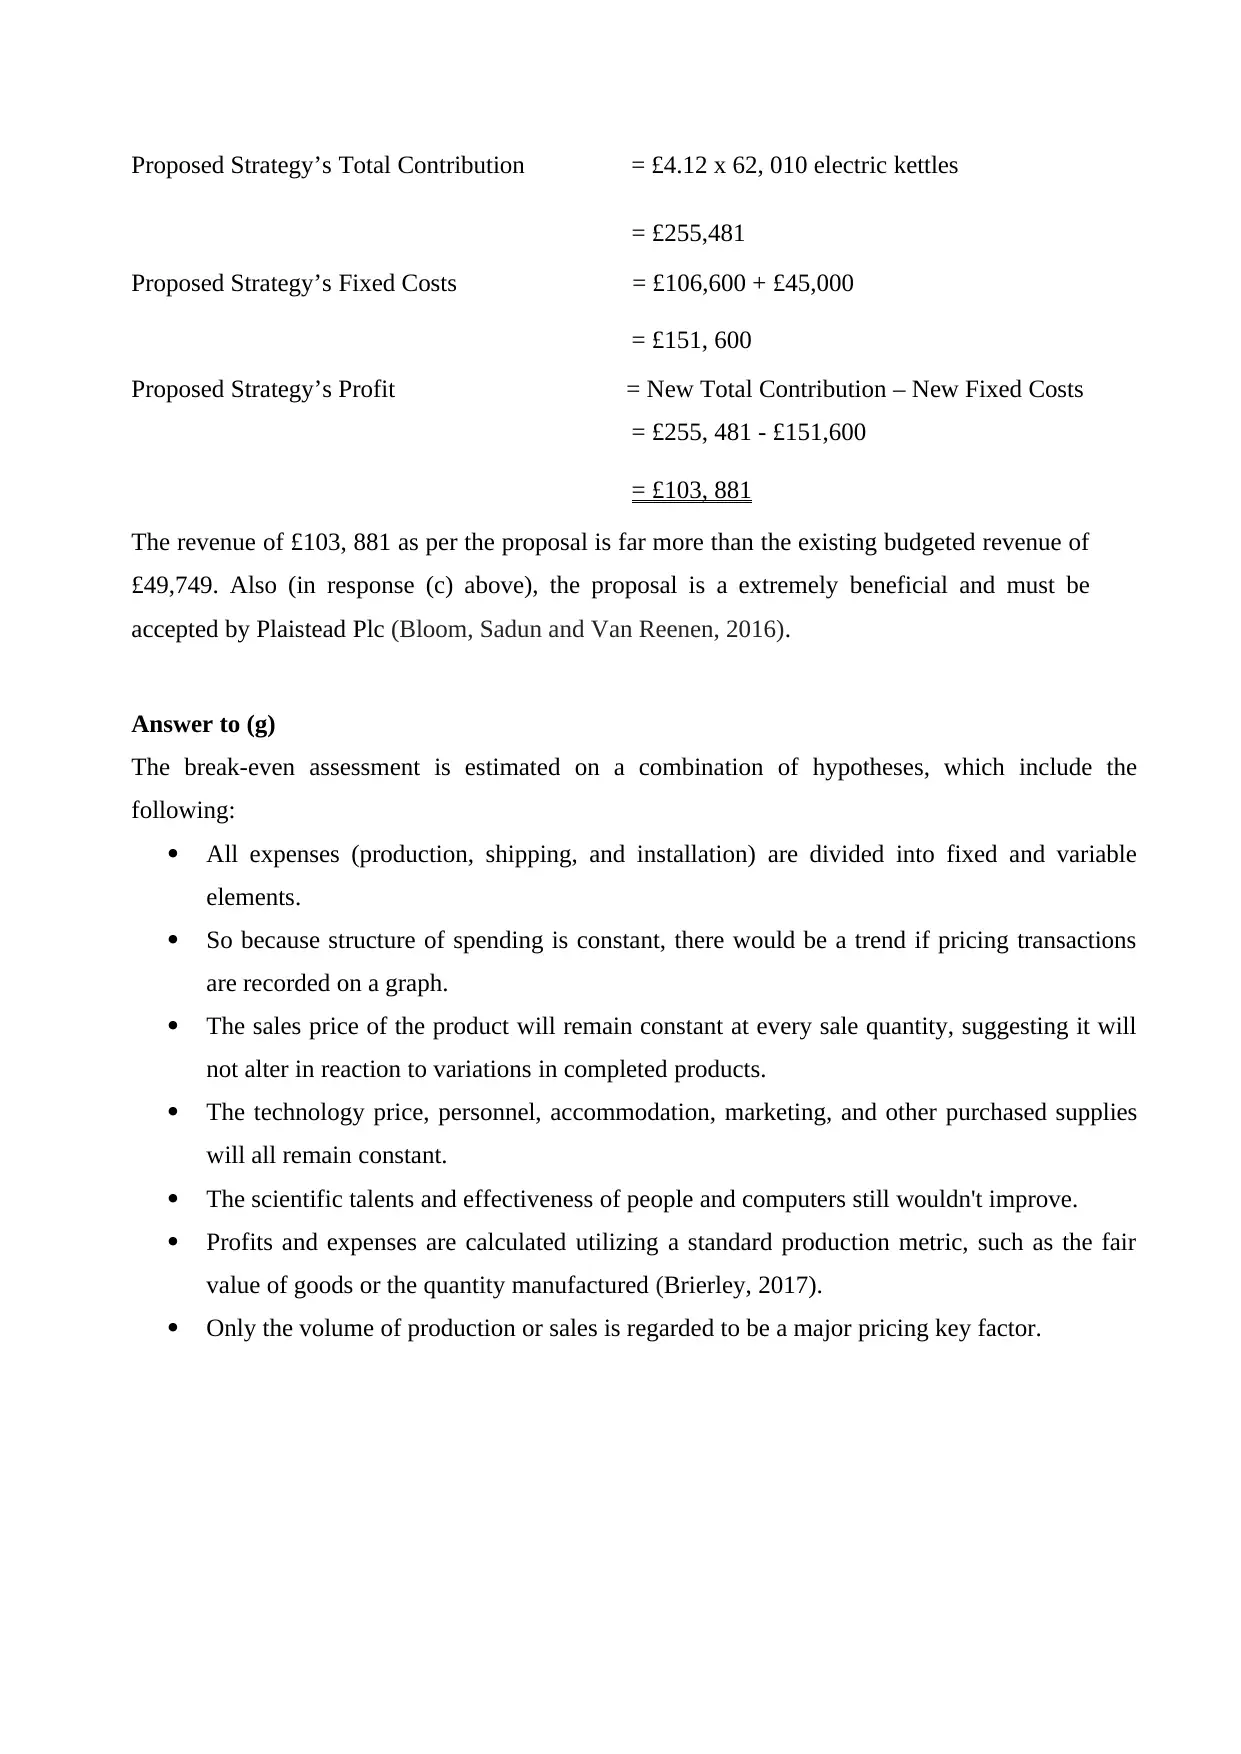
Proposed Strategy’s Total Contribution = £4.12 x 62, 010 electric kettles
= £255,481
Proposed Strategy’s Fixed Costs = £106,600 + £45,000
= £151, 600
Proposed Strategy’s Profit = New Total Contribution – New Fixed Costs
= £255, 481 - £151,600
= £103, 881
The revenue of £103, 881 as per the proposal is far more than the existing budgeted revenue of
£49,749. Also (in response (c) above), the proposal is a extremely beneficial and must be
accepted by Plaistead Plc (Bloom, Sadun and Van Reenen, 2016).
Answer to (g)
The break-even assessment is estimated on a combination of hypotheses, which include the
following:
All expenses (production, shipping, and installation) are divided into fixed and variable
elements.
So because structure of spending is constant, there would be a trend if pricing transactions
are recorded on a graph.
The sales price of the product will remain constant at every sale quantity, suggesting it will
not alter in reaction to variations in completed products.
The technology price, personnel, accommodation, marketing, and other purchased supplies
will all remain constant.
The scientific talents and effectiveness of people and computers still wouldn't improve.
Profits and expenses are calculated utilizing a standard production metric, such as the fair
value of goods or the quantity manufactured (Brierley, 2017).
Only the volume of production or sales is regarded to be a major pricing key factor.
Paraphrase This Document
Need a fresh take? Get an instant paraphrase of this document with our AI Paraphraser
Part 2
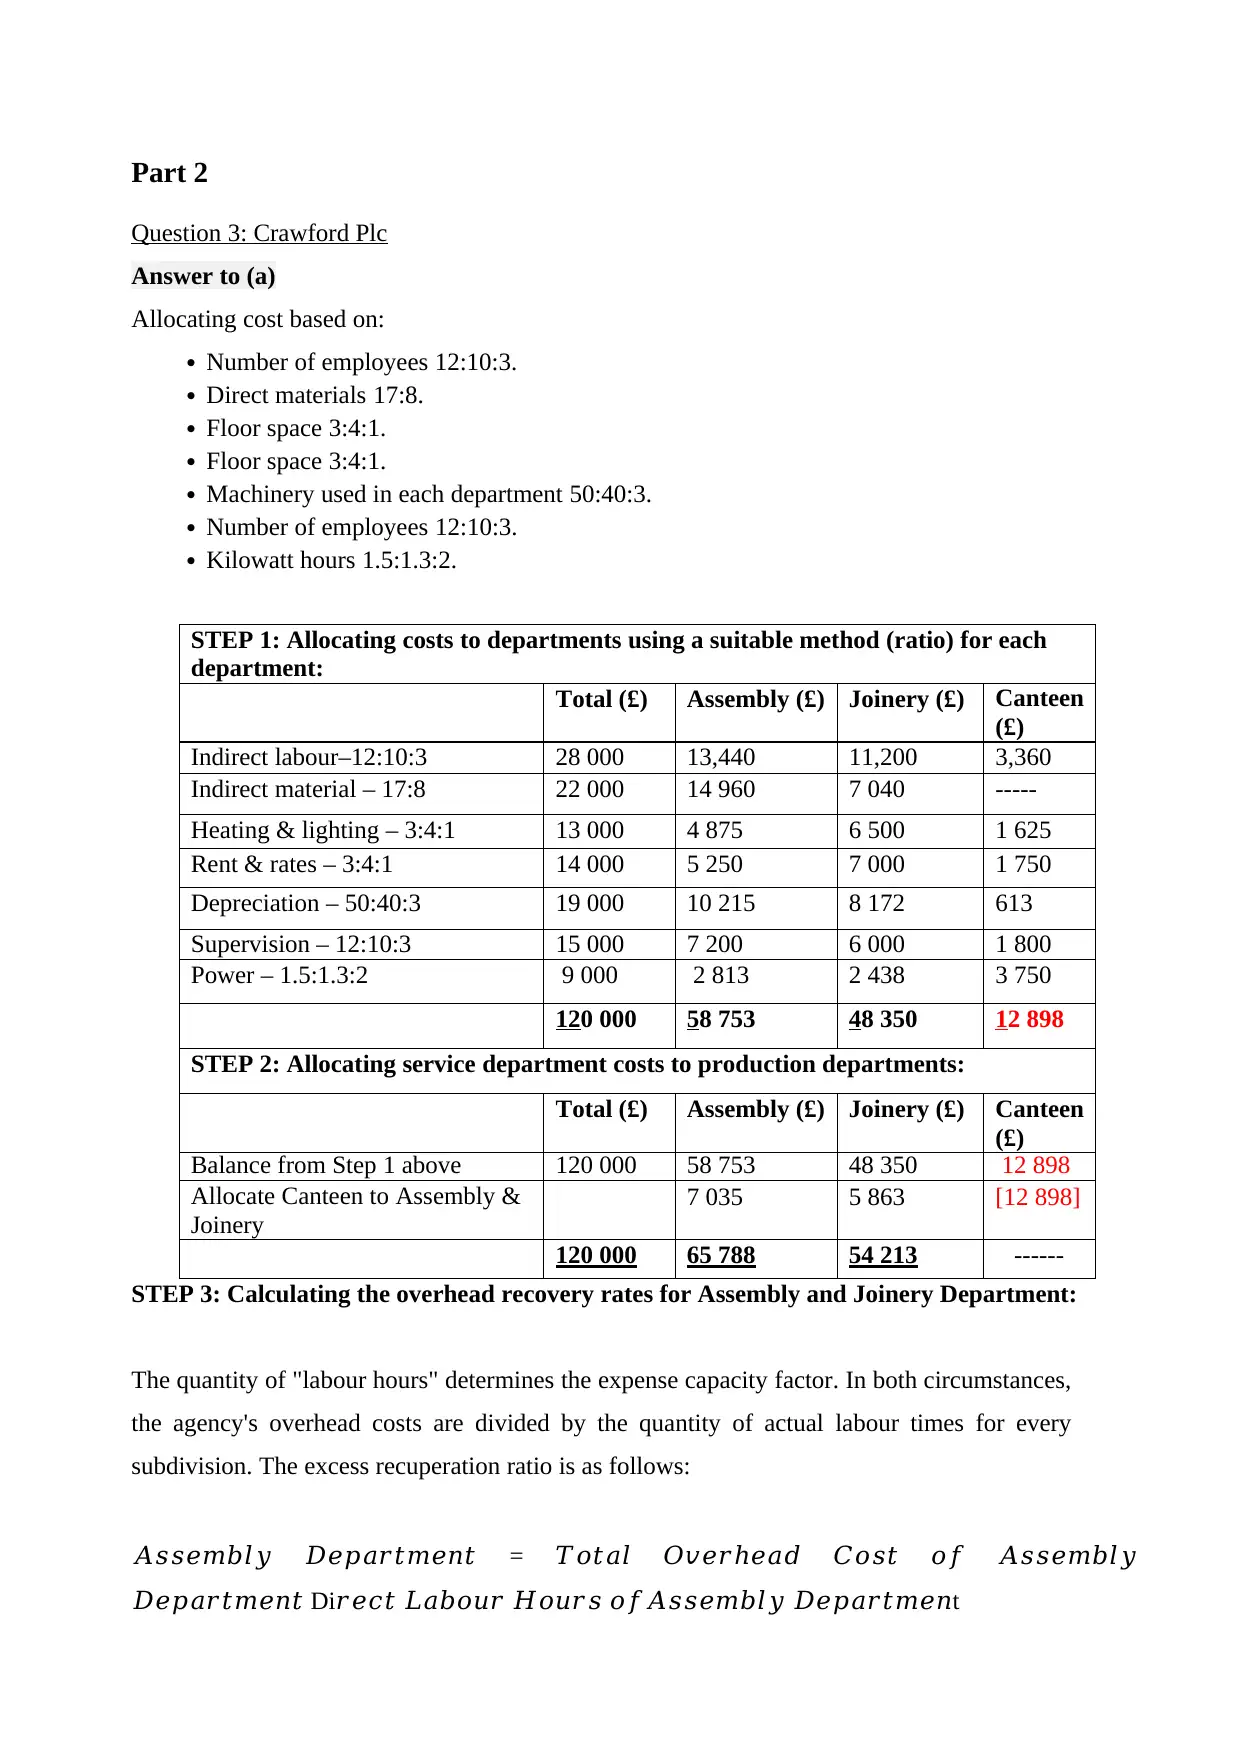
Question 3: Crawford Plc
Answer to (a)
Allocating cost based on:
Number of employees 12:10:3.
Direct materials 17:8.
Floor space 3:4:1.
Floor space 3:4:1.
Machinery used in each department 50:40:3.
Number of employees 12:10:3.
Kilowatt hours 1.5:1.3:2.
STEP 1: Allocating costs to departments using a suitable method (ratio) for each
department:
Total (£) Assembly (£) Joinery (£) Canteen
(£)
Indirect labour–12:10:3 28 000 13,440 11,200 3,360
Indirect material – 17:8 22 000 14 960 7 040 -----
Heating & lighting – 3:4:1 13 000 4 875 6 500 1 625
Rent & rates – 3:4:1 14 000 5 250 7 000 1 750
Depreciation – 50:40:3 19 000 10 215 8 172 613
Supervision – 12:10:3 15 000 7 200 6 000 1 800
Power – 1.5:1.3:2 9 000 2 813 2 438 3 750
120 000 58 753 48 350 12 898
STEP 2: Allocating service department costs to production departments:
Total (£) Assembly (£) Joinery (£) Canteen
(£)
Balance from Step 1 above 120 000 58 753 48 350 12 898
Allocate Canteen to Assembly &
Joinery
7 035 5 863 [12 898]
120 000 65 788 54 213 ------
STEP 3: Calculating the overhead recovery rates for Assembly and Joinery Department:
The quantity of "labour hours" determines the expense capacity factor. In both circumstances,
the agency's overhead costs are divided by the quantity of actual labour times for every
subdivision. The excess recuperation ratio is as follows:
𝐴𝑠𝑠𝑒𝑚𝑏𝑙𝑦 𝐷𝑒𝑝𝑎𝑟𝑡𝑚𝑒𝑛𝑡 = 𝑇𝑜𝑡𝑎𝑙 𝑂𝑣𝑒𝑟ℎ𝑒𝑎𝑑 𝐶𝑜𝑠𝑡 𝑜𝑓 𝐴𝑠𝑠𝑒𝑚𝑏𝑙𝑦
𝐷𝑒𝑝𝑎𝑟𝑡𝑚𝑒𝑛𝑡 Di𝑟𝑒𝑐𝑡 𝐿𝑎𝑏𝑜𝑢𝑟 𝐻𝑜𝑢𝑟𝑠 𝑜𝑓𝐴𝑠𝑠𝑒𝑚𝑏𝑙𝑦 𝐷𝑒𝑝𝑎𝑟𝑡𝑚𝑒𝑛t
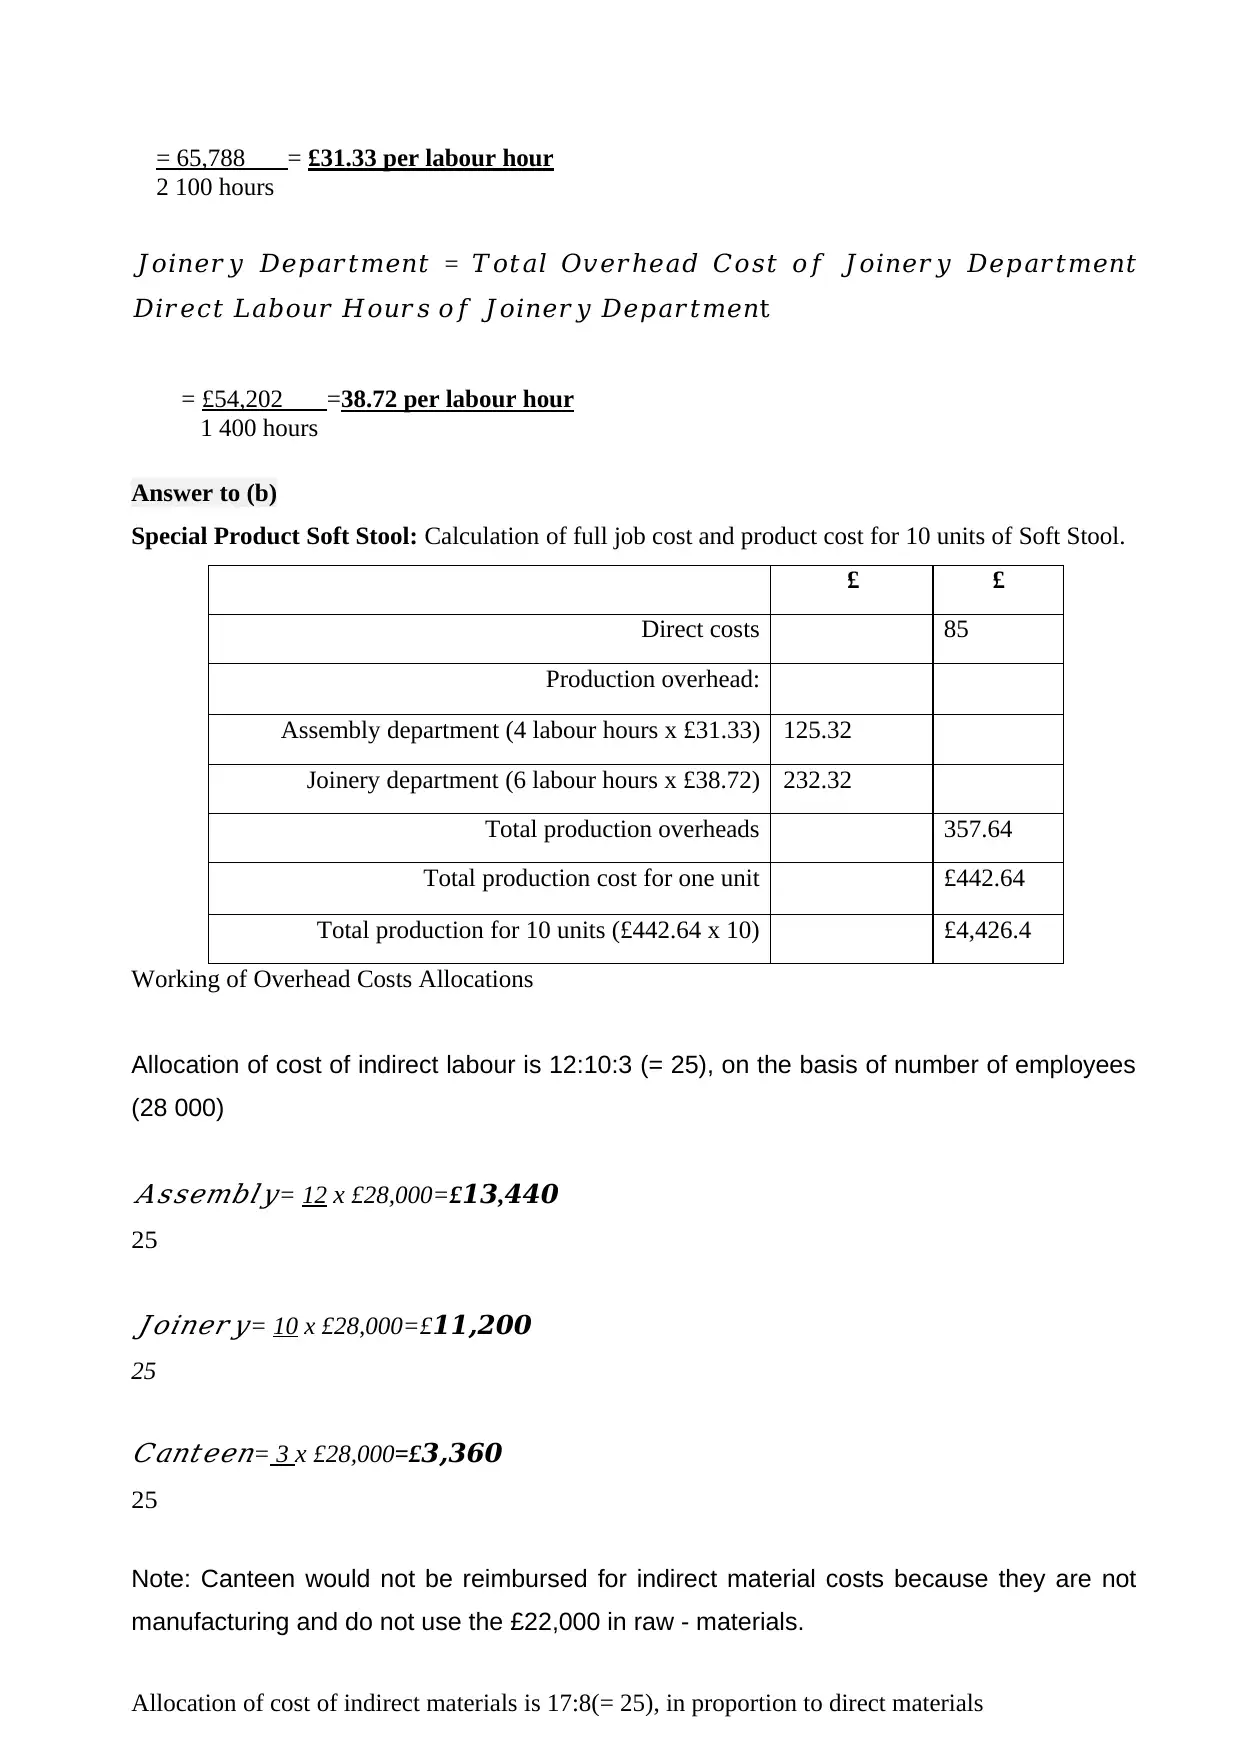
= 65,788 = £31.33 per labour hour
2 100 hours
𝐽𝑜𝑖𝑛𝑒𝑟𝑦 𝐷𝑒𝑝𝑎𝑟𝑡𝑚𝑒𝑛𝑡 = 𝑇𝑜𝑡𝑎𝑙 𝑂𝑣𝑒𝑟ℎ𝑒𝑎𝑑 𝐶𝑜𝑠𝑡 𝑜𝑓 𝐽𝑜𝑖𝑛𝑒𝑟𝑦 𝐷𝑒𝑝𝑎𝑟𝑡𝑚𝑒𝑛𝑡
𝐷𝑖𝑟𝑒𝑐𝑡 𝐿𝑎𝑏𝑜𝑢𝑟 𝐻𝑜𝑢𝑟𝑠 𝑜𝑓 𝐽𝑜𝑖𝑛𝑒𝑟𝑦 𝐷𝑒𝑝𝑎𝑟𝑡𝑚𝑒𝑛t
= £54,202 =38.72 per labour hour
1 400 hours
Answer to (b)
Special Product Soft Stool: Calculation of full job cost and product cost for 10 units of Soft Stool.
£ £
Direct costs 85
Production overhead:
Assembly department (4 labour hours x £31.33) 125.32
Joinery department (6 labour hours x £38.72) 232.32
Total production overheads 357.64
Total production cost for one unit £442.64
Total production for 10 units (£442.64 x 10) £4,426.4
Working of Overhead Costs Allocations
Allocation of cost of indirect labour is 12:10:3 (= 25), on the basis of number of employees
(28 000)
𝐴𝑠𝑠𝑒𝑚𝑏𝑙𝑦= 12 x £28,000=£13,440
25
𝐽𝑜𝑖𝑛𝑒𝑟𝑦= 10 x £28,000=£11,200
25
𝐶𝑎𝑛𝑡𝑒𝑒𝑛= 3 x £28,000=£3,360
25
Note: Canteen would not be reimbursed for indirect material costs because they are not
manufacturing and do not use the £22,000 in raw - materials.
Allocation of cost of indirect materials is 17:8(= 25), in proportion to direct materials
⊘ This is a preview!⊘
Do you want full access?
Subscribe today to unlock all pages.
Trusted by 1+ million students worldwide
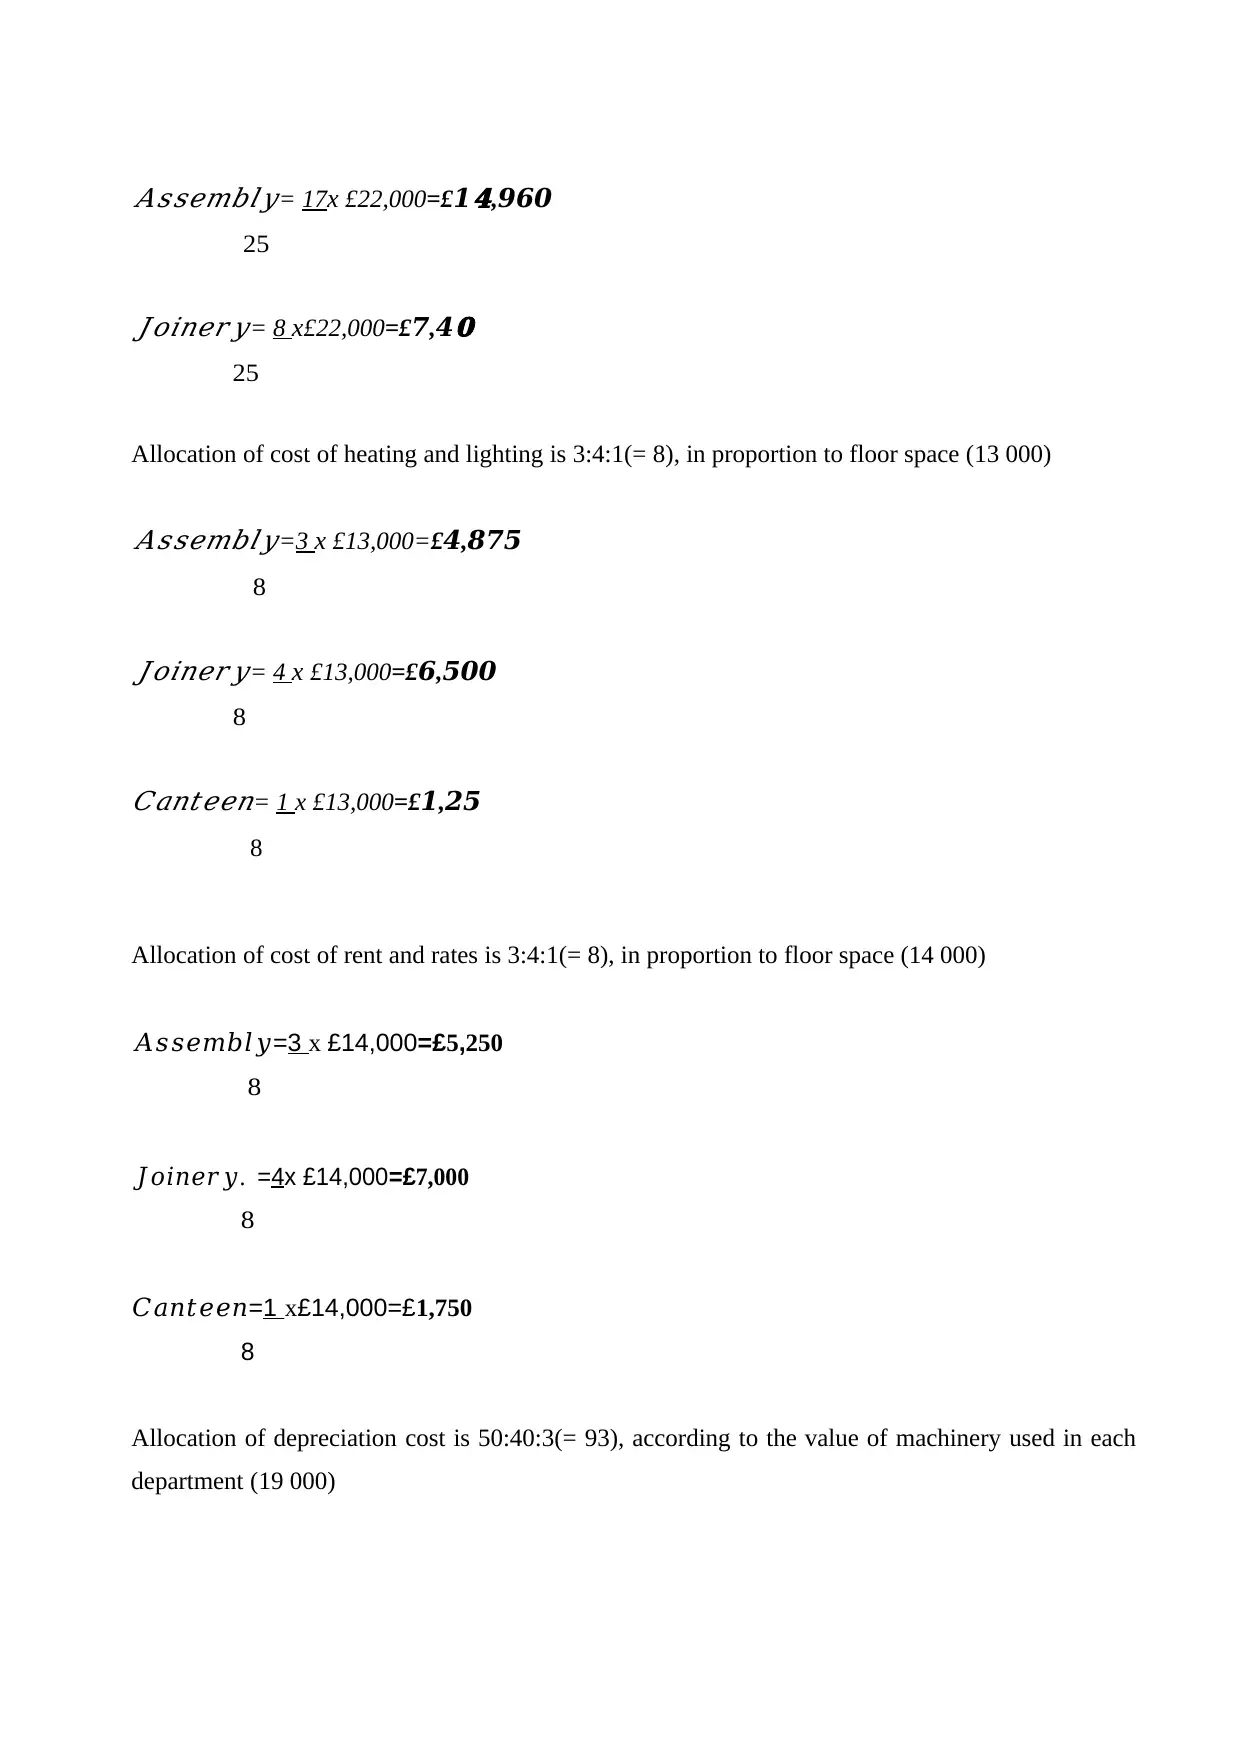
𝐴𝑠𝑠𝑒𝑚𝑏𝑙𝑦= 17x £22,000=£1
𝟒,960
25
𝐽𝑜𝑖𝑛𝑒𝑟𝑦= 8 x£22,000=£7,4
𝟎
25
Allocation of cost of heating and lighting is 3:4:1(= 8), in proportion to floor space (13 000)
𝐴𝑠𝑠𝑒𝑚𝑏𝑙𝑦=3 x £13,000=£4,875
8
𝐽𝑜𝑖𝑛𝑒𝑟𝑦= 4 x £13,000=£6,500
8𝐶𝑎𝑛𝑡𝑒𝑒𝑛= 1 x £13,000=£1,25
8
Allocation of cost of rent and rates is 3:4:1(= 8), in proportion to floor space (14 000)
𝐴𝑠𝑠𝑒𝑚𝑏𝑙𝑦=3 x £14,000=£5,250
8
𝐽𝑜𝑖𝑛𝑒𝑟𝑦. =4x £14,000=£7,000
8
𝐶𝑎𝑛𝑡𝑒𝑒𝑛=1 x£14,000=£1,750
8
Allocation of depreciation cost is 50:40:3(= 93), according to the value of machinery used in each
department (19 000)
Paraphrase This Document
Need a fresh take? Get an instant paraphrase of this document with our AI Paraphraser
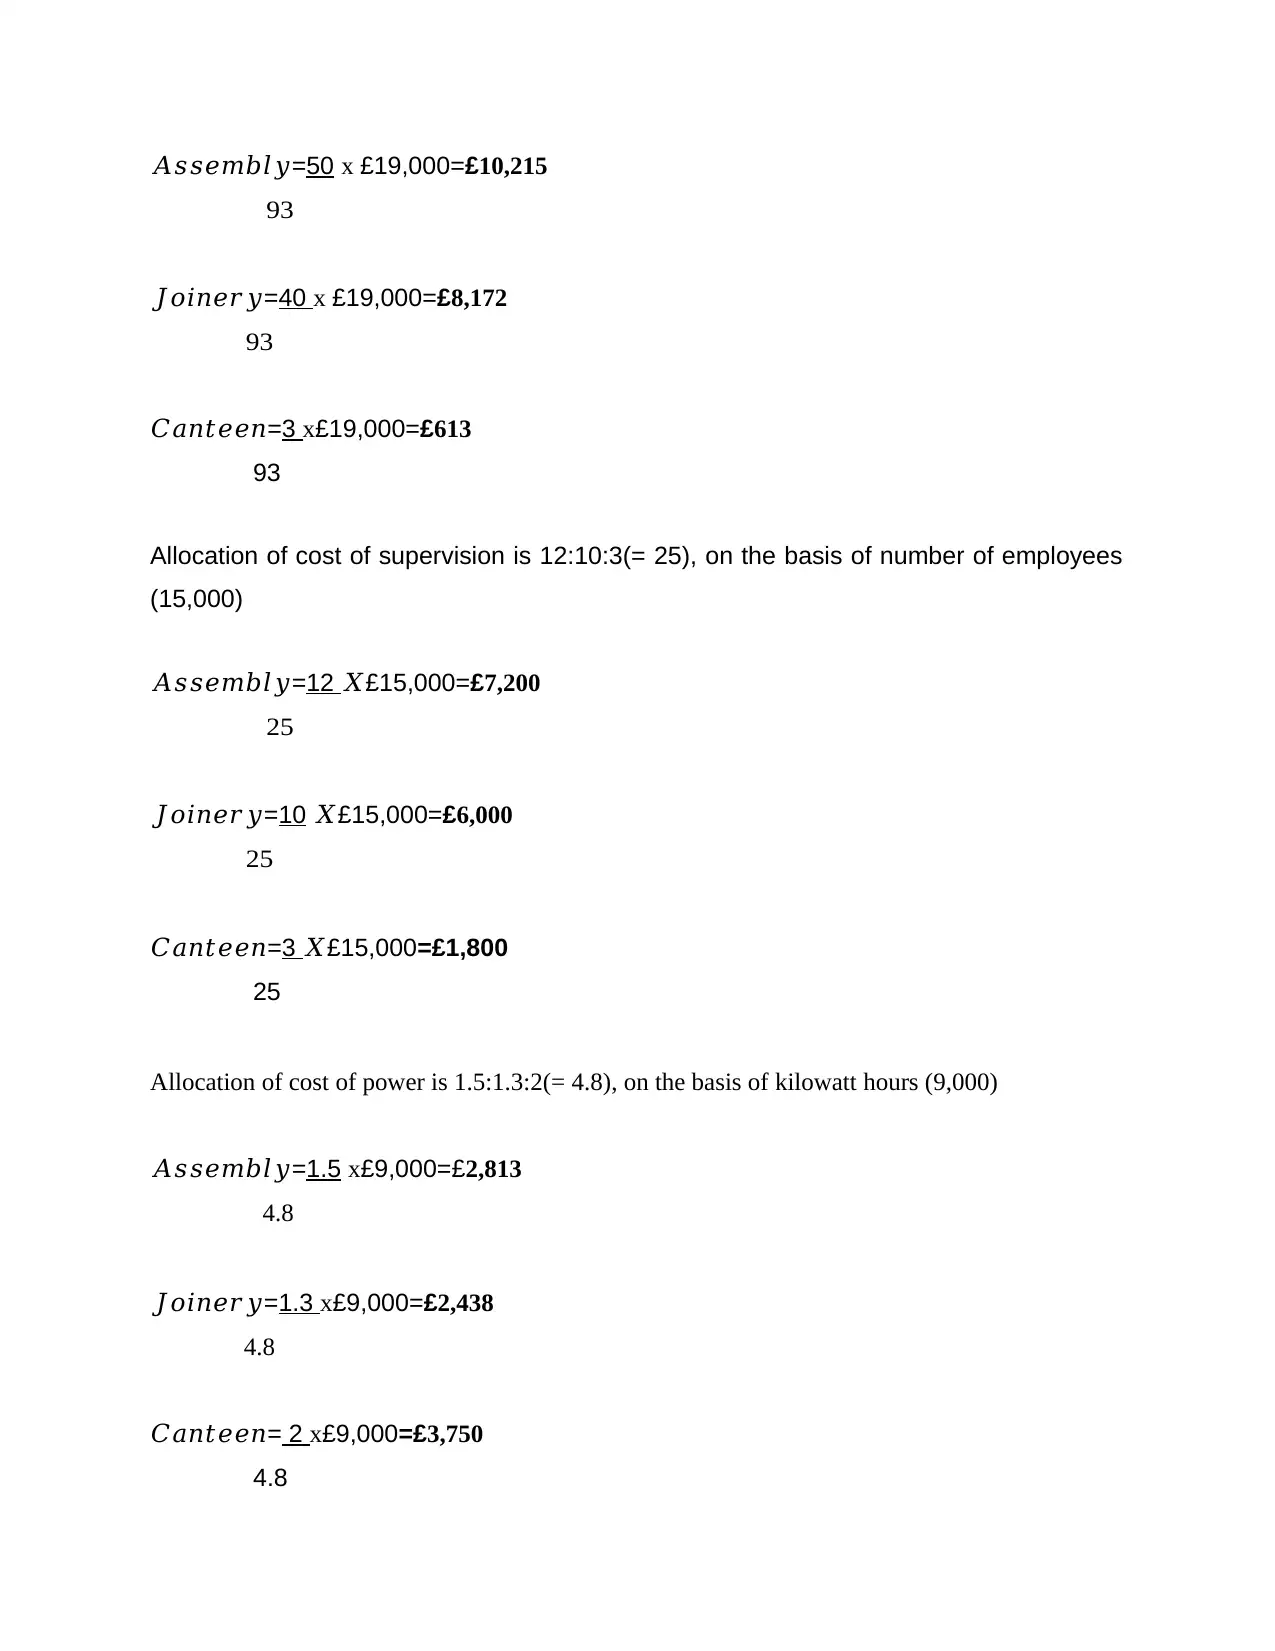
𝐴𝑠𝑠𝑒𝑚𝑏𝑙𝑦=50 x £19,000=£10,215
93
𝐽𝑜𝑖𝑛𝑒𝑟𝑦=40 x £19,000=£8,172
93
𝐶𝑎𝑛𝑡𝑒𝑒𝑛=3 x£19,000=£613
93
Allocation of cost of supervision is 12:10:3(= 25), on the basis of number of employees
(15,000)
𝐴𝑠𝑠𝑒𝑚𝑏𝑙𝑦=12 𝑋£15,000=£7,200
25
𝐽𝑜𝑖𝑛𝑒𝑟𝑦=10 𝑋£15,000=£6,000
25
𝐶𝑎𝑛𝑡𝑒𝑒𝑛=3 𝑋£15,000=£1,800
25
Allocation of cost of power is 1.5:1.3:2(= 4.8), on the basis of kilowatt hours (9,000)
𝐴𝑠𝑠𝑒𝑚𝑏𝑙𝑦=1.5 x£9,000=£2,813
4.8
𝐽𝑜𝑖𝑛𝑒𝑟𝑦=1.3 x£9,000=£2,438
4.8
𝐶𝑎𝑛𝑡𝑒𝑒𝑛= 2 x£9,000=£3,750
4.8
93
𝐽𝑜𝑖𝑛𝑒𝑟𝑦=40 x £19,000=£8,172
93
𝐶𝑎𝑛𝑡𝑒𝑒𝑛=3 x£19,000=£613
93
Allocation of cost of supervision is 12:10:3(= 25), on the basis of number of employees
(15,000)
𝐴𝑠𝑠𝑒𝑚𝑏𝑙𝑦=12 𝑋£15,000=£7,200
25
𝐽𝑜𝑖𝑛𝑒𝑟𝑦=10 𝑋£15,000=£6,000
25
𝐶𝑎𝑛𝑡𝑒𝑒𝑛=3 𝑋£15,000=£1,800
25
Allocation of cost of power is 1.5:1.3:2(= 4.8), on the basis of kilowatt hours (9,000)
𝐴𝑠𝑠𝑒𝑚𝑏𝑙𝑦=1.5 x£9,000=£2,813
4.8
𝐽𝑜𝑖𝑛𝑒𝑟𝑦=1.3 x£9,000=£2,438
4.8
𝐶𝑎𝑛𝑡𝑒𝑒𝑛= 2 x£9,000=£3,750
4.8
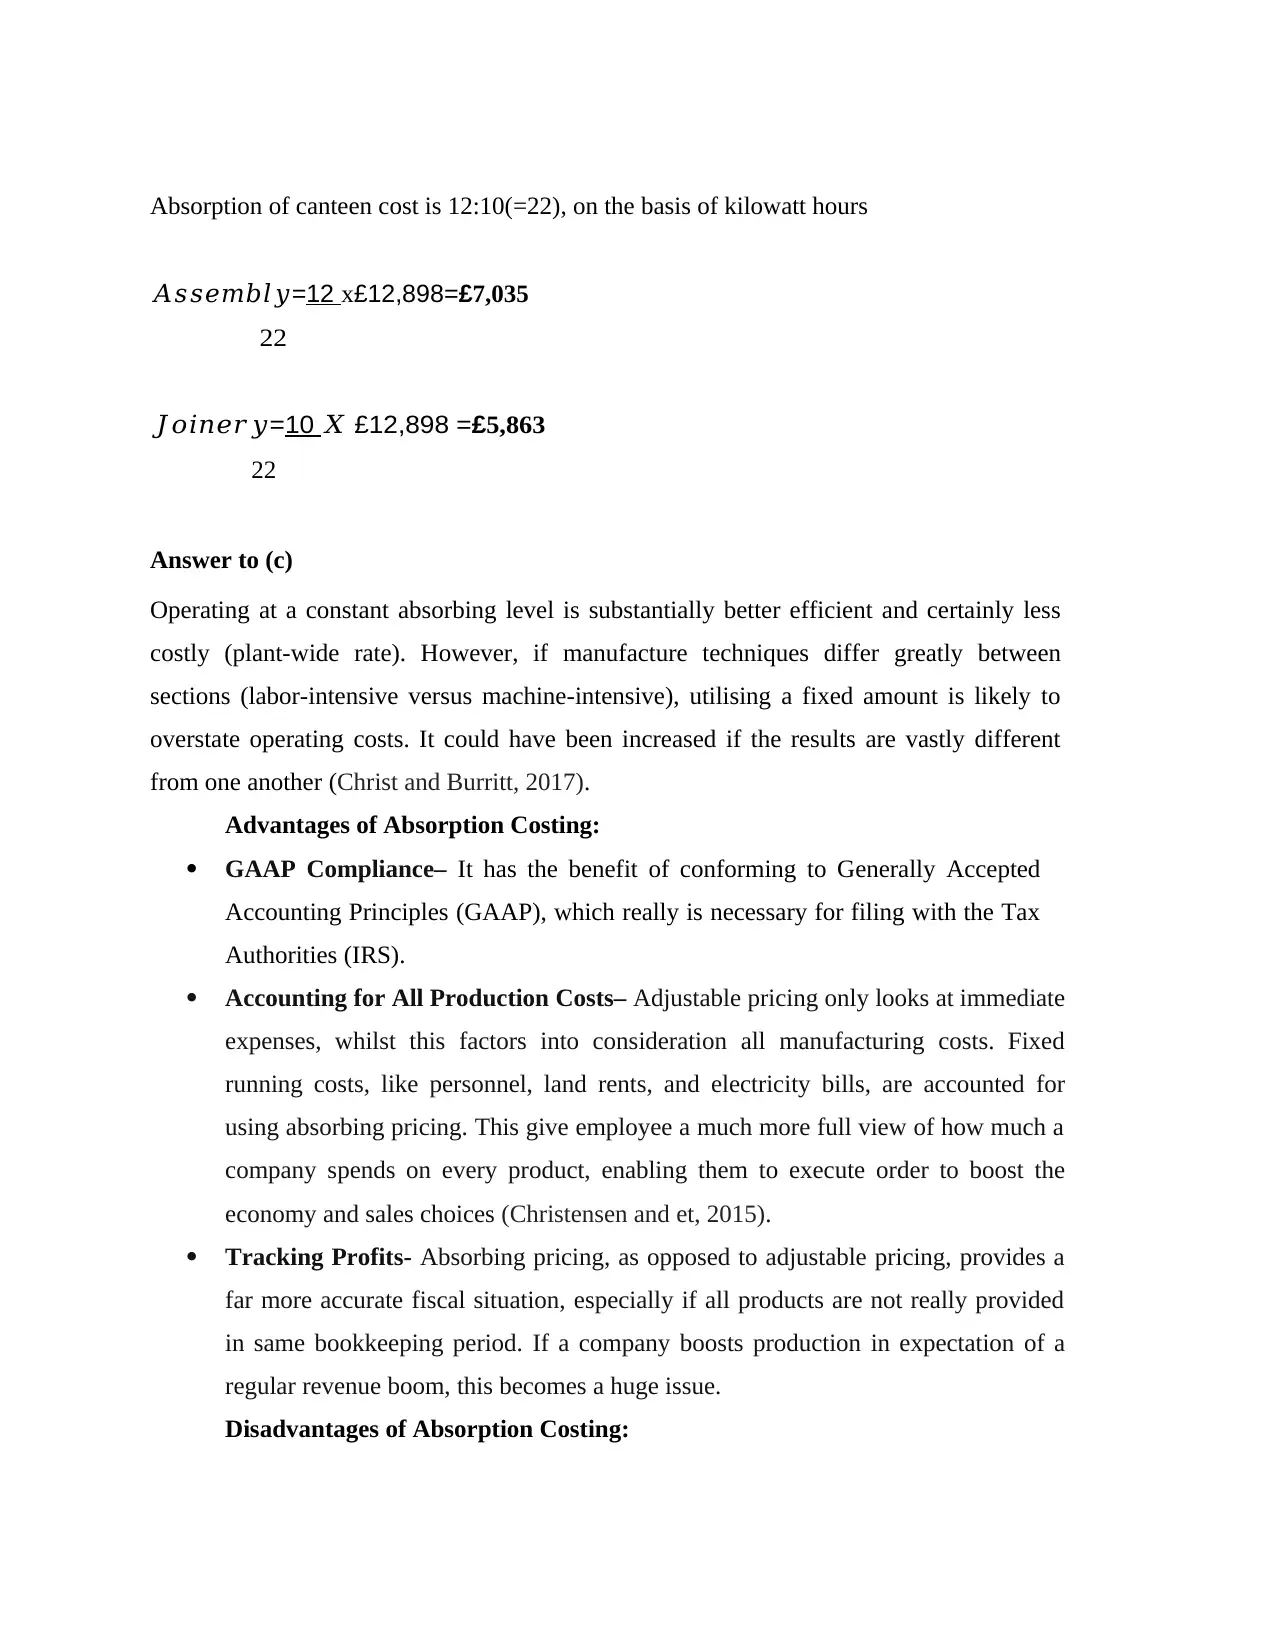
Absorption of canteen cost is 12:10(=22), on the basis of kilowatt hours
𝐴𝑠𝑠𝑒𝑚𝑏𝑙𝑦=12 x£12,898=£7,035
22
𝐽𝑜𝑖𝑛𝑒𝑟𝑦=10 𝑋 £12,898 =£5,863
22
Answer to (c)
Operating at a constant absorbing level is substantially better efficient and certainly less
costly (plant-wide rate). However, if manufacture techniques differ greatly between
sections (labor-intensive versus machine-intensive), utilising a fixed amount is likely to
overstate operating costs. It could have been increased if the results are vastly different
from one another (Christ and Burritt, 2017).
Advantages of Absorption Costing:
GAAP Compliance– It has the benefit of conforming to Generally Accepted
Accounting Principles (GAAP), which really is necessary for filing with the Tax
Authorities (IRS).
Accounting for All Production Costs– Adjustable pricing only looks at immediate
expenses, whilst this factors into consideration all manufacturing costs. Fixed
running costs, like personnel, land rents, and electricity bills, are accounted for
using absorbing pricing. This give employee a much more full view of how much a
company spends on every product, enabling them to execute order to boost the
economy and sales choices (Christensen and et, 2015).
Tracking Profits- Absorbing pricing, as opposed to adjustable pricing, provides a
far more accurate fiscal situation, especially if all products are not really provided
in same bookkeeping period. If a company boosts production in expectation of a
regular revenue boom, this becomes a huge issue.
Disadvantages of Absorption Costing:
⊘ This is a preview!⊘
Do you want full access?
Subscribe today to unlock all pages.
Trusted by 1+ million students worldwide
1 out of 20
Related Documents


Your All-in-One AI-Powered Toolkit for Academic Success.
+13062052269
info@desklib.com
Available 24*7 on WhatsApp / Email
![[object Object]](/_next/static/media/star-bottom.7253800d.svg)
Unlock your academic potential
Copyright © 2020–2026 A2Z Services. All Rights Reserved. Developed and managed by ZUCOL.