Statistics for Management: CPI, RPI, Earnings and Inflation Report
VerifiedAdded on 2020/11/12
|17
|3322
|335
Report
AI Summary
This report provides a statistical analysis of Consumer Price Index (CPI), Retail Price Index (RPI), and per-hour earnings data. It begins with data collection from the Office of National Statistics website, presenting CPI, RPI, and CPIH data in tabular and graphical formats, analyzing the differences between them, and calculating annual inflation rates. The report then delves into the statistical analysis of per-hour earnings, calculating median, quartiles, mean, and standard deviation, and comparing earnings between London and Manchester. A paired t-test is also conducted, including the determination of conditions and construction of confidence levels. Finally, the report presents the data in bar and Ogive charts, and concludes with the significance of inflation and its impact.

STATISTICS FOR MANAGEMENT
Paraphrase This Document
Need a fresh take? Get an instant paraphrase of this document with our AI Paraphraser
Table of Contents
INTRODUCTION...........................................................................................................................1
ACTIVITY 1....................................................................................................................................1
A. Data collection for consumer price index and Retail price index from Office of National
statistic website.......................................................................................................................1
B. Reflecting of 10 years data of CPI and RPI in tabular and graphical format....................3
C. Analysing difference between consumer and retail price indices......................................3
D. Using data of CPI and PRI, presenting annular inflation..................................................5
E. presenting the reasons for significance of the infarction..................................................6
ACTIVITY 2....................................................................................................................................6
A. 1 Determination of the value of median and quartile for the per hour earnings................6
A.2 Determination of the value of standard deviation and mean for per hour earnings.......7
B. Comparison of the earning of London and Manchester...................................................8
ACTIVITY 3....................................................................................................................................9
A. Presenting paired t test with significant level of 5%........................................................9
B. Determination of the conditions of paired t teat...............................................................9
C. Construction of the confidence level at 99%..................................................................10
ACTIVITY 4..................................................................................................................................10
A. Presentation of the data of CPI, RPI and CPIH in format of bar graph..........................10
B. Presenting Ogive chart for Cumulative % of staff vs hourly earnings............................11
CONCLUSION..............................................................................................................................11
REFERENCES..............................................................................................................................12
INTRODUCTION
Statistical data analysis is the measure used by business organizations and financial
authorities at national level to determine the effect of changes occurring in the economy. With
implementation of different tools and techniques of the statistic various economical and financial
aspects are evaluated to determine the potential effect on changes in those aspects. The process
under this is carried out as collection of data and then evaluating and presenting them in tabular,
graphical and diagrammatic manner. With application of statistical strategical the management
of a business can improve management by analysis of current data of business operations. In the
present report analysis of data collected for CPI and PRI, form website of Office of national
statistics is done. Presenting the data in tabular, graphical format and interpreting the same is
done. The hourly pay rates in the various region of UK are analyzed with using statistical tools
such as means, median standard deviation and quartile. In the report brief research is carried
outs for presenting the solution for research and business planing. In the lase part of the report an
Ogive chart is prepared for the indices of hourly earnings and percentage of staff.
ACTIVITY 1
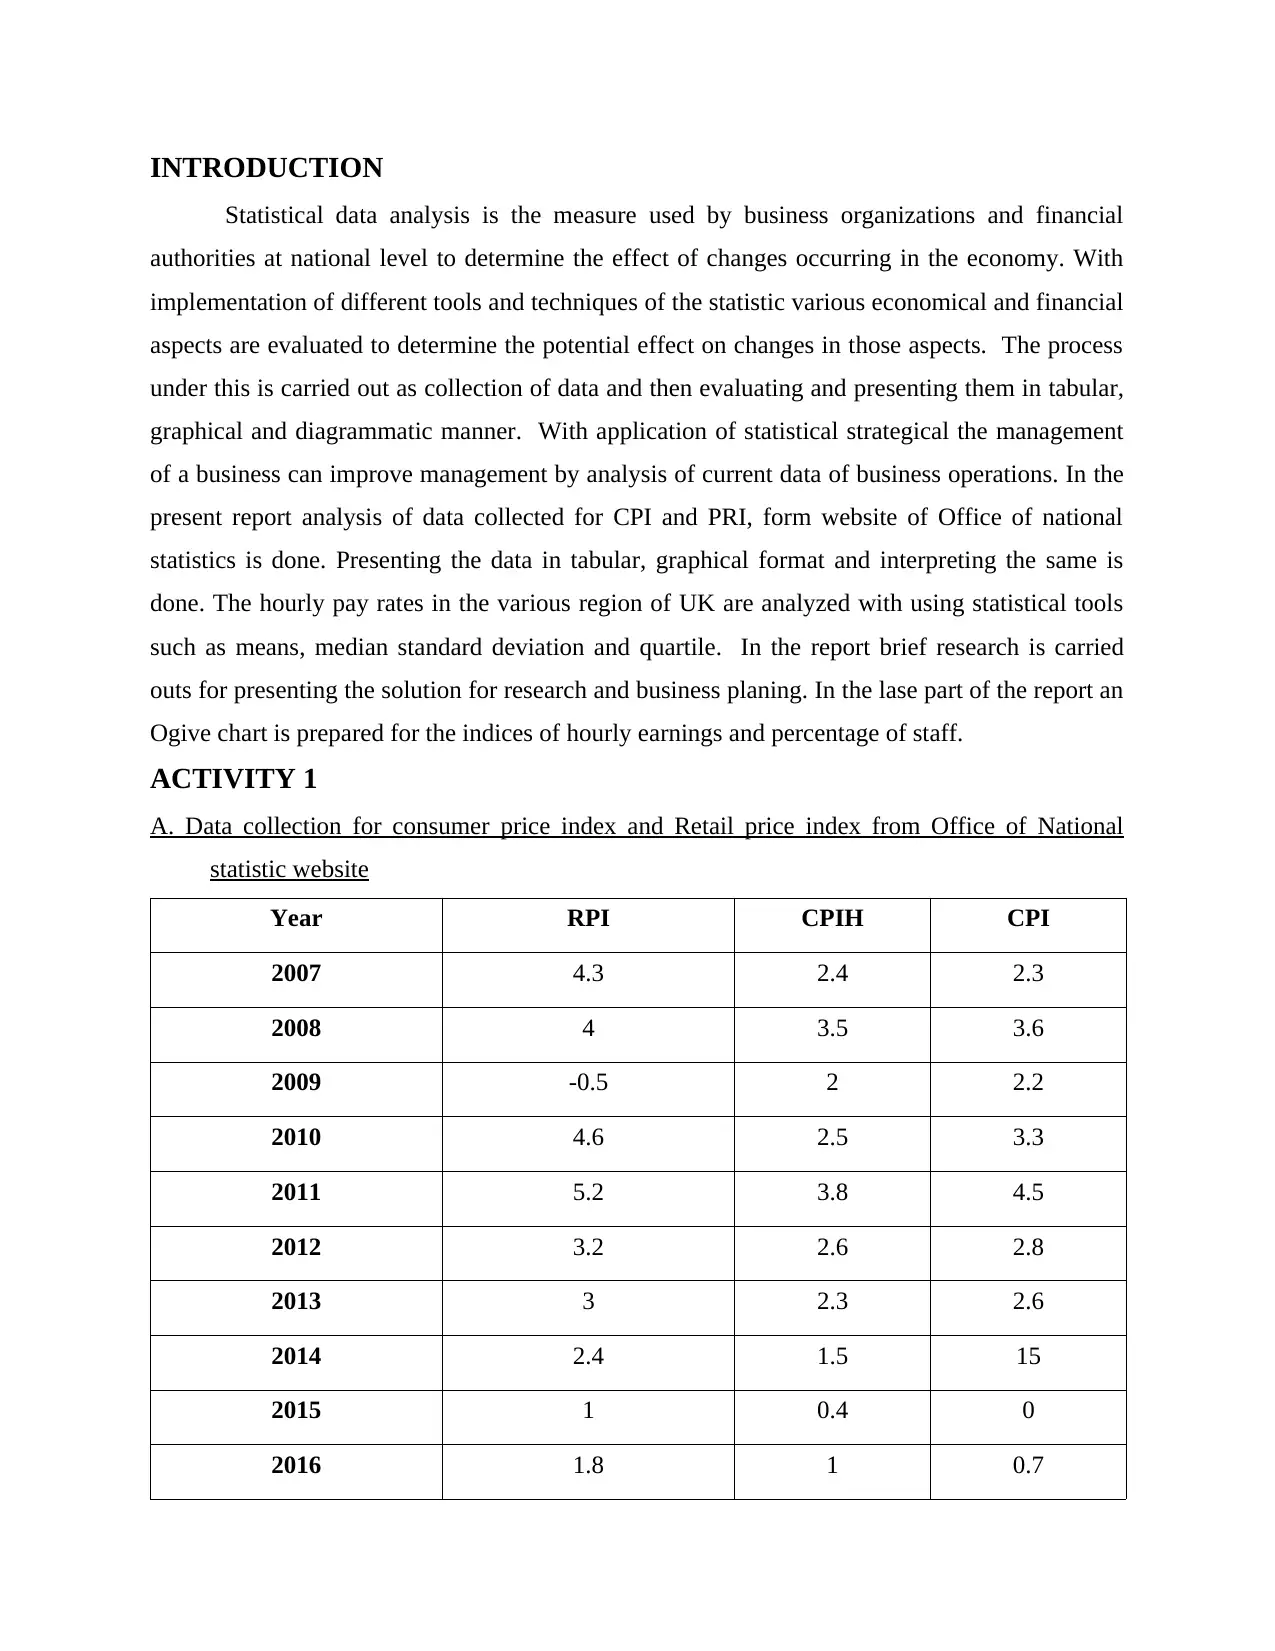
A. Data collection for consumer price index and Retail price index from Office of National
statistic website
Year RPI CPIH CPI
2007 4.3 2.4 2.3
2008 4 3.5 3.6
2009 -0.5 2 2.2
2010 4.6 2.5 3.3
2011 5.2 3.8 4.5
2012 3.2 2.6 2.8
2013 3 2.3 2.6
2014 2.4 1.5 15
2015 1 0.4 0
2016 1.8 1 0.7
Statistical data analysis is the measure used by business organizations and financial
authorities at national level to determine the effect of changes occurring in the economy. With
implementation of different tools and techniques of the statistic various economical and financial
aspects are evaluated to determine the potential effect on changes in those aspects. The process
under this is carried out as collection of data and then evaluating and presenting them in tabular,
graphical and diagrammatic manner. With application of statistical strategical the management
of a business can improve management by analysis of current data of business operations. In the
present report analysis of data collected for CPI and PRI, form website of Office of national
statistics is done. Presenting the data in tabular, graphical format and interpreting the same is
done. The hourly pay rates in the various region of UK are analyzed with using statistical tools
such as means, median standard deviation and quartile. In the report brief research is carried
outs for presenting the solution for research and business planing. In the lase part of the report an
Ogive chart is prepared for the indices of hourly earnings and percentage of staff.
ACTIVITY 1
A. Data collection for consumer price index and Retail price index from Office of National
statistic website
Year RPI CPIH CPI
2007 4.3 2.4 2.3
2008 4 3.5 3.6
2009 -0.5 2 2.2
2010 4.6 2.5 3.3
2011 5.2 3.8 4.5
2012 3.2 2.6 2.8
2013 3 2.3 2.6
2014 2.4 1.5 15
2015 1 0.4 0
2016 1.8 1 0.7
⊘ This is a preview!⊘
Do you want full access?
Subscribe today to unlock all pages.
Trusted by 1+ million students worldwide
2017 3.6 2.6 2.7
Interpretation:
The above table presents the data CPI, RPI and CPIH taken from office of national
statistics website. The data is for 10 years from 2007 to 2010 depicting the changes in all three
indices. For all three indices it has been observed that all of them showed thought change ion
year 2011/s for the year 2009 RPI has been measured negative at -0.5 (Baak and et.al., 2015) .
The lowest CPI was in year 2015 at 0, this means the prices change in the commodity basket for
this year was nil. CPIH was lowest for year 2015 at 0.4. with this it can be articulated that the
highest changes in the price were seen in the year 2011 and lowest were seen in 2015.
Consumer price index: this is one of the important measure for decontamination of the
inflation in the UK. This is determined as changes in the prices of goods and commodities in
predetermined basket. The CPI represents the cost of a basket of goods and services across the
country on a monthly basis (U.K. Retail Price Index (RPI), 2018). The goods are divided in
categories like food and beverages, housing, apparel, transportation, medical care, recreation,
education and communication. Change CPI are used to evaluate the affect of price changes on
the cost of living.
Retail price index: RPI is a measure to determine the changes in prices of the fixed
consumer goods and services in the basket. This is also a measure to determined inflation of the
UK. Under RPI changes in price of goods and service are considered which are purchased by
consumer for purpose of consumption.
CPIH: this is an additional measure of consumer price inflation which include a measure
ODF Occupiers housing costs (OOH). This can be elaborated as implicit cost of housing for
owners occupier. The data for this index is given by office of national statistics only.
Paraphrase This Document
Need a fresh take? Get an instant paraphrase of this document with our AI Paraphraser
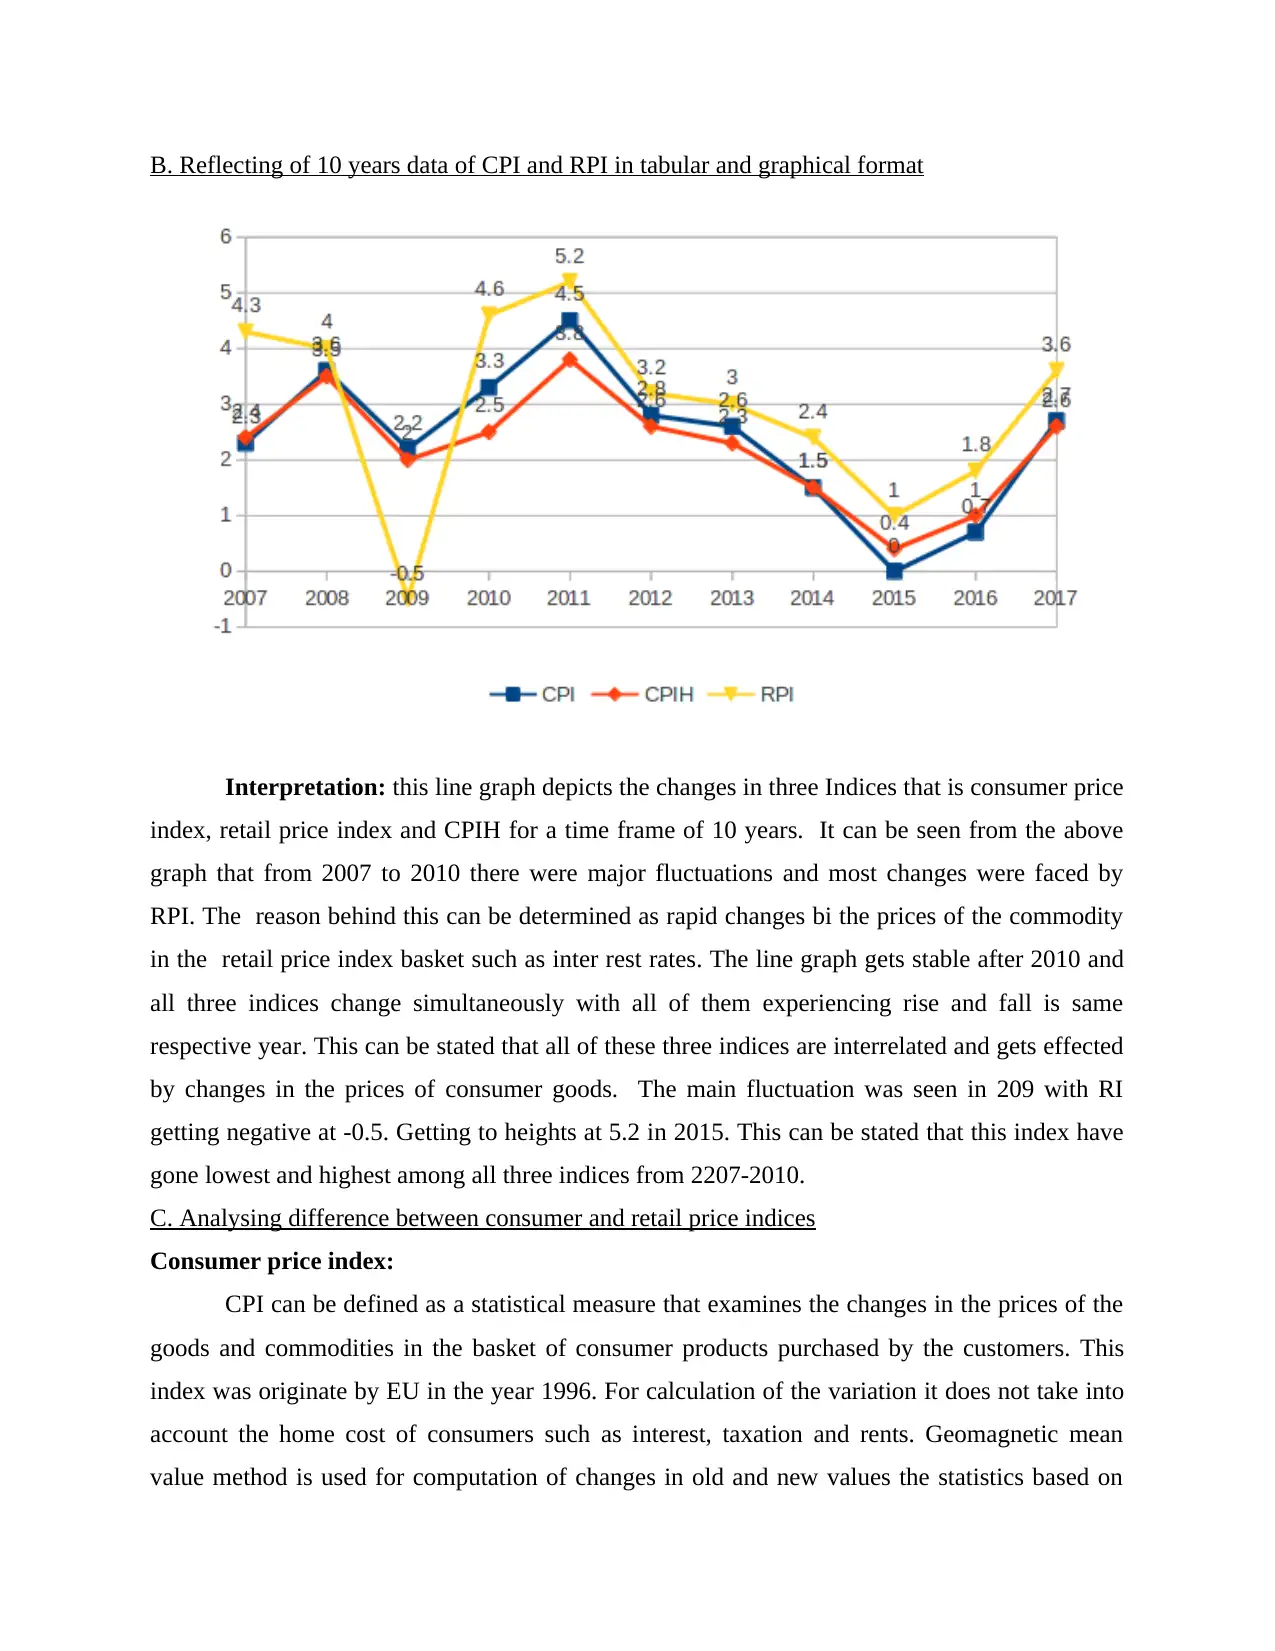
B. Reflecting of 10 years data of CPI and RPI in tabular and graphical format
Interpretation: this line graph depicts the changes in three Indices that is consumer price
index, retail price index and CPIH for a time frame of 10 years. It can be seen from the above
graph that from 2007 to 2010 there were major fluctuations and most changes were faced by
RPI. The reason behind this can be determined as rapid changes bi the prices of the commodity
in the retail price index basket such as inter rest rates. The line graph gets stable after 2010 and
all three indices change simultaneously with all of them experiencing rise and fall is same
respective year. This can be stated that all of these three indices are interrelated and gets effected
by changes in the prices of consumer goods. The main fluctuation was seen in 209 with RI
getting negative at -0.5. Getting to heights at 5.2 in 2015. This can be stated that this index have
gone lowest and highest among all three indices from 2207-2010.
C. Analysing difference between consumer and retail price indices
Consumer price index:
CPI can be defined as a statistical measure that examines the changes in the prices of the
goods and commodities in the basket of consumer products purchased by the customers. This
index was originate by EU in the year 1996. For calculation of the variation it does not take into
account the home cost of consumers such as interest, taxation and rents. Geomagnetic mean
value method is used for computation of changes in old and new values the statistics based on
data of household spending in national accounts. For collection of the data relative lower portion
of the public is considered and it determines the weighted average price of economic outputs
shopped. The cost related with brokerage, unit trust, accommodation, education all are taken
into account in this index calculation the value computed for CPI is generally lower than the
RPI.
Retail price index:
It can be elaborated as a measure for determination of consumer inflation by computing
the changes in the prices of consumer products in a fixed basket (The difference between CPI
and RPI inflation, 2018). IT was developed in year 1956 in UK. Unlikely CPI this taken into
consideration the home cost of the consumers that is interest, rents and taxes. For calculation of
the RPI arithmetic mean value is used to calculate difference between new and old values and it
is based on survey of food and ONS expenditure. As far as RPI is considered it considers larger
section of the public for taking the changes in the prices of the consumer goods and products.
This evaluated the variation in the retail economic output prices. When compared with CPI it
does not take into account the cost related with education fees and cost related with brokerage,
accommodation etc. The values of RPI is relatively higher as compared with CPI.
With this it can be clearly stated that the major differences between CPI and RPI has been
determined as RPI take into account the home cost of consumer is that is expenses related with
interest, rents and taxation, rather CPI so not consider this in computation of the inflation and
price changes. RPI is calculated by taking arithmetic mean values instead CPI is determined with
geometric mean values. By comparison of both the values it can be interpreted that value of RPI
is usually higher than value of CPI.
⊘ This is a preview!⊘
Do you want full access?
Subscribe today to unlock all pages.
Trusted by 1+ million students worldwide
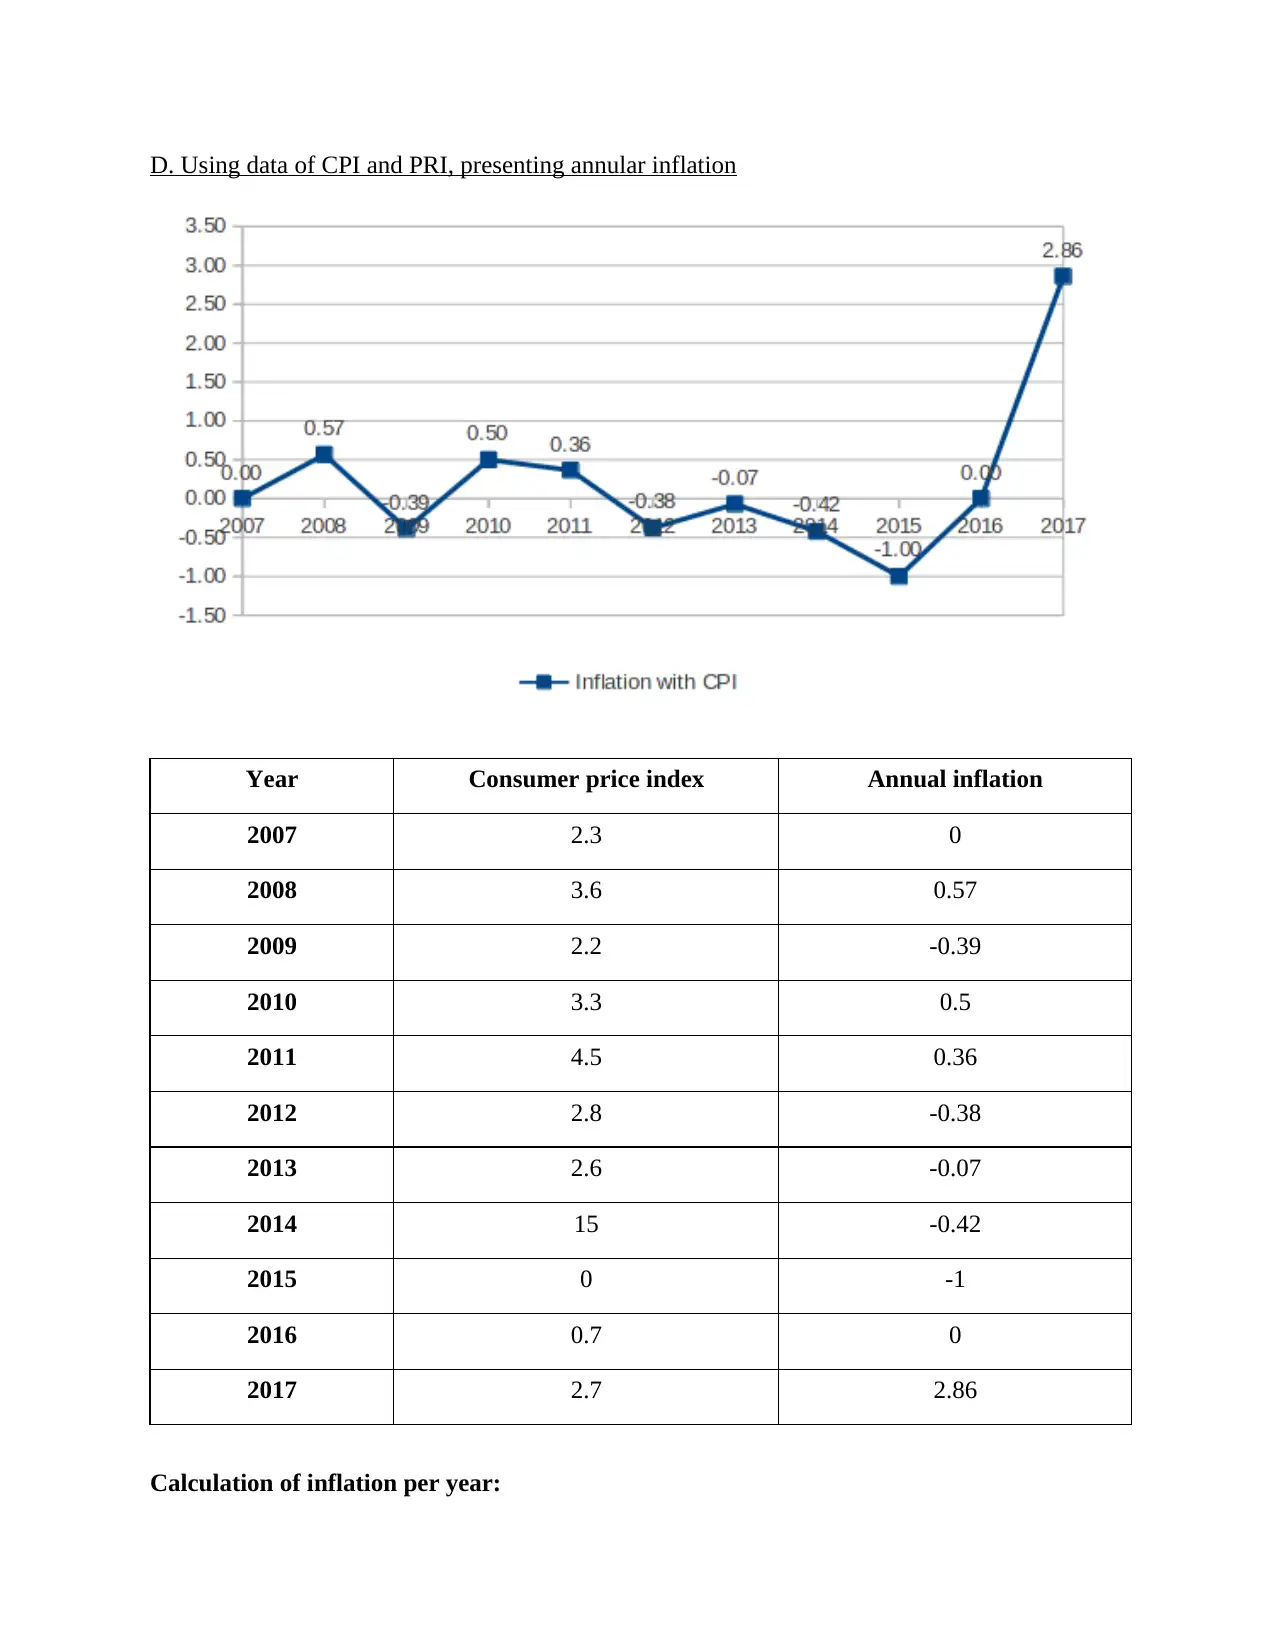
D. Using data of CPI and PRI, presenting annular inflation
Year Consumer price index Annual inflation
2007 2.3 0
2008 3.6 0.57
2009 2.2 -0.39
2010 3.3 0.5
2011 4.5 0.36
2012 2.8 -0.38
2013 2.6 -0.07
2014 15 -0.42
2015 0 -1
2016 0.7 0
2017 2.7 2.86
Calculation of inflation per year:
Year Consumer price index Annual inflation
2007 2.3 0
2008 3.6 0.57
2009 2.2 -0.39
2010 3.3 0.5
2011 4.5 0.36
2012 2.8 -0.38
2013 2.6 -0.07
2014 15 -0.42
2015 0 -1
2016 0.7 0
2017 2.7 2.86
Calculation of inflation per year:
Paraphrase This Document
Need a fresh take? Get an instant paraphrase of this document with our AI Paraphraser
CPI for current year – CPI of previous year
CPI for previsions year
Example: inflation for 2008= (3.6-2.3)/ 2.3
E. presenting the reasons for significance of the infarction
Inflation is explained as the measure to determine level of change in the prices of the
goods, commodities and services which are essentially for every citizen in the nation. Inflation
indicated decrease in the purchasing power of a nation's currency (Bates and et.al., 2014). With
rise in the prices of commodity in the inflation basket the cost of living for the common public
and monetary authority of the country started to get effected. The inflation in UK is determined
by two specific tools that is consumer and retail price index.
Significance of the inflation can be established with the fact that with a determination of
inflation the interest rates are fixed by the banking authorities of the UK. S if the CPI is
calculated to be more than 2% the interest rates are increased to subdue the effect of price
inflation. Conversely, if CPI is determined to be lower than 2% for a year the interest rates are
decreased in order to nullify the effect on inflation. The organization in the UK determined the
level of rise in the pay with rate of inflation. With inflation market tend to become more liquid
and assets become less elastic.
ACTIVITY 2
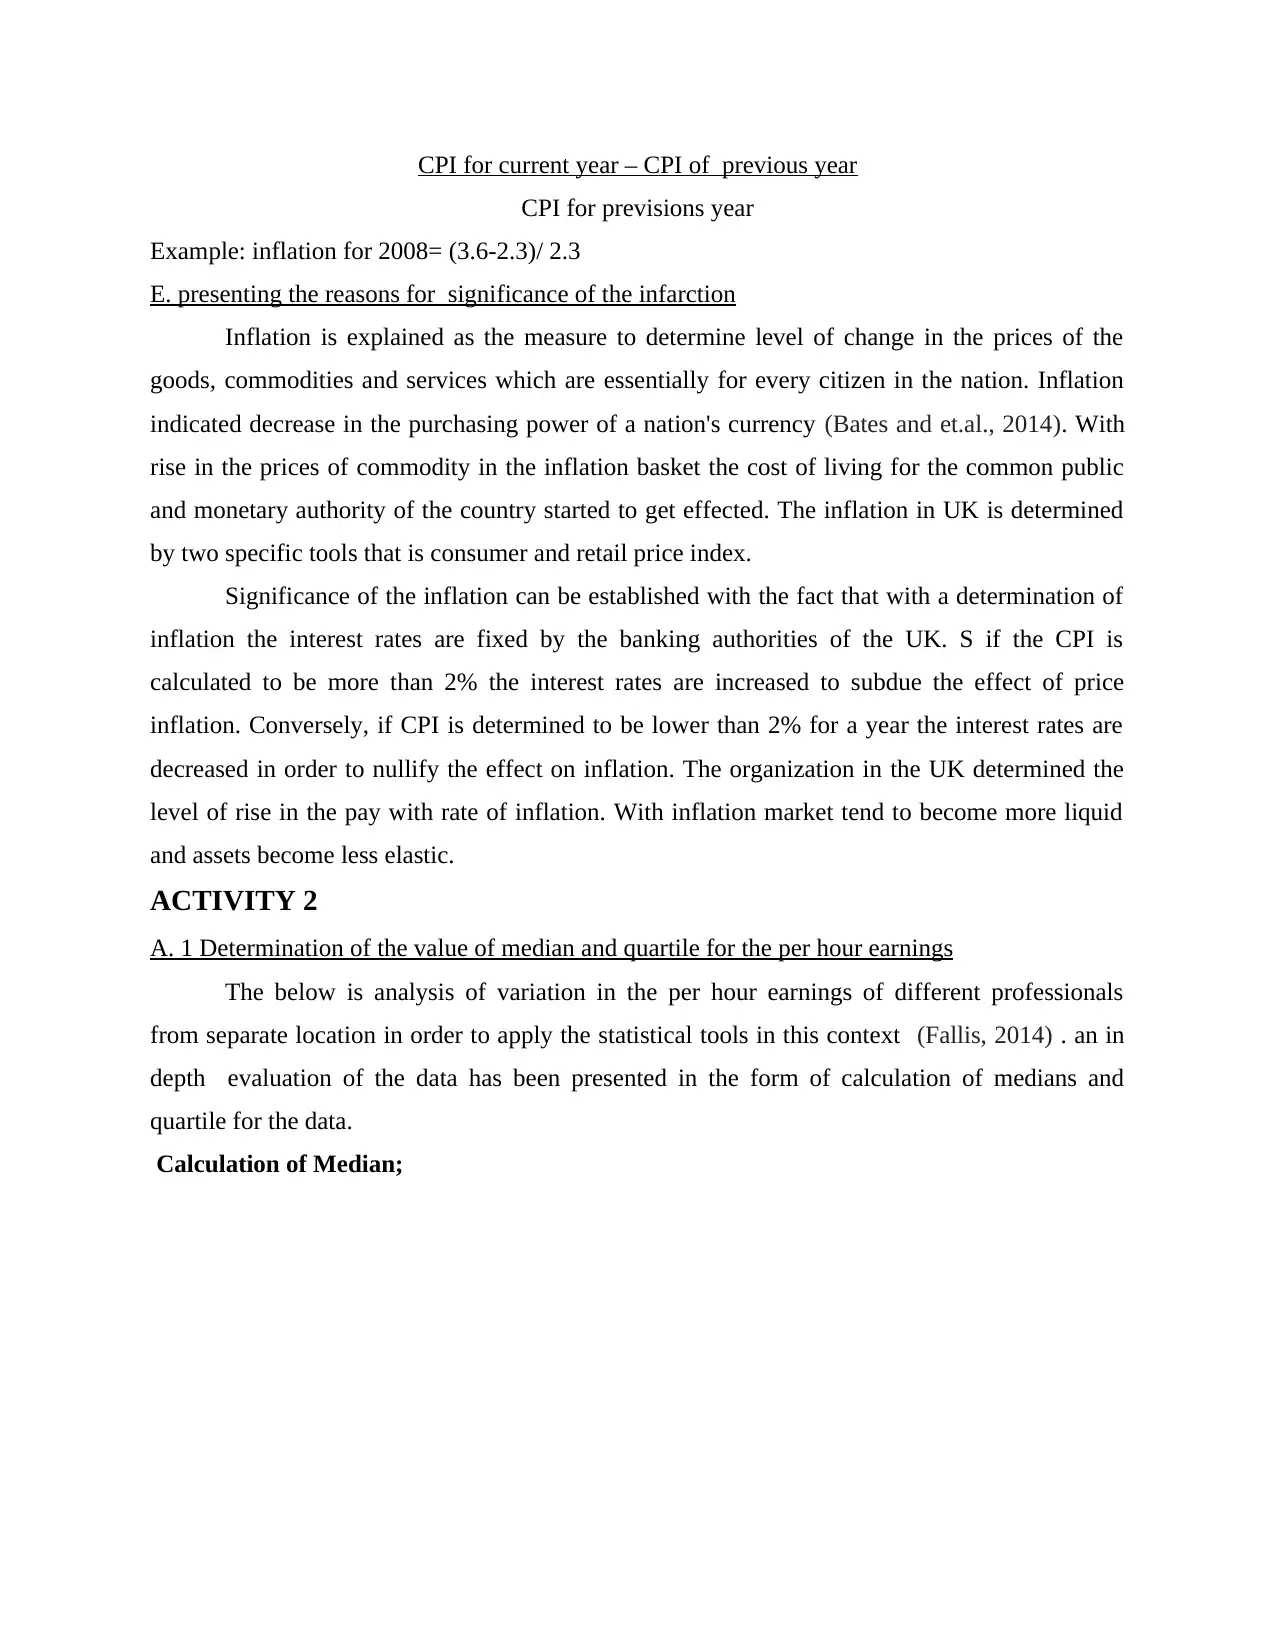
A. 1 Determination of the value of median and quartile for the per hour earnings
The below is analysis of variation in the per hour earnings of different professionals
from separate location in order to apply the statistical tools in this context (Fallis, 2014) . an in
depth evaluation of the data has been presented in the form of calculation of medians and
quartile for the data.
Calculation of Median;
CPI for previsions year
Example: inflation for 2008= (3.6-2.3)/ 2.3
E. presenting the reasons for significance of the infarction
Inflation is explained as the measure to determine level of change in the prices of the
goods, commodities and services which are essentially for every citizen in the nation. Inflation
indicated decrease in the purchasing power of a nation's currency (Bates and et.al., 2014). With
rise in the prices of commodity in the inflation basket the cost of living for the common public
and monetary authority of the country started to get effected. The inflation in UK is determined
by two specific tools that is consumer and retail price index.
Significance of the inflation can be established with the fact that with a determination of
inflation the interest rates are fixed by the banking authorities of the UK. S if the CPI is
calculated to be more than 2% the interest rates are increased to subdue the effect of price
inflation. Conversely, if CPI is determined to be lower than 2% for a year the interest rates are
decreased in order to nullify the effect on inflation. The organization in the UK determined the
level of rise in the pay with rate of inflation. With inflation market tend to become more liquid
and assets become less elastic.
ACTIVITY 2
A. 1 Determination of the value of median and quartile for the per hour earnings
The below is analysis of variation in the per hour earnings of different professionals
from separate location in order to apply the statistical tools in this context (Fallis, 2014) . an in
depth evaluation of the data has been presented in the form of calculation of medians and
quartile for the data.
Calculation of Median;
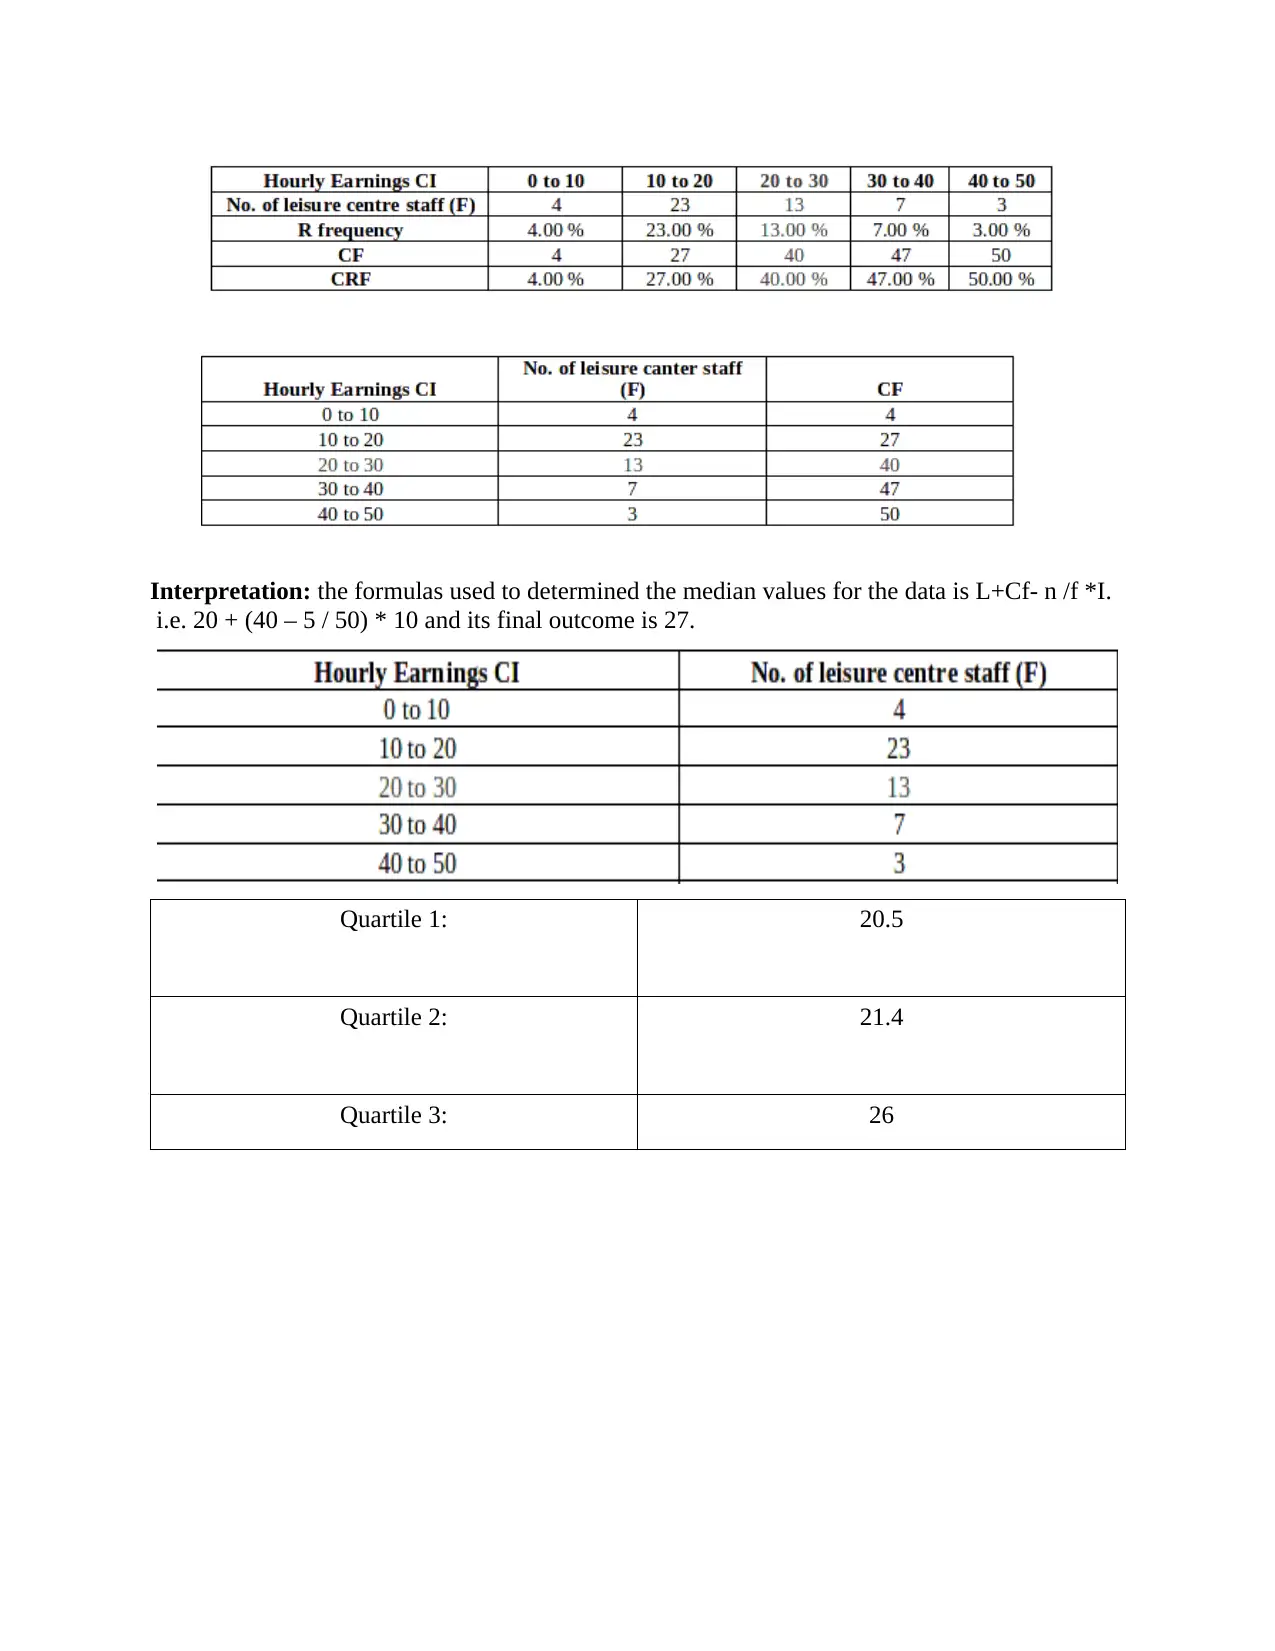
Interpretation: the formulas used to determined the median values for the data is L+Cf- n /f *I.
i.e. 20 + (40 – 5 / 50) * 10 and its final outcome is 27.
Quartile 1: 20.5
Quartile 2: 21.4
Quartile 3: 26
i.e. 20 + (40 – 5 / 50) * 10 and its final outcome is 27.
Quartile 1: 20.5
Quartile 2: 21.4
Quartile 3: 26
⊘ This is a preview!⊘
Do you want full access?
Subscribe today to unlock all pages.
Trusted by 1+ million students worldwide
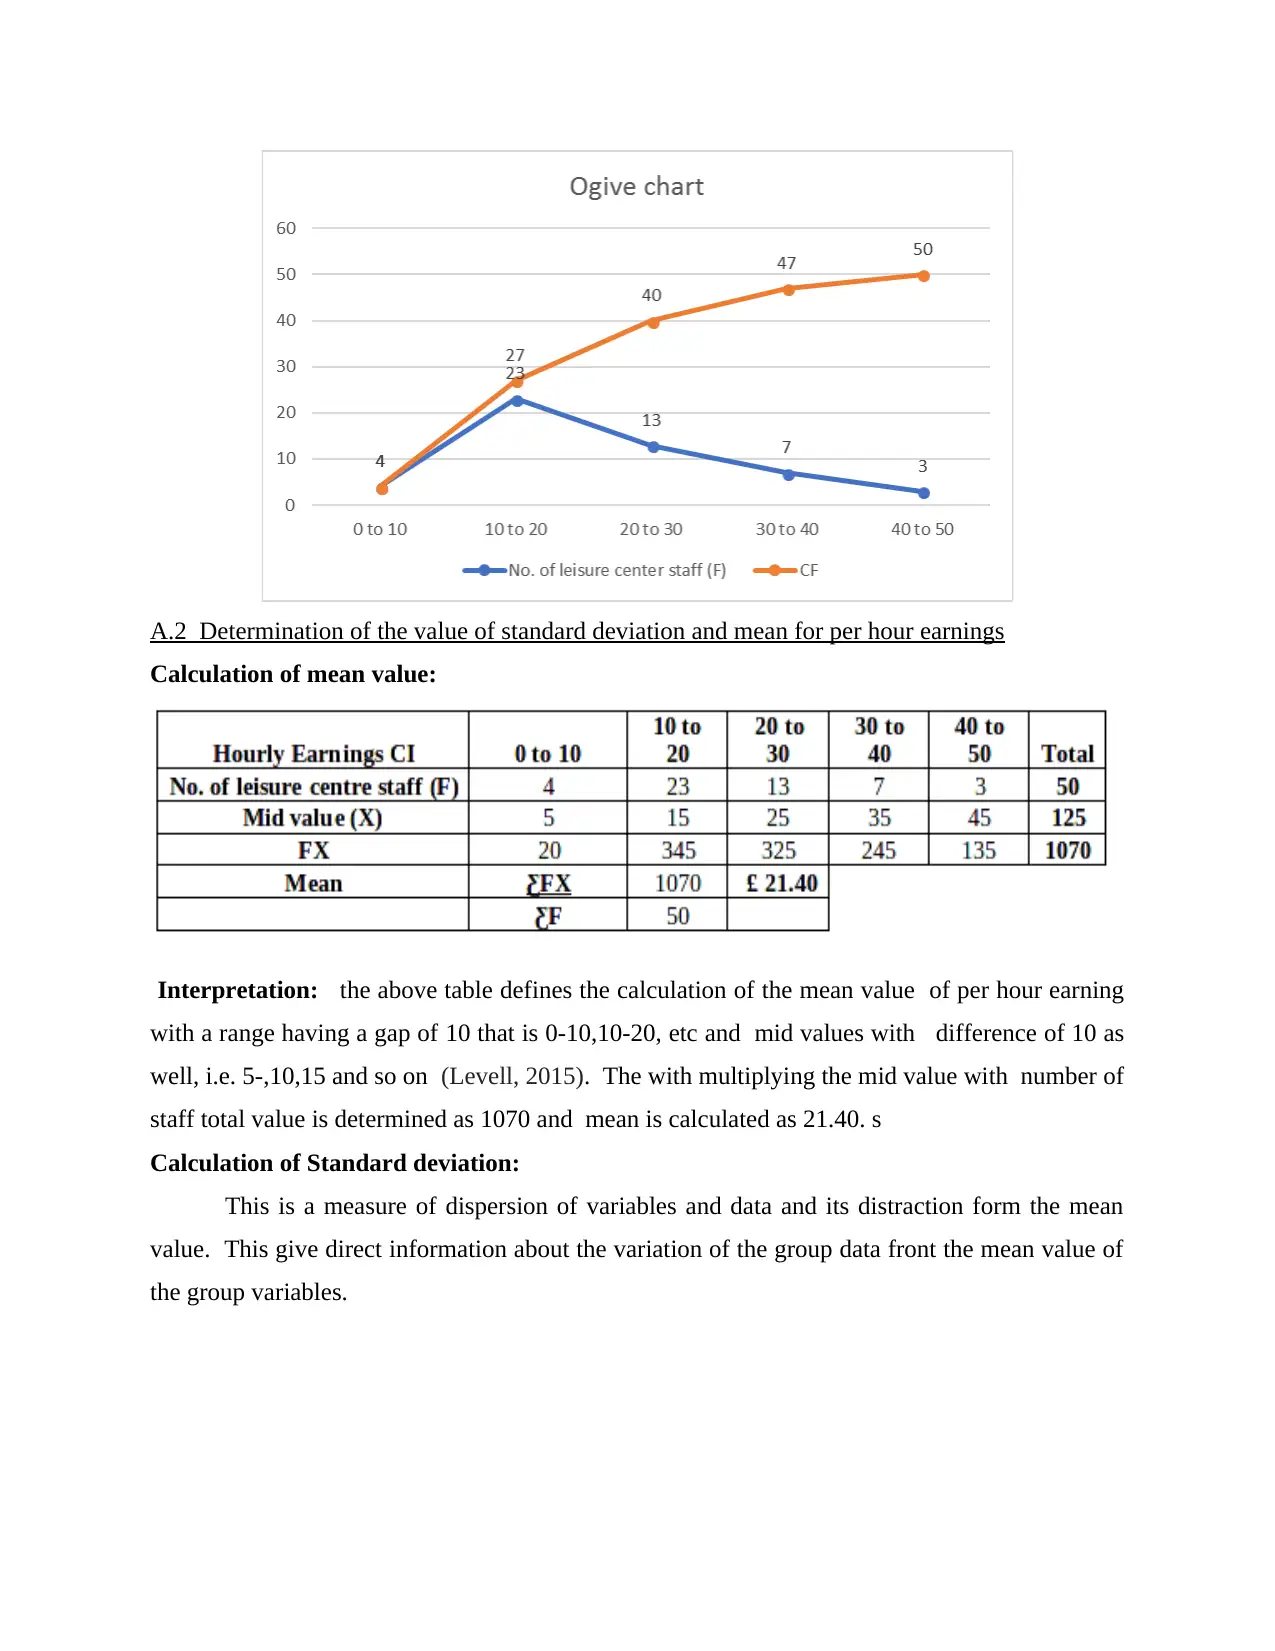
A.2 Determination of the value of standard deviation and mean for per hour earnings
Calculation of mean value:
Interpretation: the above table defines the calculation of the mean value of per hour earning
with a range having a gap of 10 that is 0-10,10-20, etc and mid values with difference of 10 as
well, i.e. 5-,10,15 and so on (Levell, 2015). The with multiplying the mid value with number of
staff total value is determined as 1070 and mean is calculated as 21.40. s
Calculation of Standard deviation:
This is a measure of dispersion of variables and data and its distraction form the mean
value. This give direct information about the variation of the group data front the mean value of
the group variables.
Paraphrase This Document
Need a fresh take? Get an instant paraphrase of this document with our AI Paraphraser
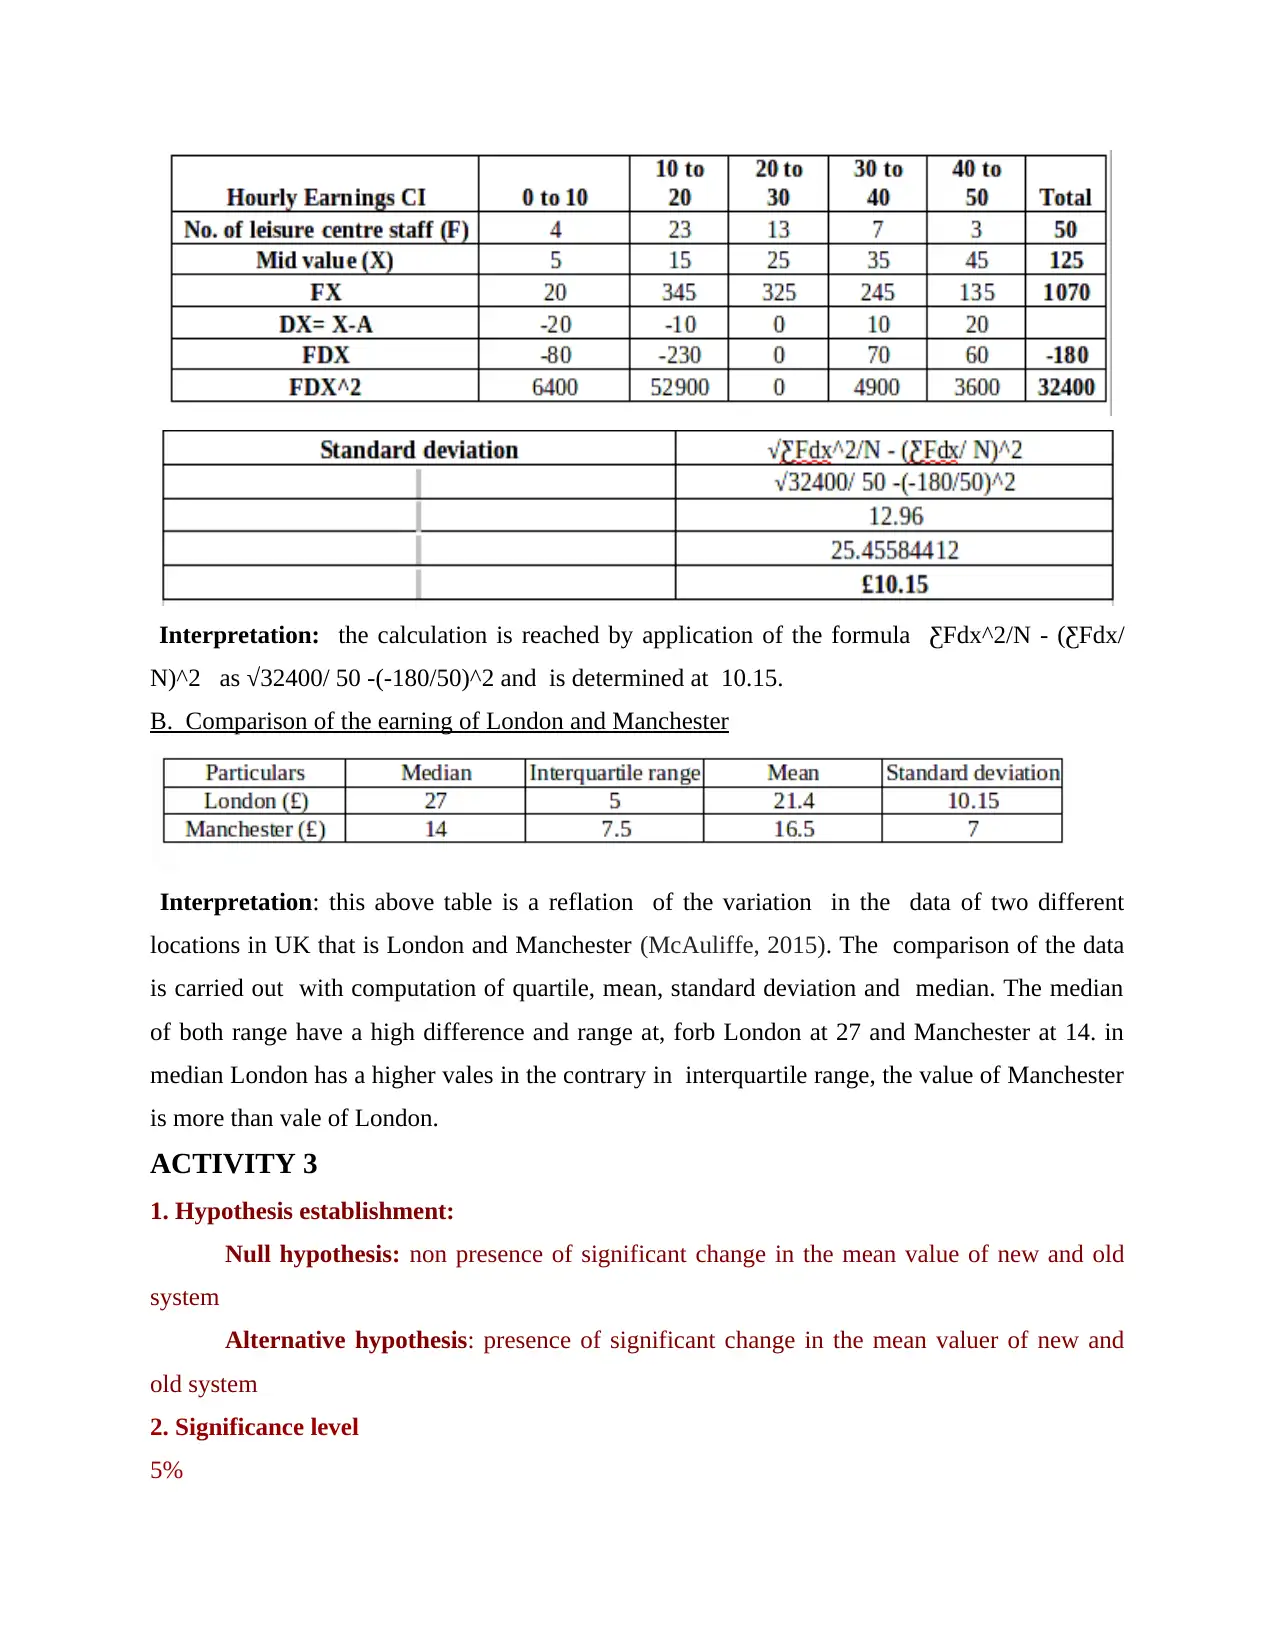
Interpretation: the calculation is reached by application of the formula ƸFdx^2/N - (ƸFdx/
N)^2 as √32400/ 50 -(-180/50)^2 and is determined at 10.15.
B. Comparison of the earning of London and Manchester
Interpretation: this above table is a reflation of the variation in the data of two different
locations in UK that is London and Manchester (McAuliffe, 2015). The comparison of the data
is carried out with computation of quartile, mean, standard deviation and median. The median
of both range have a high difference and range at, forb London at 27 and Manchester at 14. in
median London has a higher vales in the contrary in interquartile range, the value of Manchester
is more than vale of London.
ACTIVITY 3
1. Hypothesis establishment:
Null hypothesis: non presence of significant change in the mean value of new and old
system
Alternative hypothesis: presence of significant change in the mean valuer of new and
old system
2. Significance level
5%
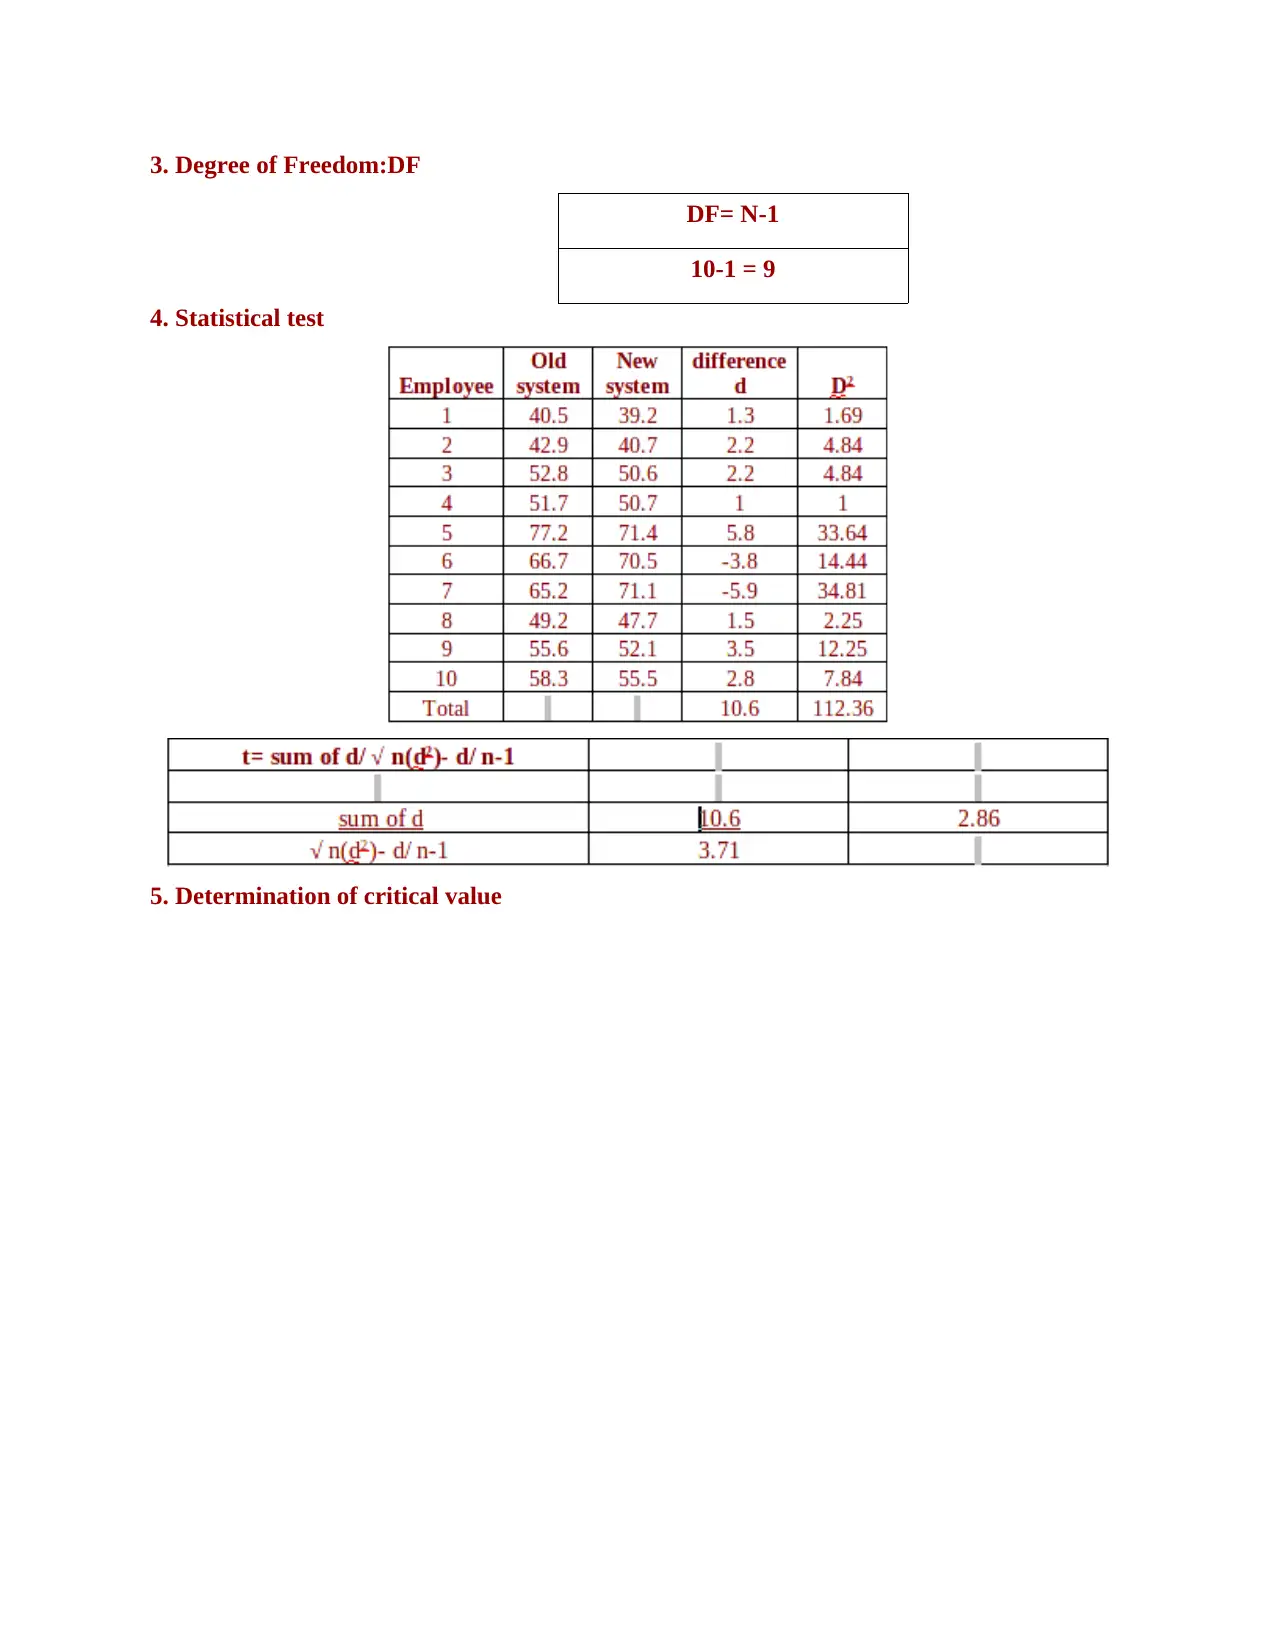
3. Degree of Freedom:DF
DF= N-1
10-1 = 9
4. Statistical test
5. Determination of critical value
DF= N-1
10-1 = 9
4. Statistical test
5. Determination of critical value
⊘ This is a preview!⊘
Do you want full access?
Subscribe today to unlock all pages.
Trusted by 1+ million students worldwide
1 out of 17
Related Documents


Your All-in-One AI-Powered Toolkit for Academic Success.
+13062052269
info@desklib.com
Available 24*7 on WhatsApp / Email
![[object Object]](/_next/static/media/star-bottom.7253800d.svg)
Unlock your academic potential
Copyright © 2020–2026 A2Z Services. All Rights Reserved. Developed and managed by ZUCOL.