Managerial Accounting Report: A Financial Analysis of Rio & Anglo
VerifiedAdded on 2023/06/17
|26
|4593
|157
Report
AI Summary
This report provides a comparative managerial accounting analysis of Rio Tinto and Anglo American, two major players in the mining industry. The analysis utilizes financial ratios, income statements, balance sheets, and cash flow statements to assess the companies' performance in 2019 and 2020. Key ratios such as current ratio, quick ratio, net profit margin, gross profit margin, gearing ratio, return on capital employed, price-earnings ratio, dividend payout ratio, and earnings per share are calculated and interpreted. The report concludes by comparing the financial strengths and weaknesses of both companies, highlighting Rio Tinto's stronger profitability and overall performance in the mining sector, while also pointing out areas where both companies could improve their financial management. The data suggests Rio Tinto has demonstrated superior financial performance and strategic execution compared to Anglo American during the analyzed period.

Managerial Accounting
Paraphrase This Document
Need a fresh take? Get an instant paraphrase of this document with our AI Paraphraser

Contents
INTRODUCTION...........................................................................................................................................3
MAIN BODY.................................................................................................................................................3
Overview of company..............................................................................................................................3
Ratio analysis of Rio Tinto and Anglo American.......................................................................................4
Income statement.................................................................................................................................13
Balance sheet........................................................................................................................................14
Comparison on basis of profit................................................................................................................16
Diversification opportunities for Anglo and Rio.....................................................................................16
CONCLUSION.............................................................................................................................................17
REFERENCES..............................................................................................................................................18
APPENDIX..................................................................................................................................................20
⊘ This is a preview!⊘
Do you want full access?
Subscribe today to unlock all pages.
Trusted by 1+ million students worldwide
INTRODUCTION
Managerial accounting is the act of obtaining, collecting, understanding, and delivering guidance
to stakeholders in order to assist them in making choices inside an organisation and achieving
corporate objectives. The information gathered covers all areas of accountancy that tell the
effective management processes about the expenses of items or services acquired by the
organisation. Budgets are used by budget holders to evaluate the business' operational plan.
Managerial accounting is especially useful in strongly efficient and dynamic company contexts
where immediate choices must be addressed (Poorhassan, 2020). Certain considerations might be
related to a business strategy, financing, or cash flow analysis. Managerial accounting will utilize
performance data to promptly assess the issue. The idea would be to use the budgeting to assist
create smaller operations choices that will improve the organisation boost its operational
effectiveness.
This report based on the two companies which are related to same sectors such as, Anglo
American and Rio Tinto. In this report analysis both company performance by different financial
techniques. For this require to calculate financial ratios which are presented actual performance
of the business and analysis income statement, cash flow statement and balance sheet both
companies. At the end concluded that which company is best in mining sector and run their
business activities in proper manner (Janie and et.al, 2020).
MAIN BODY
Overview of company
Rio Tinto is an Anglo-Australian multinational business that produces iron ore, copper,
diamonds, gold, and uranium. It is the country's second commodities and mining firm, trailing
only BHP. The corporation was created in 1873, when an international coalition of businessmen
acquired from the Spanish government a mine facility on the Rio Tinto in Huelva, Spain. Rio
Anglo American plc is a global mining business headquartered in London, England. It is
the biggest producer of platinum, accounting for almost 40% of world exports, and also a
significant supplier of diamonds, copper, nickel, iron ore, and metallurgy and thermal coal.
Anglo American is a component of the FTSE 100 Index and has its principal listed on the
Paraphrase This Document
Need a fresh take? Get an instant paraphrase of this document with our AI Paraphraser
London Stock. The Johannesburg Stock Exchange has a notable influence for the corporation
(Korhonen and et.al, 2020).
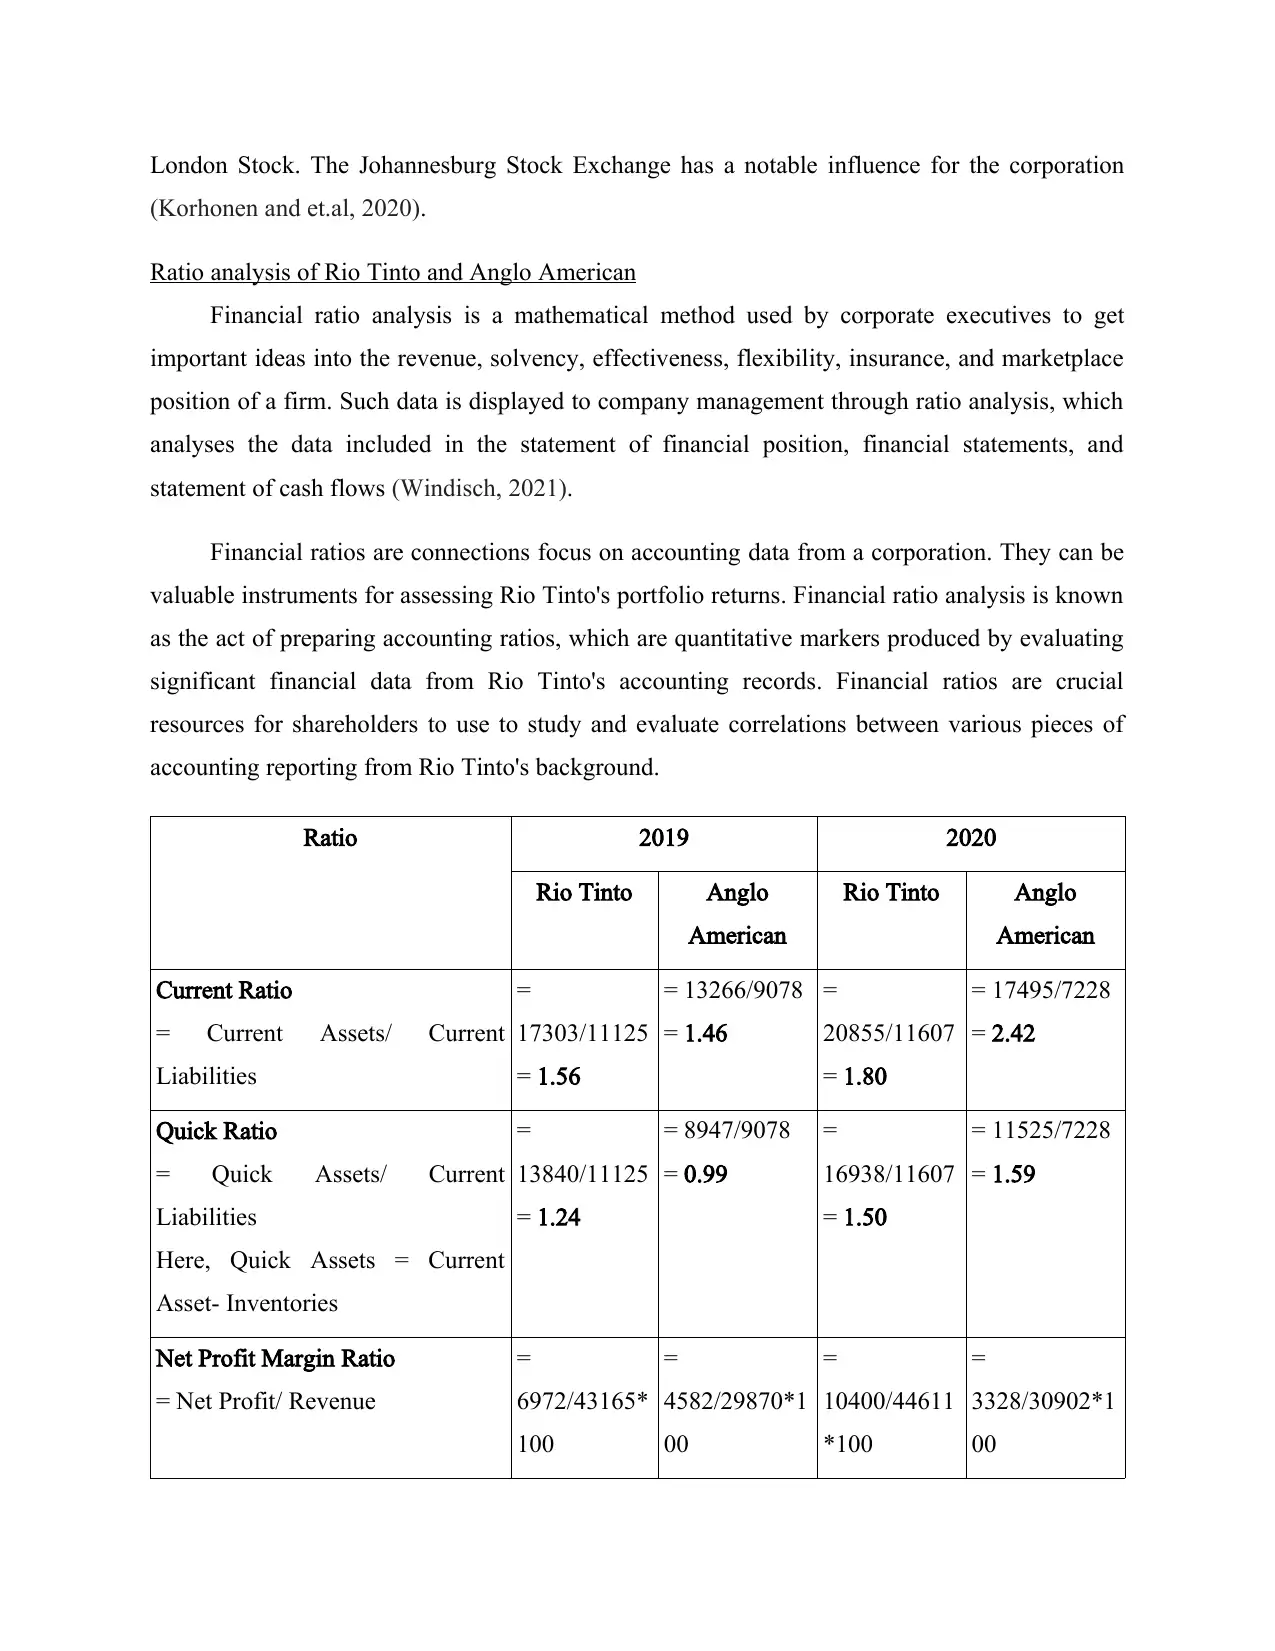
Ratio analysis of Rio Tinto and Anglo American
Financial ratio analysis is a mathematical method used by corporate executives to get
important ideas into the revenue, solvency, effectiveness, flexibility, insurance, and marketplace
position of a firm. Such data is displayed to company management through ratio analysis, which
analyses the data included in the statement of financial position, financial statements, and
statement of cash flows (Windisch, 2021).
Financial ratios are connections focus on accounting data from a corporation. They can be
valuable instruments for assessing Rio Tinto's portfolio returns. Financial ratio analysis is known
as the act of preparing accounting ratios, which are quantitative markers produced by evaluating
significant financial data from Rio Tinto's accounting records. Financial ratios are crucial
resources for shareholders to use to study and evaluate correlations between various pieces of
accounting reporting from Rio Tinto's background.
Ratio 2019 2020
Rio Tinto Anglo
American
Rio Tinto Anglo
American
Current Ratio
= Current Assets/ Current
Liabilities
=
17303/11125
= 1.56
= 13266/9078
= 1.46
=
20855/11607
= 1.80
= 17495/7228
= 2.42
Quick Ratio
= Quick Assets/ Current
Liabilities
Here, Quick Assets = Current
Asset- Inventories
=
13840/11125
= 1.24
= 8947/9078
= 0.99
=
16938/11607
= 1.50
= 11525/7228
= 1.59
Net Profit Margin Ratio
= Net Profit/ Revenue
=
6972/43165*
100
=
4582/29870*1
00
=
10400/44611
*100
=
3328/30902*1
00
(Korhonen and et.al, 2020).
Ratio analysis of Rio Tinto and Anglo American
Financial ratio analysis is a mathematical method used by corporate executives to get
important ideas into the revenue, solvency, effectiveness, flexibility, insurance, and marketplace
position of a firm. Such data is displayed to company management through ratio analysis, which
analyses the data included in the statement of financial position, financial statements, and
statement of cash flows (Windisch, 2021).
Financial ratios are connections focus on accounting data from a corporation. They can be
valuable instruments for assessing Rio Tinto's portfolio returns. Financial ratio analysis is known
as the act of preparing accounting ratios, which are quantitative markers produced by evaluating
significant financial data from Rio Tinto's accounting records. Financial ratios are crucial
resources for shareholders to use to study and evaluate correlations between various pieces of
accounting reporting from Rio Tinto's background.
Ratio 2019 2020
Rio Tinto Anglo
American
Rio Tinto Anglo
American
Current Ratio
= Current Assets/ Current
Liabilities
=
17303/11125
= 1.56
= 13266/9078
= 1.46
=
20855/11607
= 1.80
= 17495/7228
= 2.42
Quick Ratio
= Quick Assets/ Current
Liabilities
Here, Quick Assets = Current
Asset- Inventories
=
13840/11125
= 1.24
= 8947/9078
= 0.99
=
16938/11607
= 1.50
= 11525/7228
= 1.59
Net Profit Margin Ratio
= Net Profit/ Revenue
=
6972/43165*
100
=
4582/29870*1
00
=
10400/44611
*100
=
3328/30902*1
00
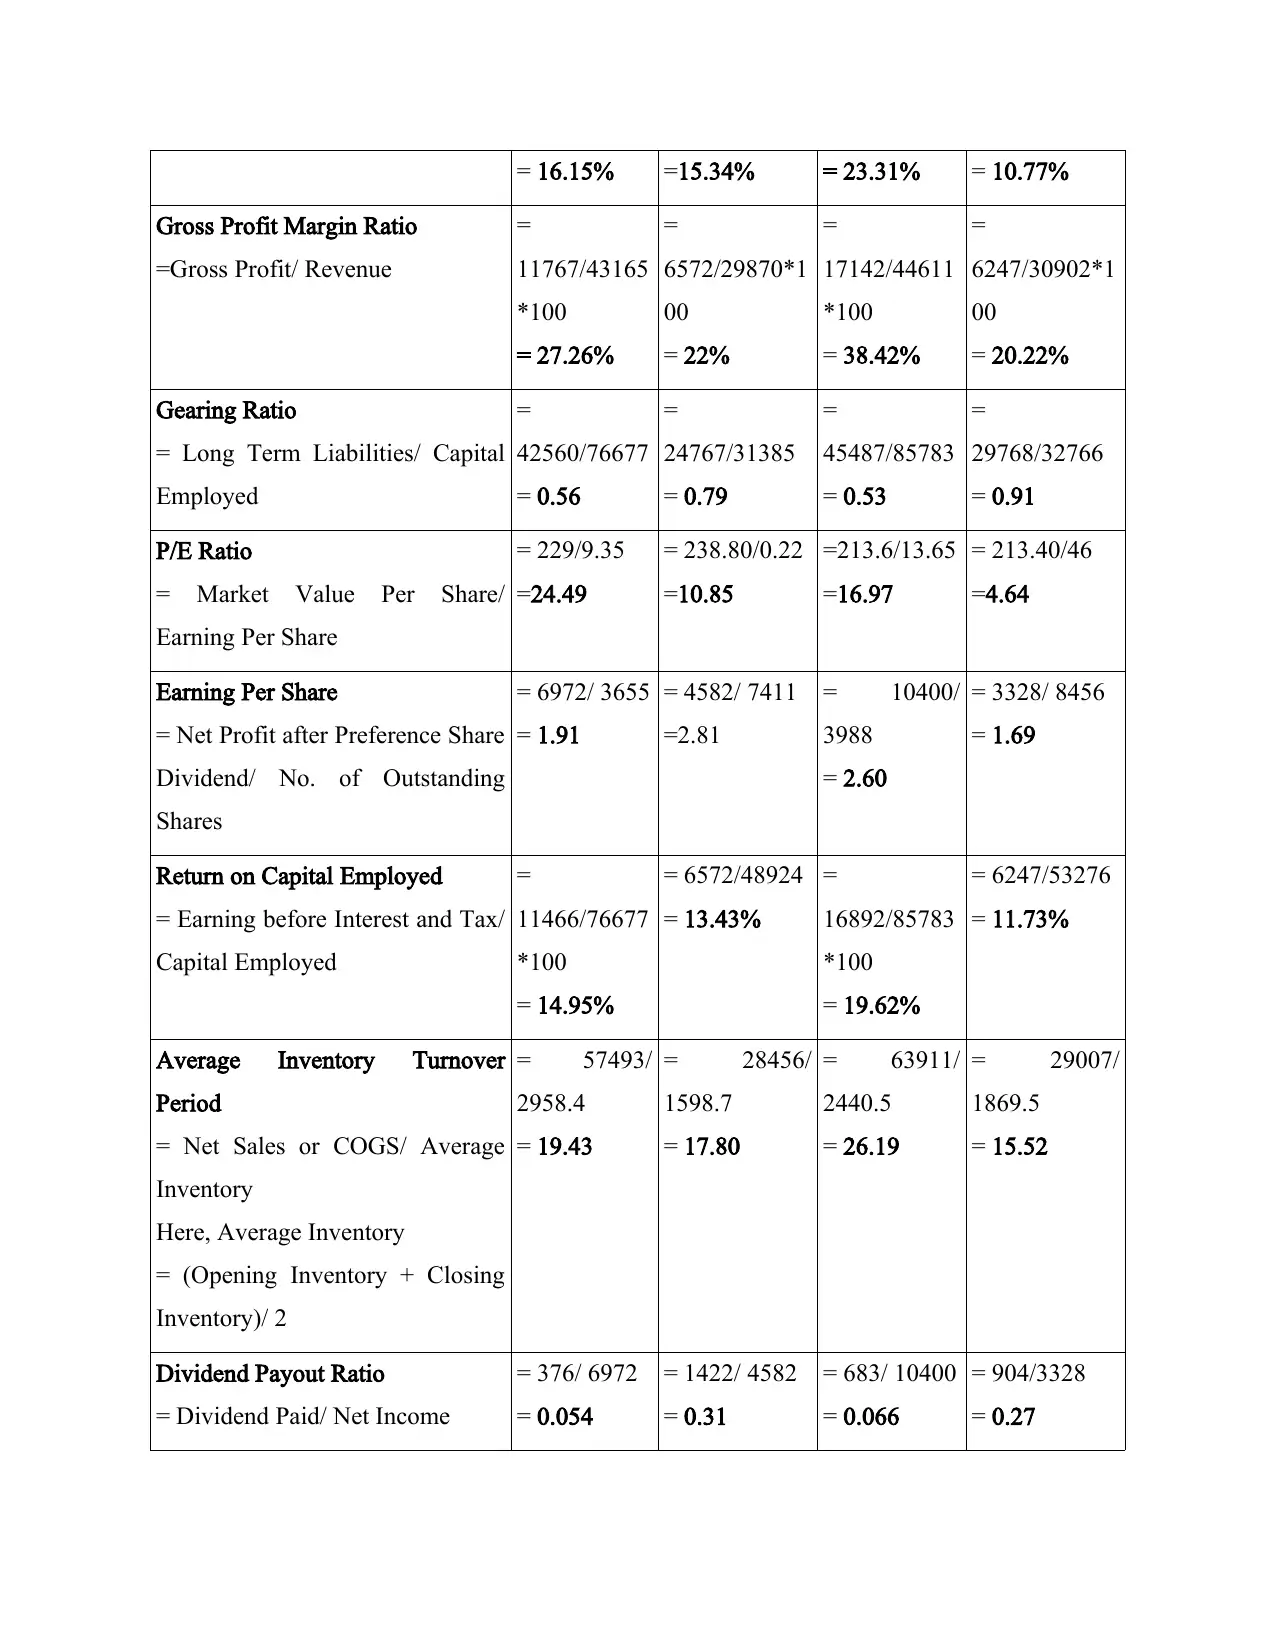
= 16.15% =15.34% = 23.31% = 10.77%
Gross Profit Margin Ratio
=Gross Profit/ Revenue
=
11767/43165
*100
= 27.26%
=
6572/29870*1
00
= 22%
=
17142/44611
*100
= 38.42%
=
6247/30902*1
00
= 20.22%
Gearing Ratio
= Long Term Liabilities/ Capital
Employed
=
42560/76677
= 0.56
=
24767/31385
= 0.79
=
45487/85783
= 0.53
=
29768/32766
= 0.91
P/E Ratio
= Market Value Per Share/
Earning Per Share
= 229/9.35
=24.49
= 238.80/0.22
=10.85
=213.6/13.65
=16.97
= 213.40/46
=4.64
Earning Per Share
= Net Profit after Preference Share
Dividend/ No. of Outstanding
Shares
= 6972/ 3655
= 1.91
= 4582/ 7411
=2.81
= 10400/
3988
= 2.60
= 3328/ 8456
= 1.69
Return on Capital Employed
= Earning before Interest and Tax/
Capital Employed
=
11466/76677
*100
= 14.95%
= 6572/48924
= 13.43%
=
16892/85783
*100
= 19.62%
= 6247/53276
= 11.73%
Average Inventory Turnover
Period
= Net Sales or COGS/ Average
Inventory
Here, Average Inventory
= (Opening Inventory + Closing
Inventory)/ 2
= 57493/
2958.4
= 19.43
= 28456/
1598.7
= 17.80
= 63911/
2440.5
= 26.19
= 29007/
1869.5
= 15.52
Dividend Payout Ratio
= Dividend Paid/ Net Income
= 376/ 6972
= 0.054
= 1422/ 4582
= 0.31
= 683/ 10400
= 0.066
= 904/3328
= 0.27
⊘ This is a preview!⊘
Do you want full access?
Subscribe today to unlock all pages.
Trusted by 1+ million students worldwide
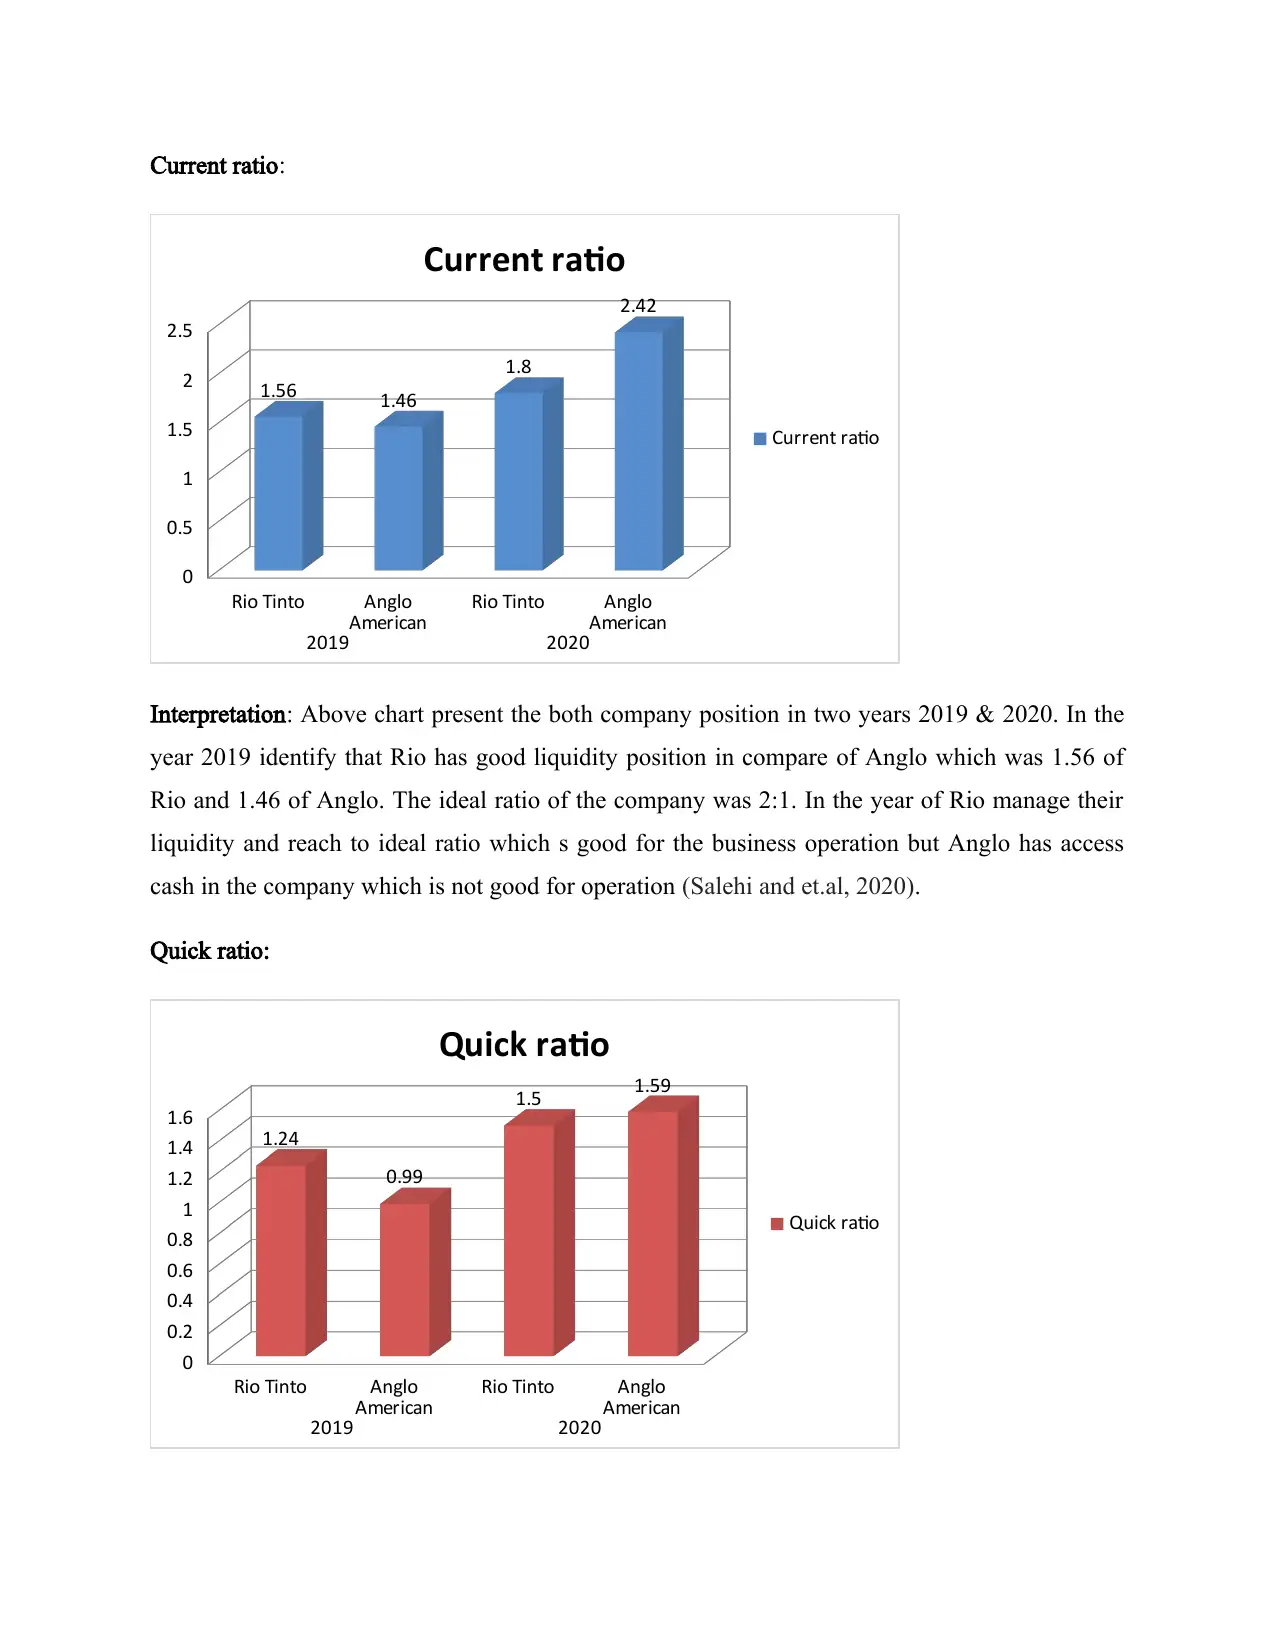
Current ratio:
Rio Tinto Anglo
American Rio Tinto Anglo
American
2019 2020
0
0.5
1
1.5
2
2.5
1.56 1.46
1.8
2.42
Current ratio
Current ratio
Interpretation: Above chart present the both company position in two years 2019 & 2020. In the
year 2019 identify that Rio has good liquidity position in compare of Anglo which was 1.56 of
Rio and 1.46 of Anglo. The ideal ratio of the company was 2:1. In the year of Rio manage their
liquidity and reach to ideal ratio which s good for the business operation but Anglo has access
cash in the company which is not good for operation (Salehi and et.al, 2020).
Quick ratio:
Rio Tinto Anglo
American Rio Tinto Anglo
American
2019 2020
0
0.2
0.4
0.6
0.8
1
1.2
1.4
1.6
1.24
0.99
1.5 1.59
Quick ratio
Quick ratio
Rio Tinto Anglo
American Rio Tinto Anglo
American
2019 2020
0
0.5
1
1.5
2
2.5
1.56 1.46
1.8
2.42
Current ratio
Current ratio
Interpretation: Above chart present the both company position in two years 2019 & 2020. In the
year 2019 identify that Rio has good liquidity position in compare of Anglo which was 1.56 of
Rio and 1.46 of Anglo. The ideal ratio of the company was 2:1. In the year of Rio manage their
liquidity and reach to ideal ratio which s good for the business operation but Anglo has access
cash in the company which is not good for operation (Salehi and et.al, 2020).
Quick ratio:
Rio Tinto Anglo
American Rio Tinto Anglo
American
2019 2020
0
0.2
0.4
0.6
0.8
1
1.2
1.4
1.6
1.24
0.99
1.5 1.59
Quick ratio
Quick ratio
Paraphrase This Document
Need a fresh take? Get an instant paraphrase of this document with our AI Paraphraser
Interpretation: As per the above chart it has been analyzed that in the year of 2019 Rio has more
liquidity compare of Anglo. The ideal ratio is 1:1 which Anglo American 0.99 is but Rio has
1.24 which is not good. On the other side in the year of 2020, 1.5 quick ratios of Rio which is
more than ideal ratio and this ratio presents that company has access liquidity in the company.
Anglo has 1.59 in 2020 which is not presenting good liquidity position so it is suggested to both
companies to control liquidity in company and prepare effective strategies (Huber and et.al,
2020).
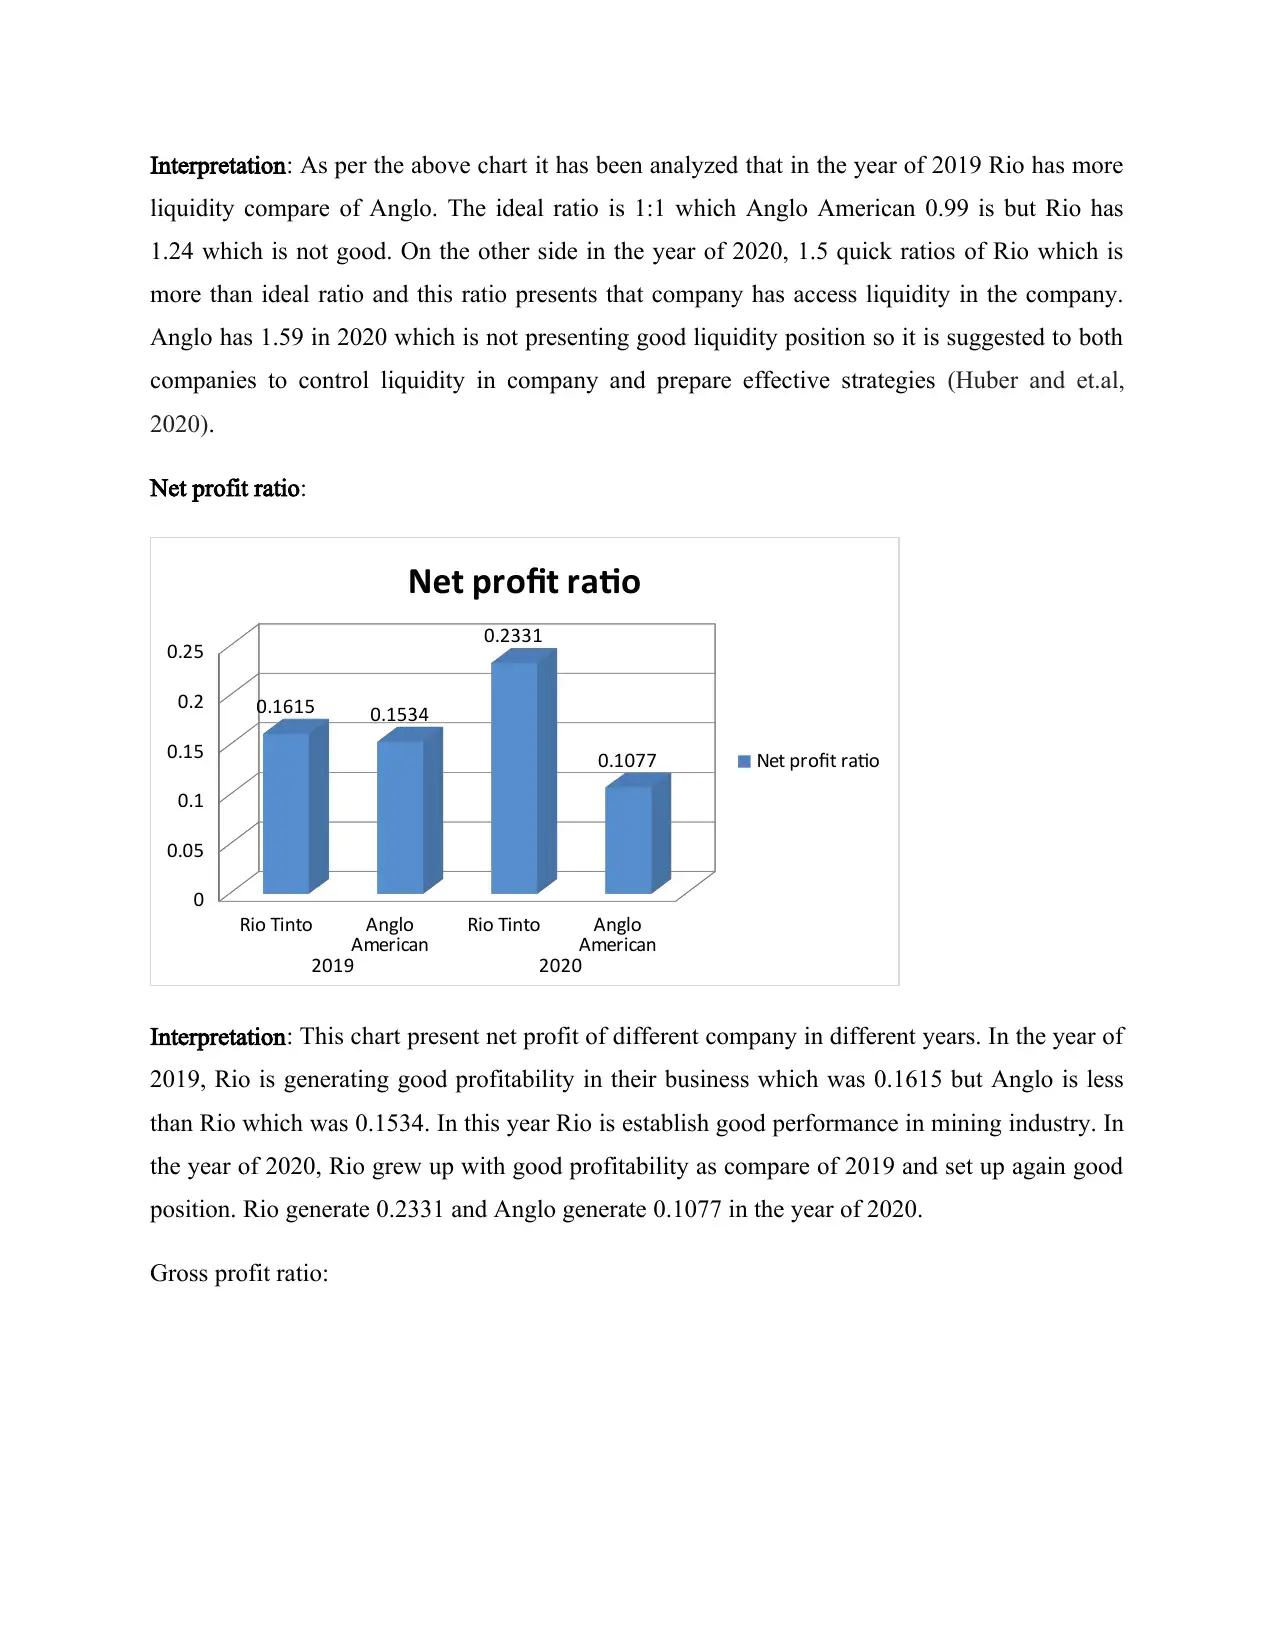
Net profit ratio:
Rio Tinto Anglo
American Rio Tinto Anglo
American
2019 2020
0
0.05
0.1
0.15
0.2
0.25
0.1615 0.1534
0.2331
0.1077
Net profit ratio
Net profit ratio
Interpretation: This chart present net profit of different company in different years. In the year of
2019, Rio is generating good profitability in their business which was 0.1615 but Anglo is less
than Rio which was 0.1534. In this year Rio is establish good performance in mining industry. In
the year of 2020, Rio grew up with good profitability as compare of 2019 and set up again good
position. Rio generate 0.2331 and Anglo generate 0.1077 in the year of 2020.
Gross profit ratio:
liquidity compare of Anglo. The ideal ratio is 1:1 which Anglo American 0.99 is but Rio has
1.24 which is not good. On the other side in the year of 2020, 1.5 quick ratios of Rio which is
more than ideal ratio and this ratio presents that company has access liquidity in the company.
Anglo has 1.59 in 2020 which is not presenting good liquidity position so it is suggested to both
companies to control liquidity in company and prepare effective strategies (Huber and et.al,
2020).
Net profit ratio:
Rio Tinto Anglo
American Rio Tinto Anglo
American
2019 2020
0
0.05
0.1
0.15
0.2
0.25
0.1615 0.1534
0.2331
0.1077
Net profit ratio
Net profit ratio
Interpretation: This chart present net profit of different company in different years. In the year of
2019, Rio is generating good profitability in their business which was 0.1615 but Anglo is less
than Rio which was 0.1534. In this year Rio is establish good performance in mining industry. In
the year of 2020, Rio grew up with good profitability as compare of 2019 and set up again good
position. Rio generate 0.2331 and Anglo generate 0.1077 in the year of 2020.
Gross profit ratio:
Rio Tinto Anglo
American Rio Tinto Anglo
American
2019 2020
0
0.05
0.1
0.15
0.2
0.25
0.3
0.35
0.4
0.2726
0.22
0.3842
0.2022
Gross profit ratio
Gross profit ratio
Interpretation: This chart presents that gross profit ratio presents the company performance. In
the year of 2019, Rio generates 0.2726 profits as compare of Anglo which was 0.22. On the other
side in the year of 2020, Rio generates 0.3842 and Anglo generates 0.2022 after the facing
pandemic situation. On the basis of both years it is compare that Rio has good position in mining
industry and run their business in smooth manner and apply all effective strategies (Taschner and
Charifzadeh, 2020).
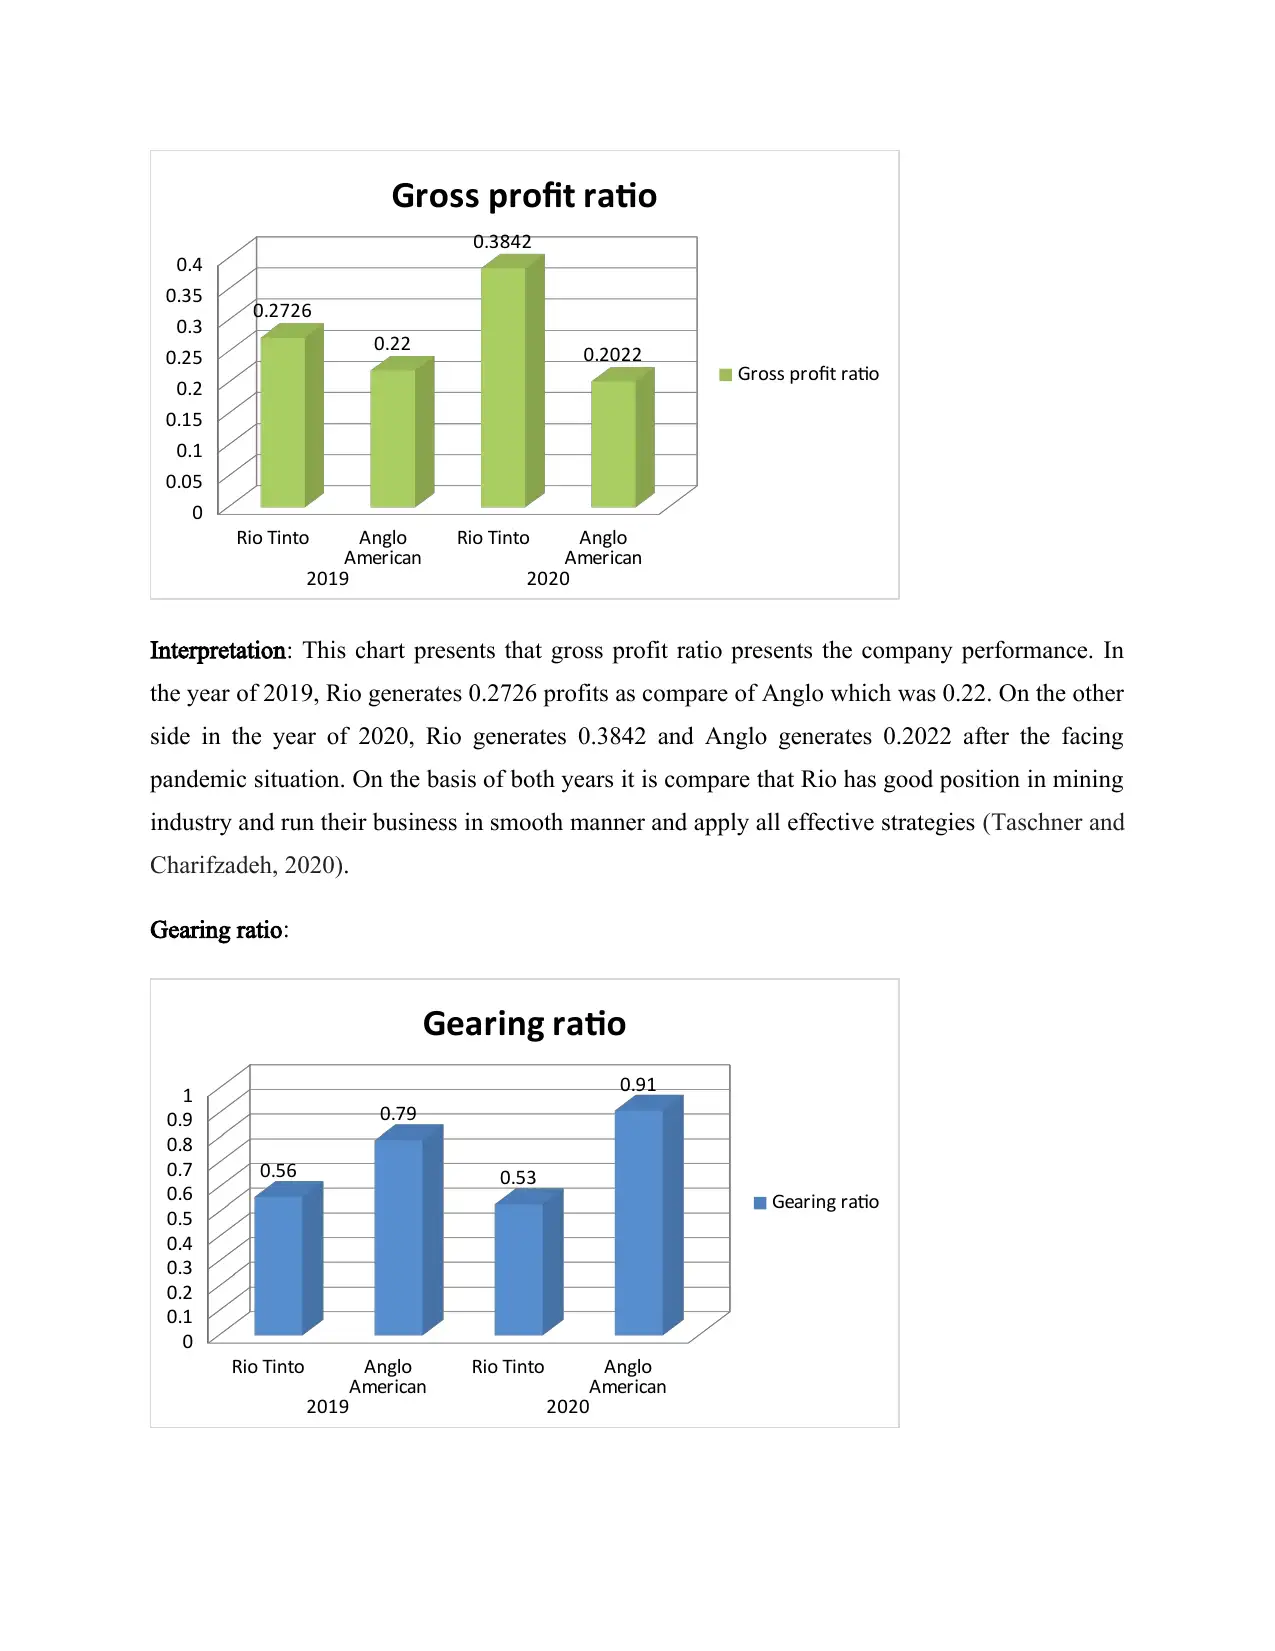
Gearing ratio:
Rio Tinto Anglo
American Rio Tinto Anglo
American
2019 2020
0
0.1
0.2
0.3
0.4
0.5
0.6
0.7
0.8
0.9
1
0.56
0.79
0.53
0.91
Gearing ratio
Gearing ratio
American Rio Tinto Anglo
American
2019 2020
0
0.05
0.1
0.15
0.2
0.25
0.3
0.35
0.4
0.2726
0.22
0.3842
0.2022
Gross profit ratio
Gross profit ratio
Interpretation: This chart presents that gross profit ratio presents the company performance. In
the year of 2019, Rio generates 0.2726 profits as compare of Anglo which was 0.22. On the other
side in the year of 2020, Rio generates 0.3842 and Anglo generates 0.2022 after the facing
pandemic situation. On the basis of both years it is compare that Rio has good position in mining
industry and run their business in smooth manner and apply all effective strategies (Taschner and
Charifzadeh, 2020).
Gearing ratio:
Rio Tinto Anglo
American Rio Tinto Anglo
American
2019 2020
0
0.1
0.2
0.3
0.4
0.5
0.6
0.7
0.8
0.9
1
0.56
0.79
0.53
0.91
Gearing ratio
Gearing ratio
⊘ This is a preview!⊘
Do you want full access?
Subscribe today to unlock all pages.
Trusted by 1+ million students worldwide
Interpretation: It is investment based ratio that helps investors to take decision for investment.
On the basis of this ratio they are taking decision to in different companies (Hidayat, 2020). A
per the above chart it is analyzing tat in the year of 2019, Rio generate 0.56 and Anglo earn 0.79.
It means a gearing ratio more than 50% is usually regarded substantially robust and durable or
graded. A gearing ratio of less than 25% is often seen as reduced by both shareholders and
creditors. For very well businesses, a gearing ratio of 25 to 50 percent is particularly suited or
standard. In the year of 2020, Rio earns 0.53 and Anglo 0.91 so need to control by both
companies to their leveraging activities specially suggested to Anglo American.
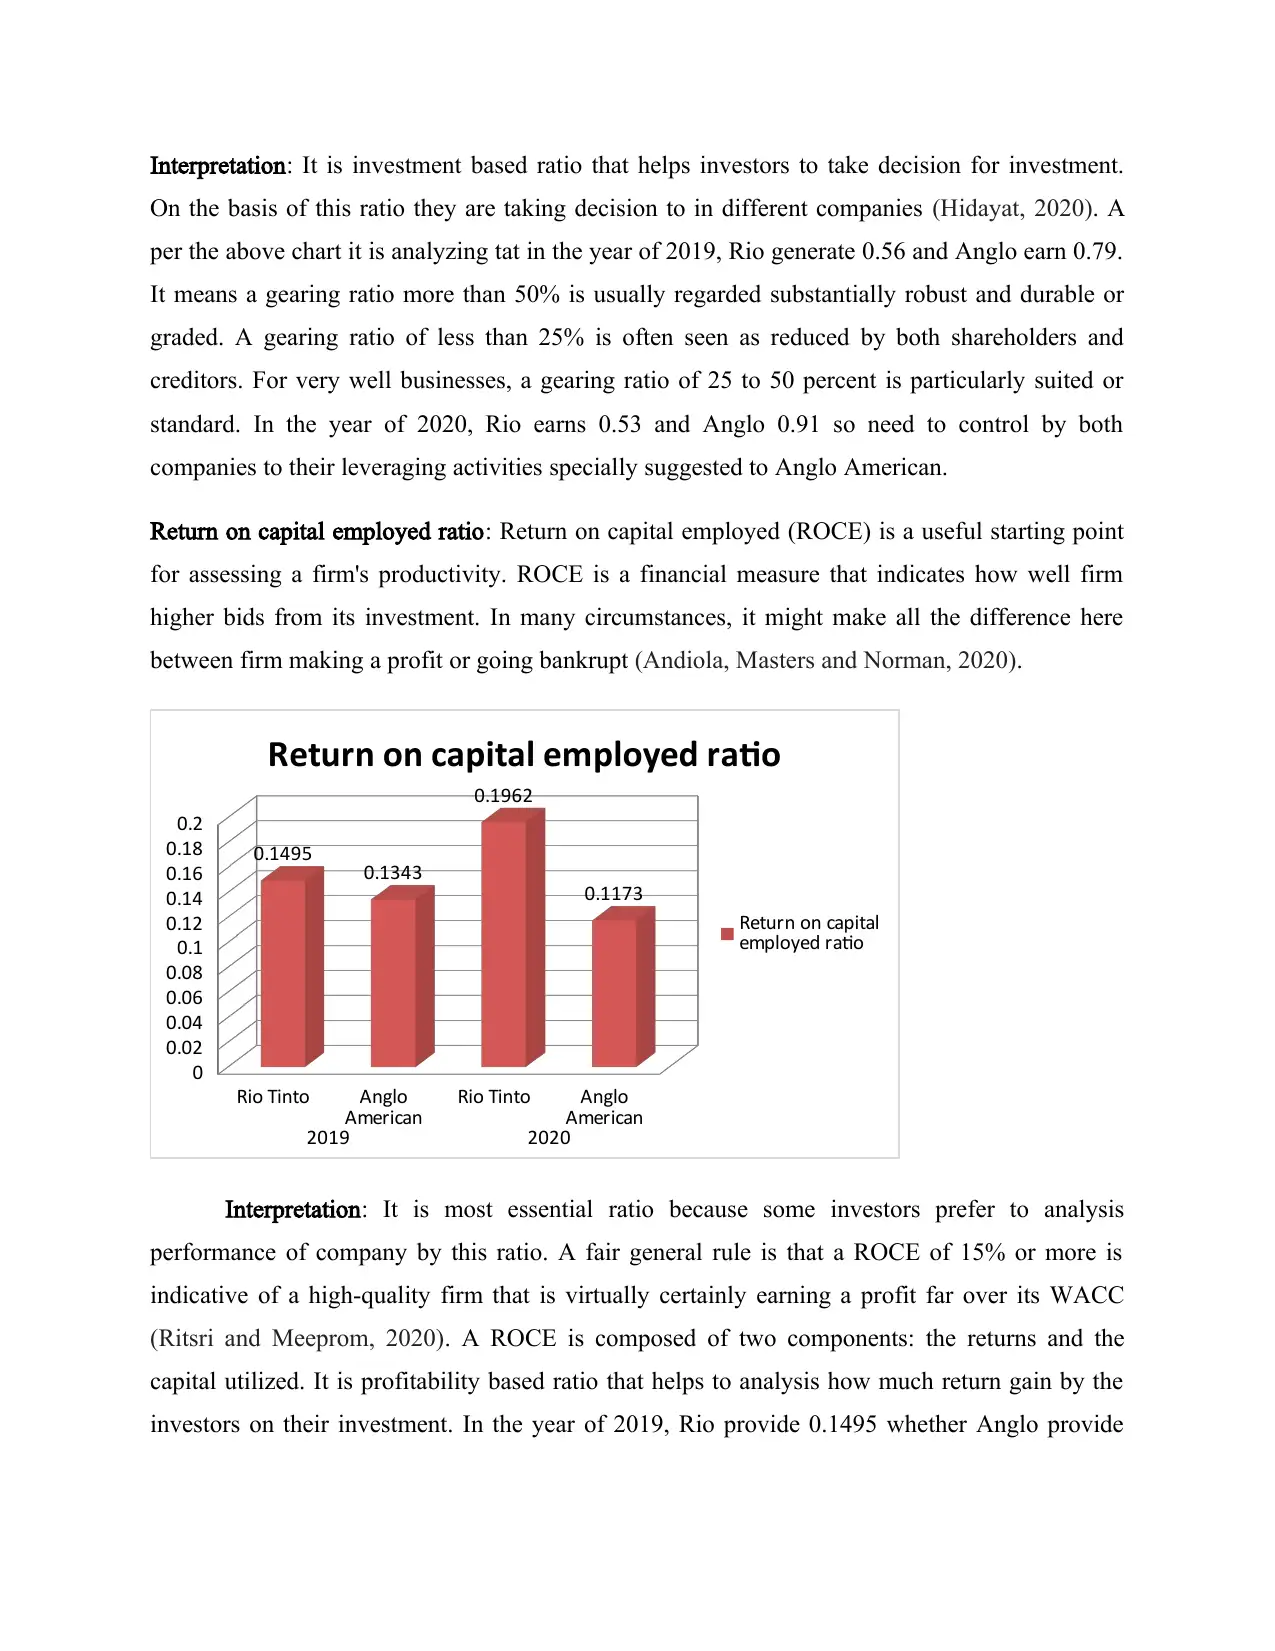
Return on capital employed ratio: Return on capital employed (ROCE) is a useful starting point
for assessing a firm's productivity. ROCE is a financial measure that indicates how well firm
higher bids from its investment. In many circumstances, it might make all the difference here
between firm making a profit or going bankrupt (Andiola, Masters and Norman, 2020).
Rio Tinto Anglo
American Rio Tinto Anglo
American
2019 2020
0
0.02
0.04
0.06
0.08
0.1
0.12
0.14
0.16
0.18
0.2
0.1495 0.1343
0.1962
0.1173
Return on capital employed ratio
Return on capital
employed ratio
Interpretation: It is most essential ratio because some investors prefer to analysis
performance of company by this ratio. A fair general rule is that a ROCE of 15% or more is
indicative of a high-quality firm that is virtually certainly earning a profit far over its WACC
(Ritsri and Meeprom, 2020). A ROCE is composed of two components: the returns and the
capital utilized. It is profitability based ratio that helps to analysis how much return gain by the
investors on their investment. In the year of 2019, Rio provide 0.1495 whether Anglo provide
On the basis of this ratio they are taking decision to in different companies (Hidayat, 2020). A
per the above chart it is analyzing tat in the year of 2019, Rio generate 0.56 and Anglo earn 0.79.
It means a gearing ratio more than 50% is usually regarded substantially robust and durable or
graded. A gearing ratio of less than 25% is often seen as reduced by both shareholders and
creditors. For very well businesses, a gearing ratio of 25 to 50 percent is particularly suited or
standard. In the year of 2020, Rio earns 0.53 and Anglo 0.91 so need to control by both
companies to their leveraging activities specially suggested to Anglo American.
Return on capital employed ratio: Return on capital employed (ROCE) is a useful starting point
for assessing a firm's productivity. ROCE is a financial measure that indicates how well firm
higher bids from its investment. In many circumstances, it might make all the difference here
between firm making a profit or going bankrupt (Andiola, Masters and Norman, 2020).
Rio Tinto Anglo
American Rio Tinto Anglo
American
2019 2020
0
0.02
0.04
0.06
0.08
0.1
0.12
0.14
0.16
0.18
0.2
0.1495 0.1343
0.1962
0.1173
Return on capital employed ratio
Return on capital
employed ratio
Interpretation: It is most essential ratio because some investors prefer to analysis
performance of company by this ratio. A fair general rule is that a ROCE of 15% or more is
indicative of a high-quality firm that is virtually certainly earning a profit far over its WACC
(Ritsri and Meeprom, 2020). A ROCE is composed of two components: the returns and the
capital utilized. It is profitability based ratio that helps to analysis how much return gain by the
investors on their investment. In the year of 2019, Rio provide 0.1495 whether Anglo provide
Paraphrase This Document
Need a fresh take? Get an instant paraphrase of this document with our AI Paraphraser
0.1343 to their investors. In the year of 2020, 0.1962 by Rio and 0.1173 by Anglo. This, it is
analyzing that Rio provide good return to their shareholders.
Price earnings ratio:
Rio Tinto Anglo
American Rio Tinto Anglo
American
2019 2020
0
5
10
15
20
25
24.49
10.85
16.97
4.64
Price earnings ratio
Price earnings ratio
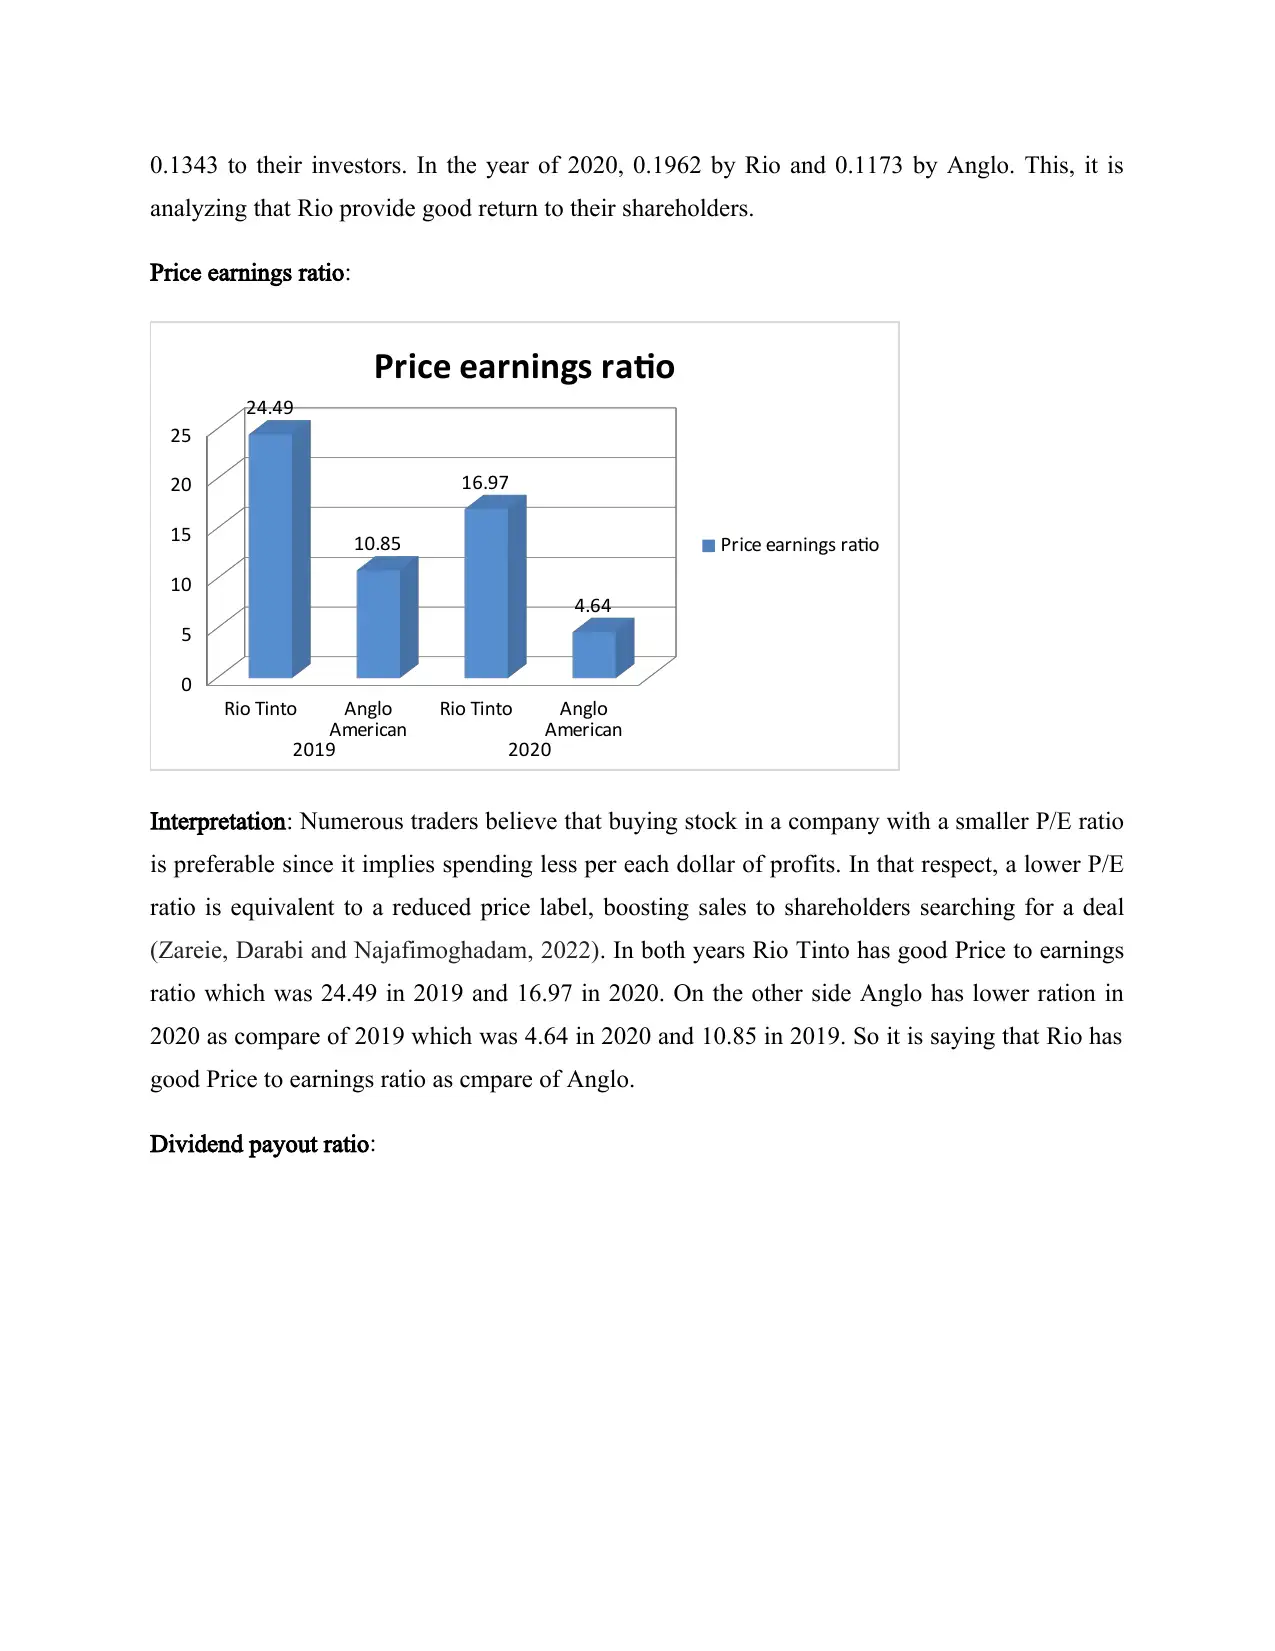
Interpretation: Numerous traders believe that buying stock in a company with a smaller P/E ratio
is preferable since it implies spending less per each dollar of profits. In that respect, a lower P/E
ratio is equivalent to a reduced price label, boosting sales to shareholders searching for a deal
(Zareie, Darabi and Najafimoghadam, 2022). In both years Rio Tinto has good Price to earnings
ratio which was 24.49 in 2019 and 16.97 in 2020. On the other side Anglo has lower ration in
2020 as compare of 2019 which was 4.64 in 2020 and 10.85 in 2019. So it is saying that Rio has
good Price to earnings ratio as cmpare of Anglo.
Dividend payout ratio:
analyzing that Rio provide good return to their shareholders.
Price earnings ratio:
Rio Tinto Anglo
American Rio Tinto Anglo
American
2019 2020
0
5
10
15
20
25
24.49
10.85
16.97
4.64
Price earnings ratio
Price earnings ratio
Interpretation: Numerous traders believe that buying stock in a company with a smaller P/E ratio
is preferable since it implies spending less per each dollar of profits. In that respect, a lower P/E
ratio is equivalent to a reduced price label, boosting sales to shareholders searching for a deal
(Zareie, Darabi and Najafimoghadam, 2022). In both years Rio Tinto has good Price to earnings
ratio which was 24.49 in 2019 and 16.97 in 2020. On the other side Anglo has lower ration in
2020 as compare of 2019 which was 4.64 in 2020 and 10.85 in 2019. So it is saying that Rio has
good Price to earnings ratio as cmpare of Anglo.
Dividend payout ratio:
Rio Tinto Anglo
American Rio Tinto Anglo
American
2019 2020
0
0.05
0.1
0.15
0.2
0.25
0.3
0.35
0.054
0.31
0.066
0.27
Dividend payout ratio
Dividend payout ratio
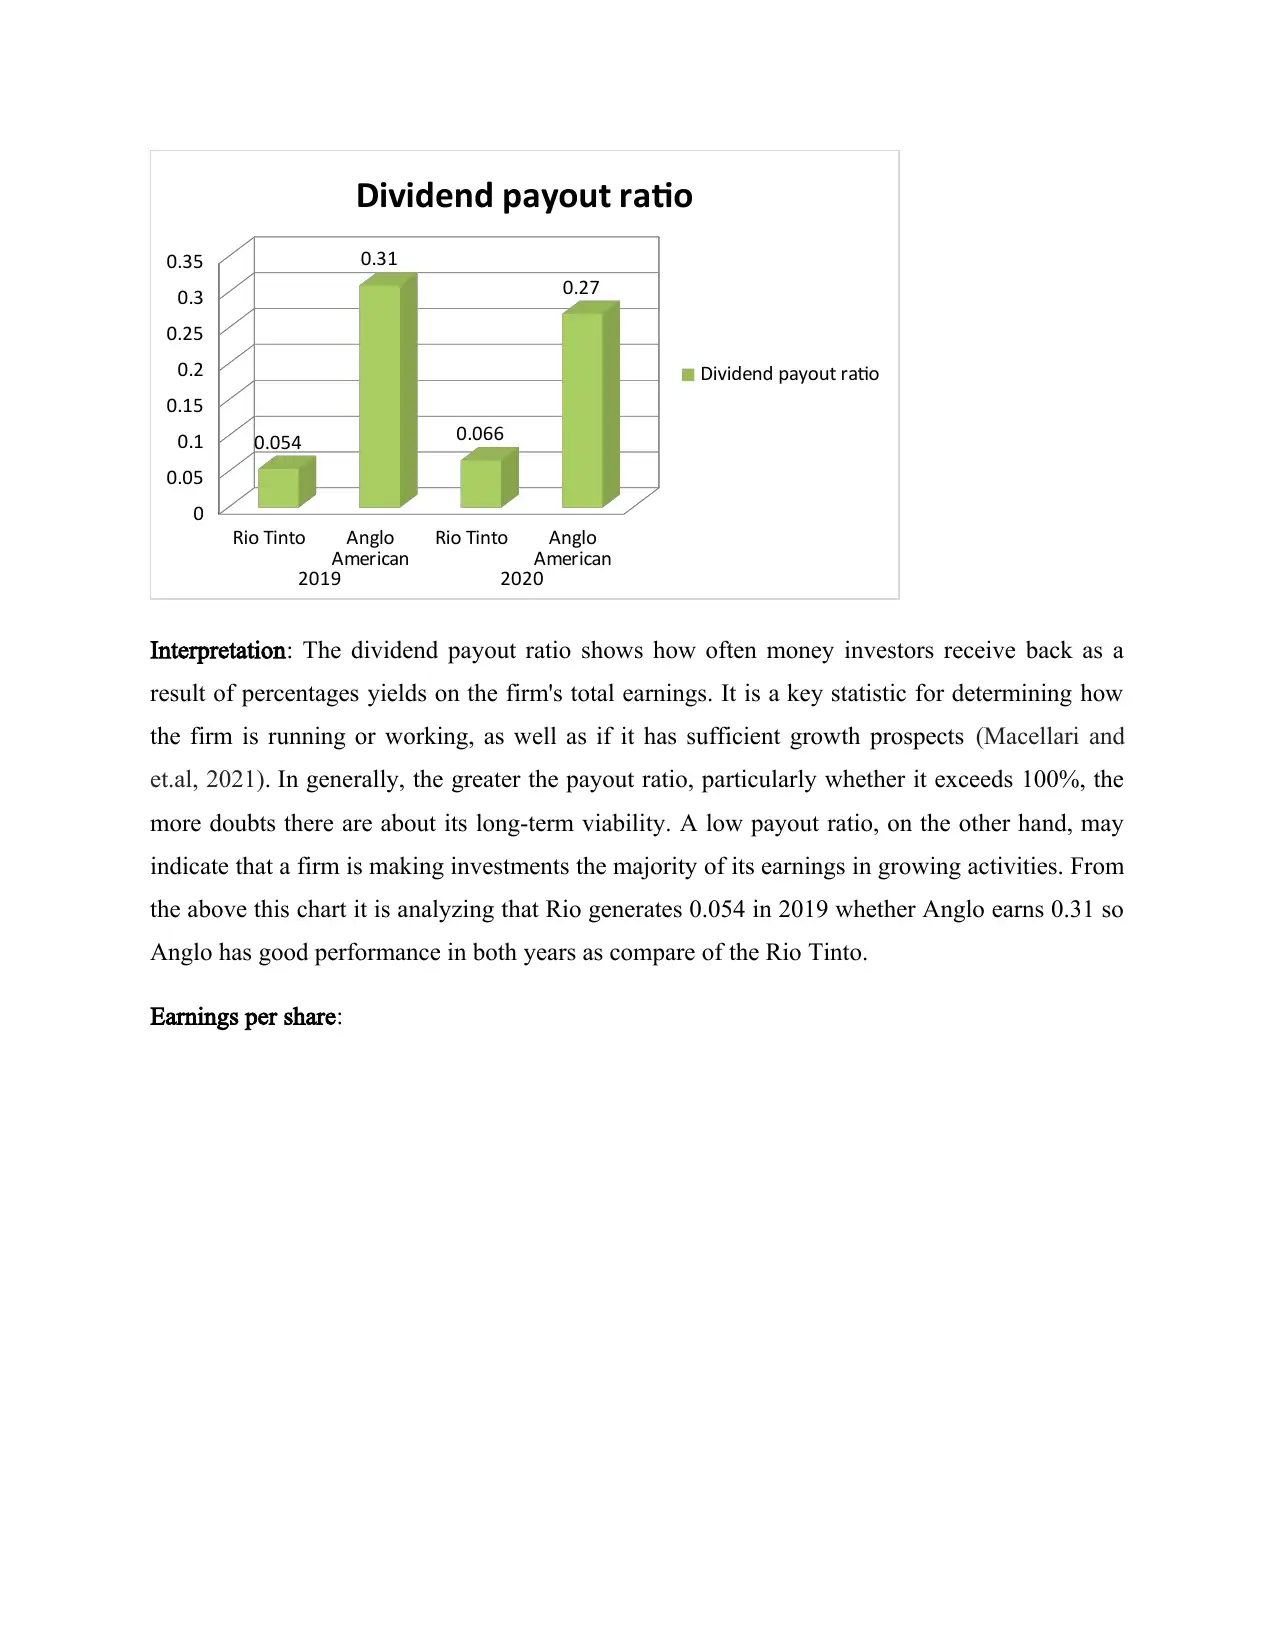
Interpretation: The dividend payout ratio shows how often money investors receive back as a
result of percentages yields on the firm's total earnings. It is a key statistic for determining how
the firm is running or working, as well as if it has sufficient growth prospects (Macellari and
et.al, 2021). In generally, the greater the payout ratio, particularly whether it exceeds 100%, the
more doubts there are about its long-term viability. A low payout ratio, on the other hand, may
indicate that a firm is making investments the majority of its earnings in growing activities. From
the above this chart it is analyzing that Rio generates 0.054 in 2019 whether Anglo earns 0.31 so
Anglo has good performance in both years as compare of the Rio Tinto.
Earnings per share:
American Rio Tinto Anglo
American
2019 2020
0
0.05
0.1
0.15
0.2
0.25
0.3
0.35
0.054
0.31
0.066
0.27
Dividend payout ratio
Dividend payout ratio
Interpretation: The dividend payout ratio shows how often money investors receive back as a
result of percentages yields on the firm's total earnings. It is a key statistic for determining how
the firm is running or working, as well as if it has sufficient growth prospects (Macellari and
et.al, 2021). In generally, the greater the payout ratio, particularly whether it exceeds 100%, the
more doubts there are about its long-term viability. A low payout ratio, on the other hand, may
indicate that a firm is making investments the majority of its earnings in growing activities. From
the above this chart it is analyzing that Rio generates 0.054 in 2019 whether Anglo earns 0.31 so
Anglo has good performance in both years as compare of the Rio Tinto.
Earnings per share:
⊘ This is a preview!⊘
Do you want full access?
Subscribe today to unlock all pages.
Trusted by 1+ million students worldwide
1 out of 26
Related Documents


Your All-in-One AI-Powered Toolkit for Academic Success.
+13062052269
info@desklib.com
Available 24*7 on WhatsApp / Email
![[object Object]](/_next/static/media/star-bottom.7253800d.svg)
Unlock your academic potential
Copyright © 2020–2026 A2Z Services. All Rights Reserved. Developed and managed by ZUCOL.