Managerial Economics Assignment: Demand, Supply, and Pricing

Verified

Added on  2021/11/02

|6
|867
|98
Homework Assignment
AI Summary
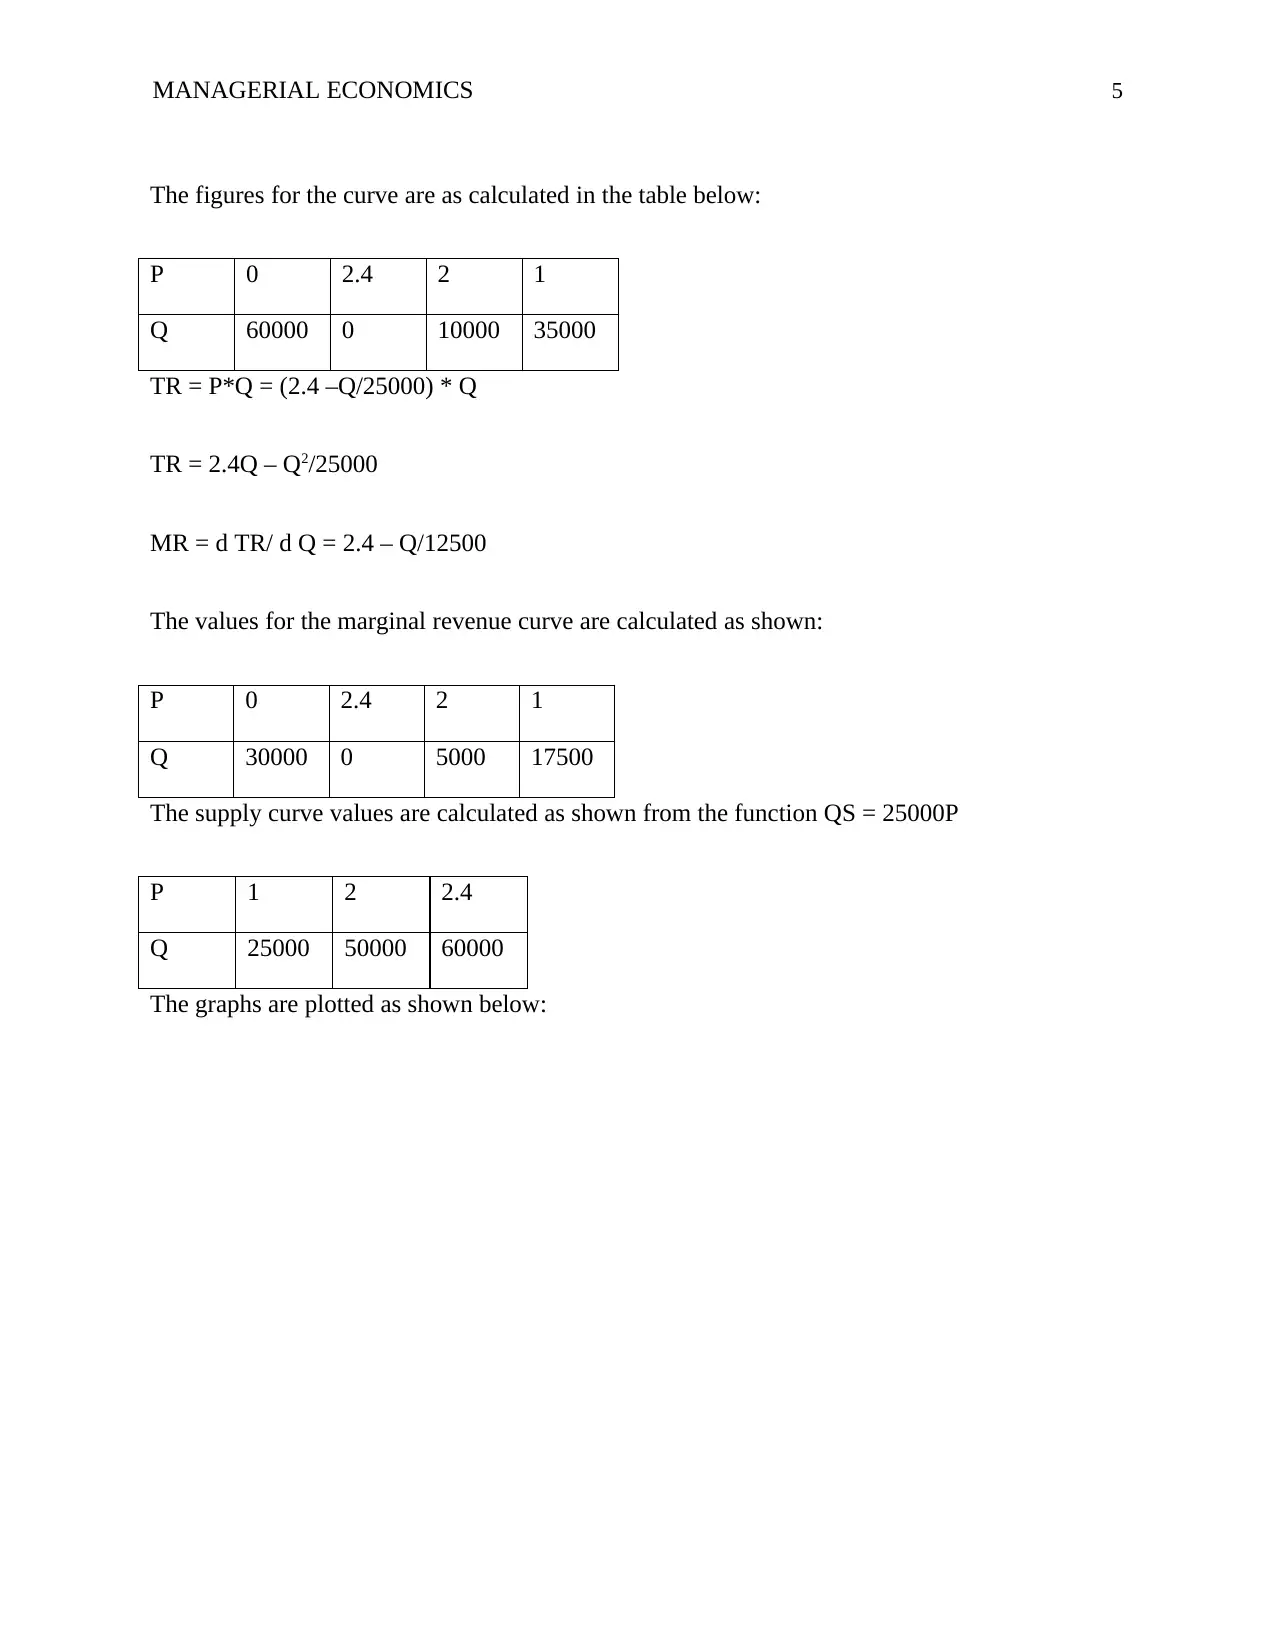
This managerial economics assignment solution analyzes two key problems. The first problem explores a firm's profit maximization in the short run, calculating the demand curve, marginal revenue, and profit earned when the marginal cost equals the marginal revenue. The analysis includes graphical representation of the curves. The second problem examines the equilibrium price and output in a gasoline market with 100 identical self-service stations, modeling demand and supply functions, calculating equilibrium price, and comparing the outcome to a monopoly situation, including a discussion of allocative inefficiency and deadweight loss. The solution includes calculations for various economic concepts and graphical representations of the market scenarios and provides references to support the analysis.
Document Page
MANAGERIAL ECONOMICS 1
MANAGERIAL ECONOMICS
Student Name
Institutional Affiliation
Facilitator
Course
Date
tabler-icon-diamond-filled.svg

Paraphrase This Document

Need a fresh take? Get an instant paraphrase of this document with our AI Paraphraser
Document Page
MANAGERIAL ECONOMICS 2
Question 12
QD = 240 – 20P
QD = Quantity demanded = Q while P = Price
20P = 240 – Q
P = 12 – 1/20Q
From the equation above, the following values in the table have been calculated for the demand
curve:
P 0 12 6 3
Q 240 0 120 180
The marginal revenue is calculated by finding the total revenue derivative
TR = P * Q = (12 – 1/20Q) * Q = 12Q – 1/20Q2
MR = d TR/ d Q = 12 – 2/20Q ; hence the marginal revenue curve is two times steeper the
demand curve
The following values have been calculated for the marginal revenue:
MR 12 0 6 3
Q 0 120 60 90
MC = Change in TC/ Change in quantity produced
ATC = TC/Quantity produced
AVC = VC/Quantity produced
Document Page
MANAGERIAL ECONOMICS 3
Given Q = 80, P = 12 – ((1/20)80) = 8
ATC = 10 and AVC = 6
Firms maximize their profits at a point whereby the marginal cost equals the marginal revenue
(Demsetz 2013, p.375).
Given Q = 80, the marginal revenue is MR = 12 – ((2/20)80) = 4
a. The graph is as shown below:
b. In the short run period, the firm makes profit. The profit made is calculated below:
Profit made = (calculated price at quantity Q which is given as 80 minus the average variable
cost which is 6) * the quantity given which is 80
Document Page
MANAGERIAL ECONOMICS 4
Profit = (P - 6) * Q = (8 - 6) * 80 = $ 160
In the short run period, the firm makes a profit of $ 160 and hence remains in business. Also
many businesses have not yet entered the market and hence the firm remains in the business.
Question 15
Gasoline stations are 100 and are self-service and also identical
Demand function is given as QD = 60000 – 25000P Where QD = quantity demanded and p =
price which is expressed as dollars per gallon
The supply curve is given as QS = 25000p where p > $ 0.6
a. The equilibrium price is calculated as follows:
The equilibrium price refers to the price at a point whereby the quantity demanded and the
quantity supplied are equal (Burdett and Judd 2010, p.955). In other words at equilibrium point,
the quantity demanded and the quantity supplied are equal
Hence QD = QS at equilibrium
This means that 60000 – 25000p = 25000p
But Q = 60000 – 25000p
25000p = 60000 – Q ; p = (60000/25000) – (Q/25000)
Hence P = 2.4 - Q/25000
b. The average revenue function is P = 2.4 – Q/25000
tabler-icon-diamond-filled.svg

Paraphrase This Document

Need a fresh take? Get an instant paraphrase of this document with our AI Paraphraser
Document Page
MANAGERIAL ECONOMICS 5
The figures for the curve are as calculated in the table below:
P 0 2.4 2 1
Q 60000 0 10000 35000
TR = P*Q = (2.4 –Q/25000) * Q
TR = 2.4Q – Q2/25000
MR = d TR/ d Q = 2.4 – Q/12500
The values for the marginal revenue curve are calculated as shown:
P 0 2.4 2 1
Q 30000 0 5000 17500
The supply curve values are calculated as shown from the function QS = 25000P
P 1 2 2.4
Q 25000 50000 60000
The graphs are plotted as shown below:
Document Page
MANAGERIAL ECONOMICS 6
From all the drawn curves, the monopolist’s equilibrium output and price has been shown in the
diagram above, as 19000 and $0.8 respectively. The equilibrium output and price is found at a
point whereby the monopoly obtains the maximum profit, that is, marginal cost and the marginal
revenue are equal.
c. Yes. A monopoly faces allocative inefficiency. This means that the available resources
are underutilized and hence what is produced is less than what is demanded in the market.
This occurs in a monopoly due to the cartel like behavior in order to hike prices and make
more profits by supplying small amounts of commodities in the entire market. Perfect
competition market is more efficient than a monopoly market due to the fact that stiff
competition is involved in the perfect competition. This means that the producers in the
perfect competition market efficiently use the available resources to produce the
chevron_up_icon
1 out of 6
circle_padding
hide_on_mobile
zoom_out_icon