Managerial Economics: Supply, Demand, and Market Interventions
VerifiedAdded on 2023/06/07
|15
|3841
|256
Homework Assignment
AI Summary
This managerial economics assignment delves into core economic principles, beginning with an analysis of supply and demand dynamics using graphical representations of market scenarios such as newspapers, t-shirts, bagels, and textbooks. It explores how factors like input costs, consumer preferences, and production costs influence market equilibrium. The assignment then defines and discusses the characteristics of perfect competition, including the behavior of firms in such markets, emphasizing the role of marginal cost and marginal product in employment decisions. Furthermore, the assignment includes calculations of price elasticity of demand and explores government interventions to address market failures, such as taxation, quotas, price floors, and rationing. The document also examines supply schedules and markets, outlining factors that cause shifts in the supply curve, such as production costs, the number of firms, and technology. Finally, the assignment covers market forms like monopoly, discussing pricing strategies, price discrimination, and profit maximization within monopoly markets.
1
MANAGERIAL ECONOMICS
MANAGERIAL ECONOMICS
Paraphrase This Document
Need a fresh take? Get an instant paraphrase of this document with our AI Paraphraser
2
Table of contents
1.0 Section A..............................................................................................................................3
1.1 Question number 1...............................................................................................................3
1.2 Question number 2...............................................................................................................6
1.3 Question number 3...............................................................................................................7
1.4 Question number 4...............................................................................................................8
1.5 Question number 5...............................................................................................................8
2.0 Section B..............................................................................................................................9
2.1 Question number 1...............................................................................................................9
2.2 Question number 2.............................................................................................................10
Reference..................................................................................................................................13
3
1.0 Section A
1.1 Question number 1
a)
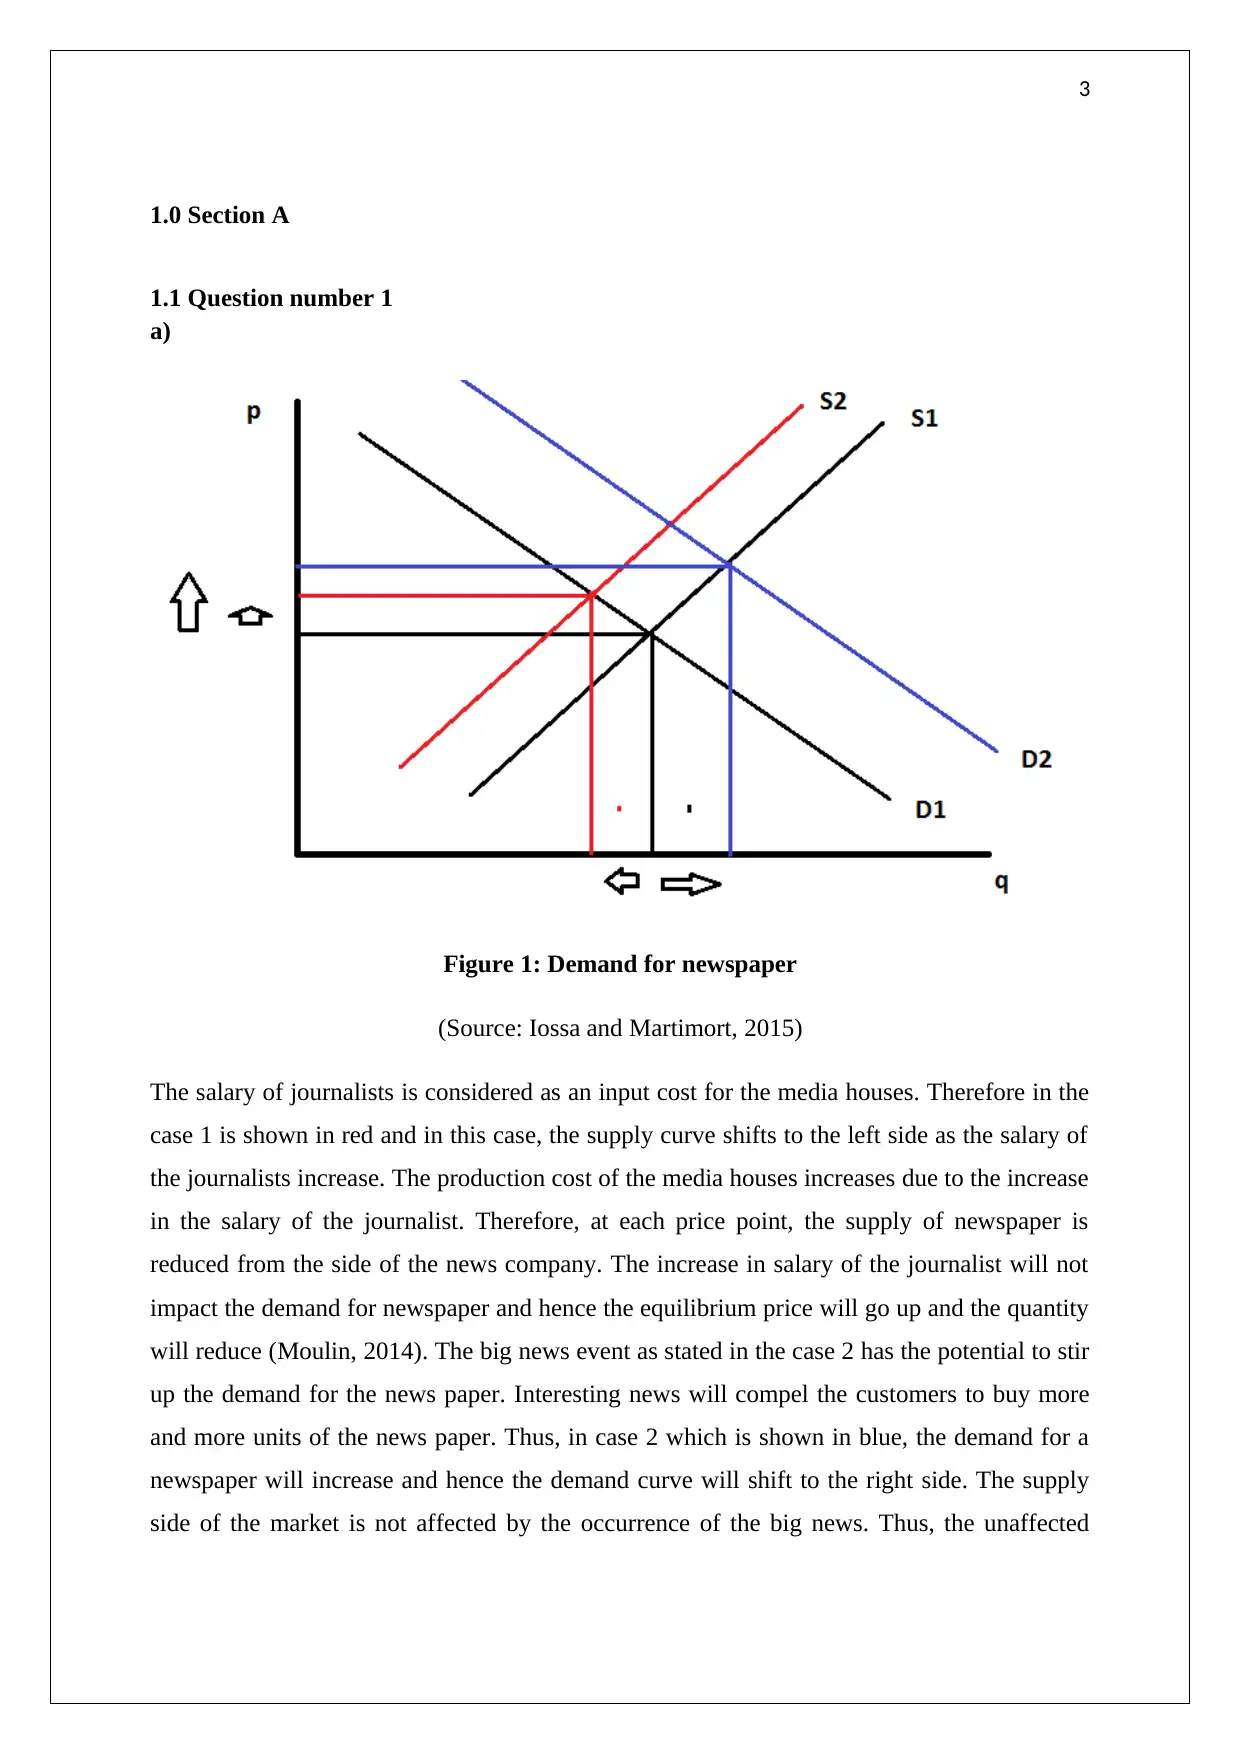
Figure 1: Demand for newspaper
(Source: Iossa and Martimort, 2015)
The salary of journalists is considered as an input cost for the media houses. Therefore in the
case 1 is shown in red and in this case, the supply curve shifts to the left side as the salary of
the journalists increase. The production cost of the media houses increases due to the increase
in the salary of the journalist. Therefore, at each price point, the supply of newspaper is
reduced from the side of the news company. The increase in salary of the journalist will not
impact the demand for newspaper and hence the equilibrium price will go up and the quantity
will reduce (Moulin, 2014). The big news event as stated in the case 2 has the potential to stir
up the demand for the news paper. Interesting news will compel the customers to buy more
and more units of the news paper. Thus, in case 2 which is shown in blue, the demand for a
newspaper will increase and hence the demand curve will shift to the right side. The supply
side of the market is not affected by the occurrence of the big news. Thus, the unaffected
1.0 Section A
1.1 Question number 1
a)
Figure 1: Demand for newspaper
(Source: Iossa and Martimort, 2015)
The salary of journalists is considered as an input cost for the media houses. Therefore in the
case 1 is shown in red and in this case, the supply curve shifts to the left side as the salary of
the journalists increase. The production cost of the media houses increases due to the increase
in the salary of the journalist. Therefore, at each price point, the supply of newspaper is
reduced from the side of the news company. The increase in salary of the journalist will not
impact the demand for newspaper and hence the equilibrium price will go up and the quantity
will reduce (Moulin, 2014). The big news event as stated in the case 2 has the potential to stir
up the demand for the news paper. Interesting news will compel the customers to buy more
and more units of the news paper. Thus, in case 2 which is shown in blue, the demand for a
newspaper will increase and hence the demand curve will shift to the right side. The supply
side of the market is not affected by the occurrence of the big news. Thus, the unaffected
⊘ This is a preview!⊘
Do you want full access?
Subscribe today to unlock all pages.
Trusted by 1+ million students worldwide
4
supply curve and the rightward movement of the demand curve will provide equilibrium
higher prices and higher quantity sold of the news paper.
b)
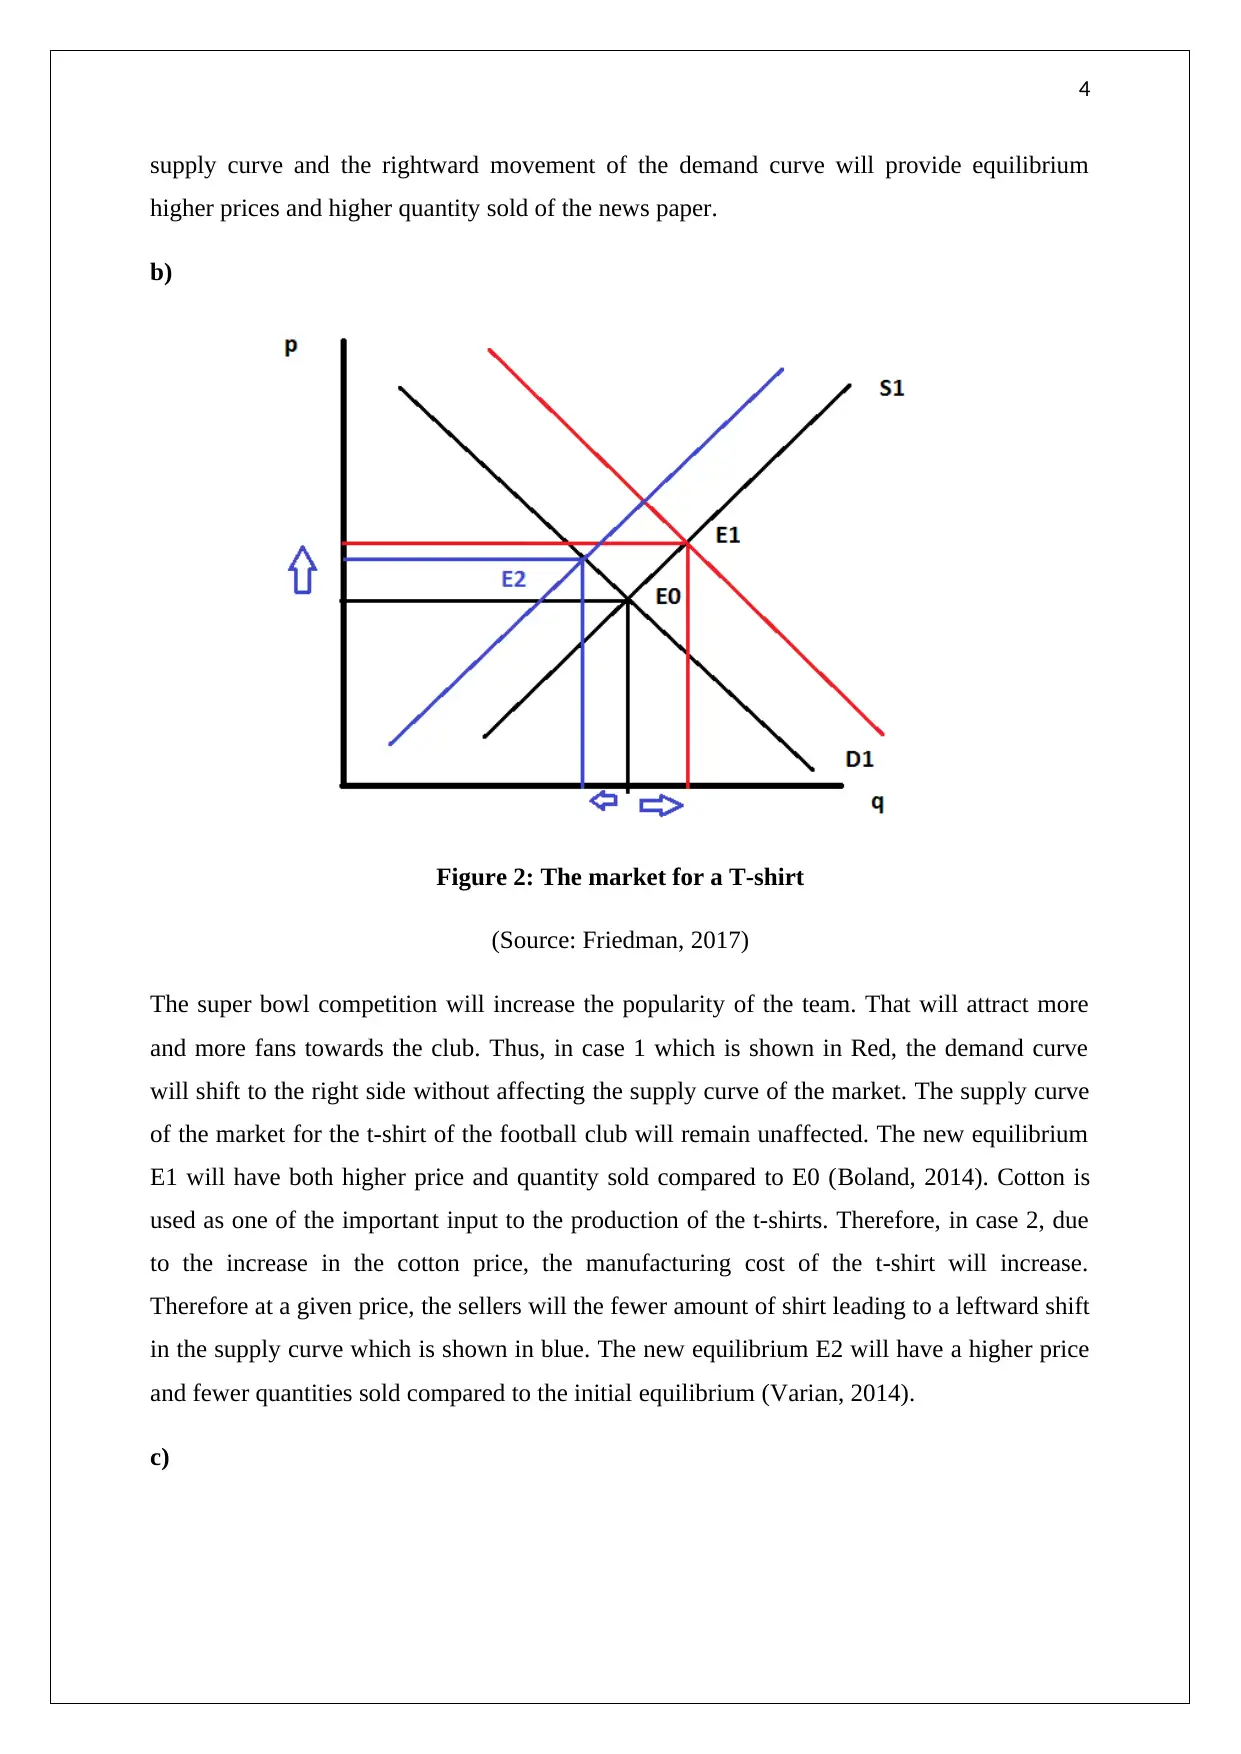
Figure 2: The market for a T-shirt
(Source: Friedman, 2017)
The super bowl competition will increase the popularity of the team. That will attract more
and more fans towards the club. Thus, in case 1 which is shown in Red, the demand curve
will shift to the right side without affecting the supply curve of the market. The supply curve
of the market for the t-shirt of the football club will remain unaffected. The new equilibrium
E1 will have both higher price and quantity sold compared to E0 (Boland, 2014). Cotton is
used as one of the important input to the production of the t-shirts. Therefore, in case 2, due
to the increase in the cotton price, the manufacturing cost of the t-shirt will increase.
Therefore at a given price, the sellers will the fewer amount of shirt leading to a leftward shift
in the supply curve which is shown in blue. The new equilibrium E2 will have a higher price
and fewer quantities sold compared to the initial equilibrium (Varian, 2014).
c)
supply curve and the rightward movement of the demand curve will provide equilibrium
higher prices and higher quantity sold of the news paper.
b)
Figure 2: The market for a T-shirt
(Source: Friedman, 2017)
The super bowl competition will increase the popularity of the team. That will attract more
and more fans towards the club. Thus, in case 1 which is shown in Red, the demand curve
will shift to the right side without affecting the supply curve of the market. The supply curve
of the market for the t-shirt of the football club will remain unaffected. The new equilibrium
E1 will have both higher price and quantity sold compared to E0 (Boland, 2014). Cotton is
used as one of the important input to the production of the t-shirts. Therefore, in case 2, due
to the increase in the cotton price, the manufacturing cost of the t-shirt will increase.
Therefore at a given price, the sellers will the fewer amount of shirt leading to a leftward shift
in the supply curve which is shown in blue. The new equilibrium E2 will have a higher price
and fewer quantities sold compared to the initial equilibrium (Varian, 2014).
c)
Paraphrase This Document
Need a fresh take? Get an instant paraphrase of this document with our AI Paraphraser
5
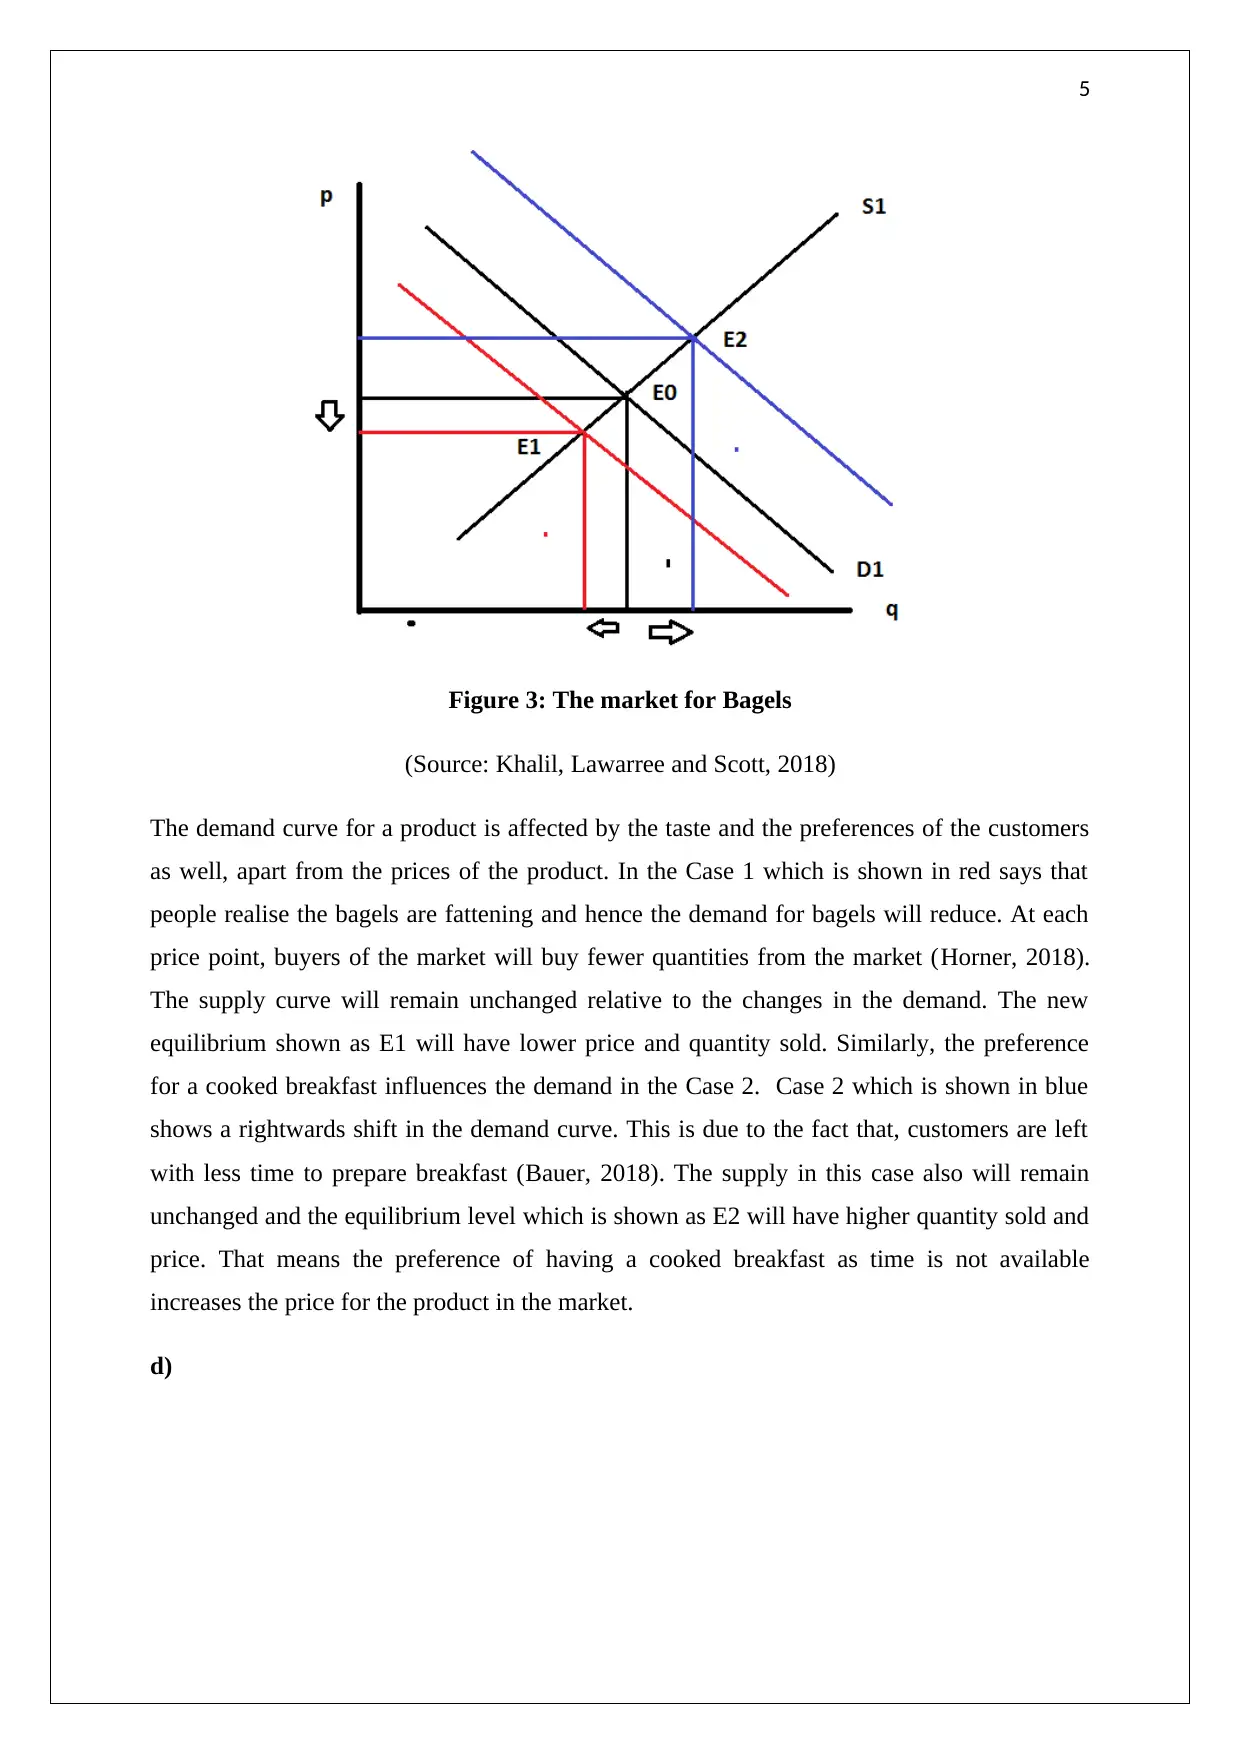
Figure 3: The market for Bagels
(Source: Khalil, Lawarree and Scott, 2018)
The demand curve for a product is affected by the taste and the preferences of the customers
as well, apart from the prices of the product. In the Case 1 which is shown in red says that
people realise the bagels are fattening and hence the demand for bagels will reduce. At each
price point, buyers of the market will buy fewer quantities from the market (Horner, 2018).
The supply curve will remain unchanged relative to the changes in the demand. The new
equilibrium shown as E1 will have lower price and quantity sold. Similarly, the preference
for a cooked breakfast influences the demand in the Case 2. Case 2 which is shown in blue
shows a rightwards shift in the demand curve. This is due to the fact that, customers are left
with less time to prepare breakfast (Bauer, 2018). The supply in this case also will remain
unchanged and the equilibrium level which is shown as E2 will have higher quantity sold and
price. That means the preference of having a cooked breakfast as time is not available
increases the price for the product in the market.
d)
6
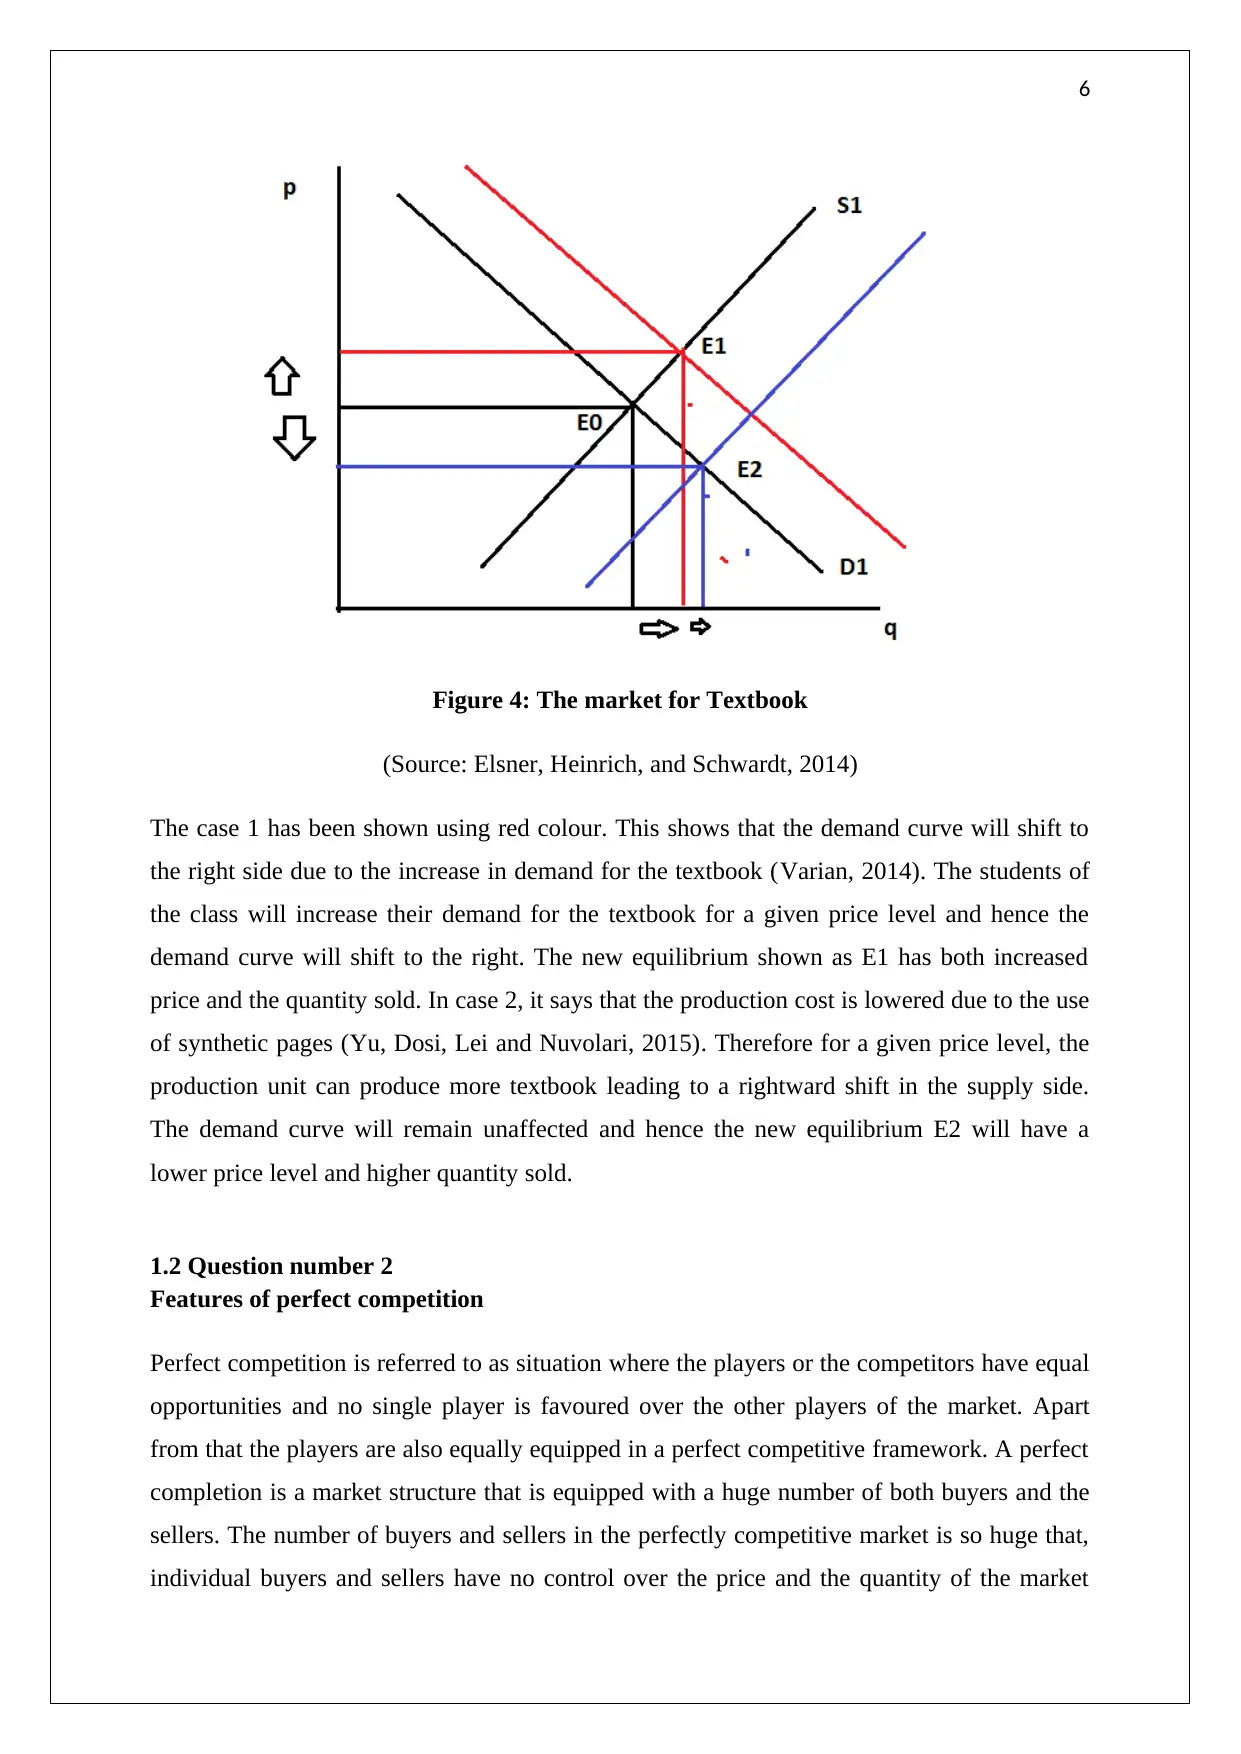
Figure 4: The market for Textbook
(Source: Elsner, Heinrich, and Schwardt, 2014)
The case 1 has been shown using red colour. This shows that the demand curve will shift to
the right side due to the increase in demand for the textbook (Varian, 2014). The students of
the class will increase their demand for the textbook for a given price level and hence the
demand curve will shift to the right. The new equilibrium shown as E1 has both increased
price and the quantity sold. In case 2, it says that the production cost is lowered due to the use
of synthetic pages (Yu, Dosi, Lei and Nuvolari, 2015). Therefore for a given price level, the
production unit can produce more textbook leading to a rightward shift in the supply side.
The demand curve will remain unaffected and hence the new equilibrium E2 will have a
lower price level and higher quantity sold.
1.2 Question number 2
Features of perfect competition
Perfect competition is referred to as situation where the players or the competitors have equal
opportunities and no single player is favoured over the other players of the market. Apart
from that the players are also equally equipped in a perfect competitive framework. A perfect
completion is a market structure that is equipped with a huge number of both buyers and the
sellers. The number of buyers and sellers in the perfectly competitive market is so huge that,
individual buyers and sellers have no control over the price and the quantity of the market
⊘ This is a preview!⊘
Do you want full access?
Subscribe today to unlock all pages.
Trusted by 1+ million students worldwide
7
(Fine, 2016). Another important feature of the perfect competition is that the products are
completely homogenous. That means products of each of the sellers are identical to other
sellers of the market. Apart from that, entry and exit in the perfect competition are free as the
information is freely available. However, it needs to be noted that, there is no market
structure in reality that can be called a perfect competition (Ogloblin, Brown, King and
Levernier, 2018). Still, few markets can be cited as an example of the perfectly competitive
market due to its proximity to the features of a perfectly competitive market. For example,
the market of the notebook is a perfect competition as the number of sellers and buyers are
reasonably high. In addition to that, the different products sold by different sellers are almost
identical to each other that disallow the sellers to have control over the price of the product in
the market (White, 2016).
1.3 Question number 3
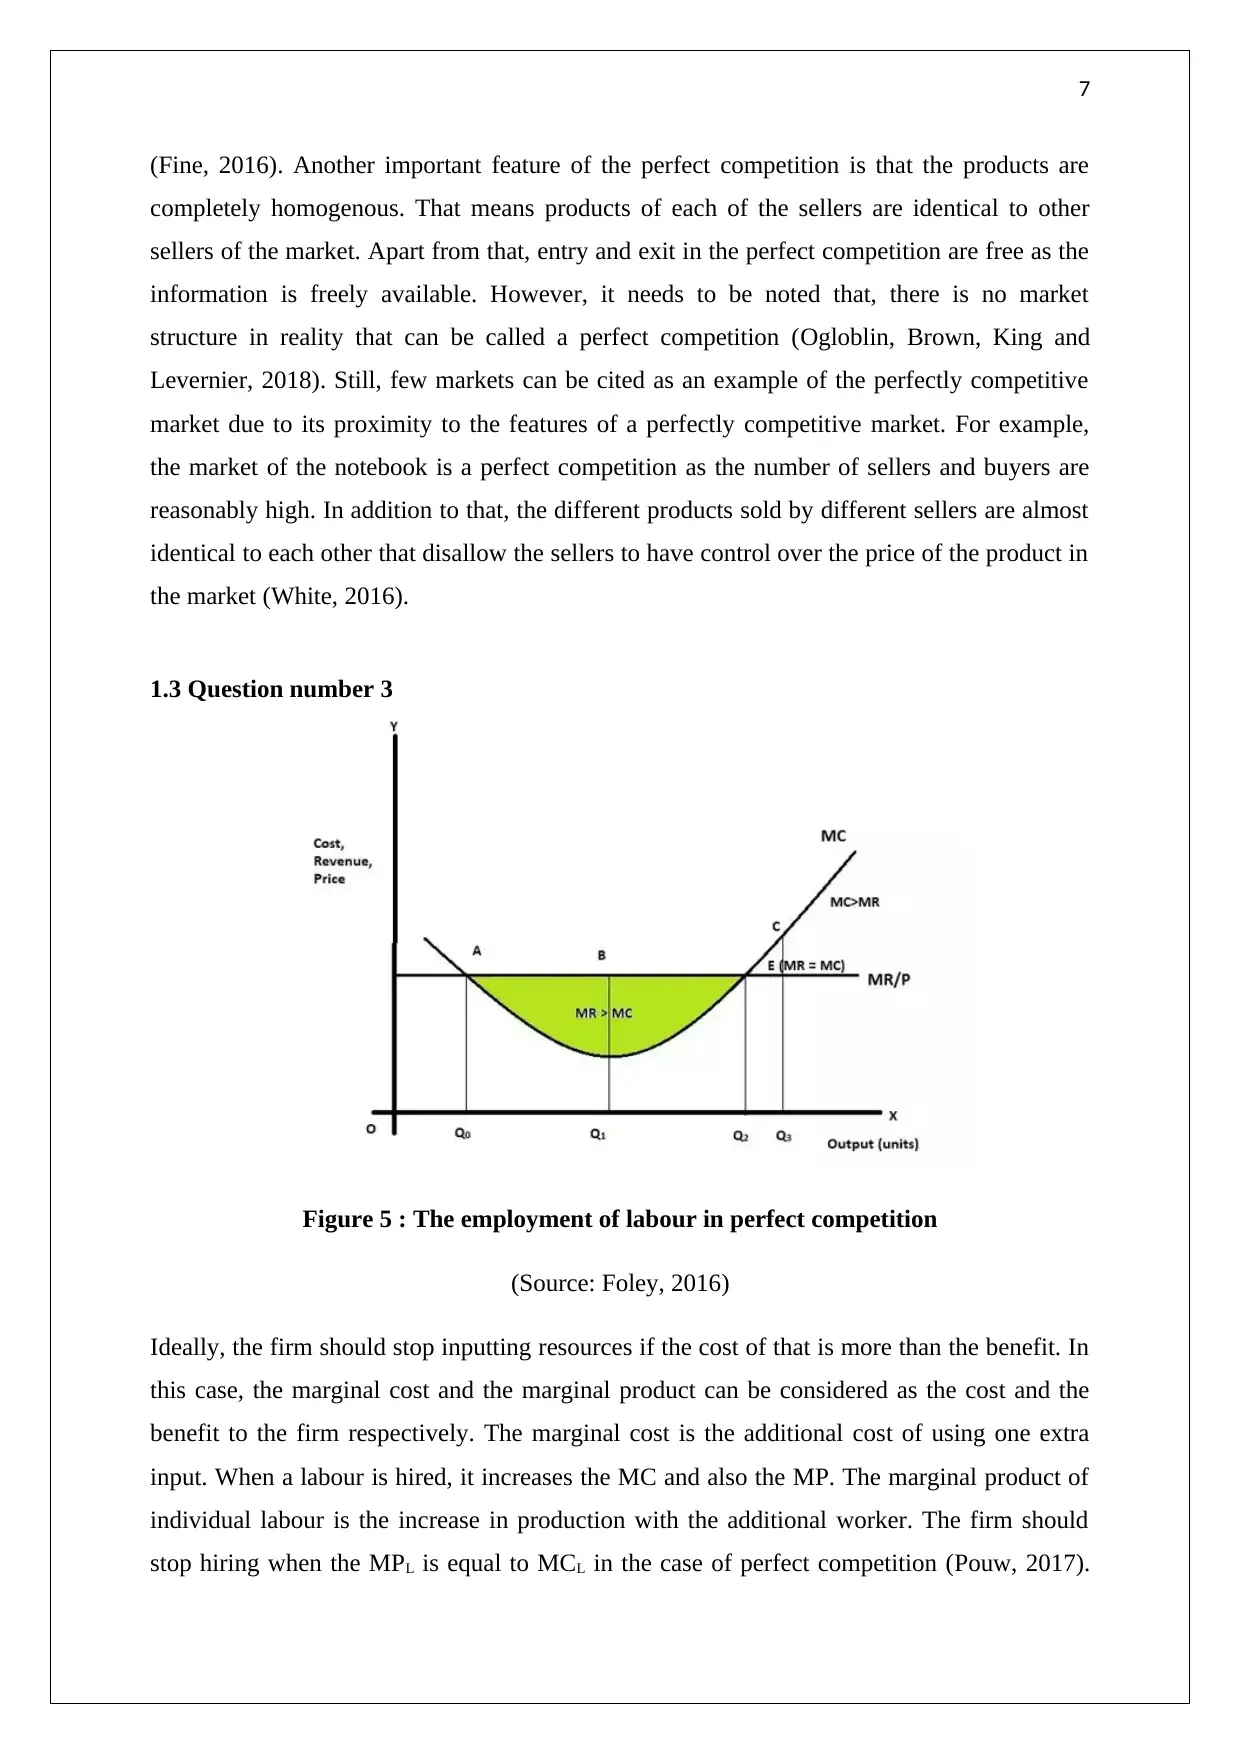
Figure 5 : The employment of labour in perfect competition
(Source: Foley, 2016)
Ideally, the firm should stop inputting resources if the cost of that is more than the benefit. In
this case, the marginal cost and the marginal product can be considered as the cost and the
benefit to the firm respectively. The marginal cost is the additional cost of using one extra
input. When a labour is hired, it increases the MC and also the MP. The marginal product of
individual labour is the increase in production with the additional worker. The firm should
stop hiring when the MPL is equal to MCL in the case of perfect competition (Pouw, 2017).
(Fine, 2016). Another important feature of the perfect competition is that the products are
completely homogenous. That means products of each of the sellers are identical to other
sellers of the market. Apart from that, entry and exit in the perfect competition are free as the
information is freely available. However, it needs to be noted that, there is no market
structure in reality that can be called a perfect competition (Ogloblin, Brown, King and
Levernier, 2018). Still, few markets can be cited as an example of the perfectly competitive
market due to its proximity to the features of a perfectly competitive market. For example,
the market of the notebook is a perfect competition as the number of sellers and buyers are
reasonably high. In addition to that, the different products sold by different sellers are almost
identical to each other that disallow the sellers to have control over the price of the product in
the market (White, 2016).
1.3 Question number 3
Figure 5 : The employment of labour in perfect competition
(Source: Foley, 2016)
Ideally, the firm should stop inputting resources if the cost of that is more than the benefit. In
this case, the marginal cost and the marginal product can be considered as the cost and the
benefit to the firm respectively. The marginal cost is the additional cost of using one extra
input. When a labour is hired, it increases the MC and also the MP. The marginal product of
individual labour is the increase in production with the additional worker. The firm should
stop hiring when the MPL is equal to MCL in the case of perfect competition (Pouw, 2017).
Paraphrase This Document
Need a fresh take? Get an instant paraphrase of this document with our AI Paraphraser
8
Beyond this, the cost will be more than the benefit and hence it’s not desirable from the
perspective of the firm. The firm should look if they can get more productivity compared to
the cost. In the case where the marginal productivity is more than the marginal cost, the firm
gains from the hiring of the labour in the production process. Beyond that point, firm receives
less products corresponding to the cost incurred by the firm to hire a labour.
Characteristics of a perfectly competitive market
A huge number of buyers and sellers
Homogenous goods or services
Perfect Knowledge
Free entry and exit
No control of any individual over the price
1.4 Question number 4
a)
The percentage change in the quantity demanded = ((10-8)/10)*100=20
The change in the price= ((3-3.75)/3)*100= -25
Therefore, the elasticity of demand of jacky= -(20/25) = -0.8
The absolute value of the elasticity is less than 1 and hence the demand for envelopes is
inelastic. The negative sign here suggests the negative relationship between the price and the
quantity demanded of the good.
b)
The percentage change in the quantity demanded= ((50-40)/50)*100= 20
The percentage change in the price for cookies= ((4-6)/4)*100= -50
Thus, the elasticity of demand= -(20/50)= -0.4
Now if the price increases from $6 to $10 the percentage increase would be
((10-6)/6)*100= 66.66
Now if the elasticity is the same that is -0.4. The percentage decrease in demand would be,
9
(x/66.66)= -0.4 => x= (-.04)*66.66= -2.66
Thus, the demand at the price of $10 would be= 37.73 Dozen
1.5 Question number 5
The government can take four actions to intervene in the situation of market failure.
Taxation can increase the cost of the goods and hence the customers with higher
willingness to pay will be able to buy the product from the market. One of the
advantages of this is that it curbs the monopoly power of the seller.
Quota system can also be implemented in order to reduce market failure. This will
allow a better distribution of the products or the service of the market.
The government can also use the price floor to clear the market and inefficiency of the
market (Lynham, 2018).
Rationing can also be used by the government in order to ensure a better distribution.
2.0 Section B
2.1 Question number 1
a)
Supply schedule: The supply Schedule is a relationship between the price of a product in the
market and the willingness of the seller to supply a certain amount of product or service in
the market (Baumol, 2017). The relationship between the price and the willingness to sell in
the supply schedule of the producer for a normal good market is positively related. As the
price for a product or the service increase, the sellers sell more and more quantity of product
or service in the market. The supply schedule maps the selling behaviour of the sellers
corresponding to the price level of the market. The supply schedule is opposite to the demand
schedule and in the supply schedule; higher prices show a higher willingness to sell of the
seller. This is also the reason for the upward sloping supply curve where the quantity sold
increase with the price unlike the demand curve. However, not all the supply curves are
upward sloping. There are few of the goods whose supply curve is downward sloping such as
the market for stocks and bonds. As the price of stock increases the supply decreases leading
to a downward sloping supply curve.
⊘ This is a preview!⊘
Do you want full access?
Subscribe today to unlock all pages.
Trusted by 1+ million students worldwide
10
Supply market: The supply market, which is shown, using the supply curve in the supply
and demand theory, is dependent on many external factors. These factors cause shifts in the
supply curve of the market. First and the foremost factor that influences the supply is the cost
of operation (Chade, Eeckhout and Smith, 2014). The reduced cost of production allows the
sellers to sell more product or service for a given price level. Therefore the supply curve
shifts to the right. The reduction in the production costs allows the firms to produce more
products at the same cost and hence the supply curve gets influenced. Apart from that, the
number of firms also plays a role in determining the position of the supply curve. If the
number of firms increases the supply of goods or services increase leading to a rightward
shift in the right. Technology is also another factor that influences the supply curve of the
market (Burguet, Ganuza, and Montalvo, 2018). Technology reduces the cost of operation of
the sellers and hence at each price level, the seller becomes able to sell more quantity of
goods or service. Apart from that, technology also increases the rate of production as well
which allows the seller to increase their supply in the market in a given time leading to a
rightward shift in the market. In addition to that, the climatic condition has its impact on the
supply curve of the market. If the weather deteriorates and sellers fail to acquire their raw
martial the production level will reduce leading to a leftward shift of the supply curve
(Katzner, 2015). Most of the agricultural or the food market experiences these factors. The
markets of all the raw materials in the value chain are intertwined with the other markets of
the value chain. For example, the market for orange fruit juice is highly dependent on the
market of orange. If the weather condition harms the production of orange, it will eventually
affect the production of the orange juice market as well.
b)
Paraphrase This Document
Need a fresh take? Get an instant paraphrase of this document with our AI Paraphraser
11
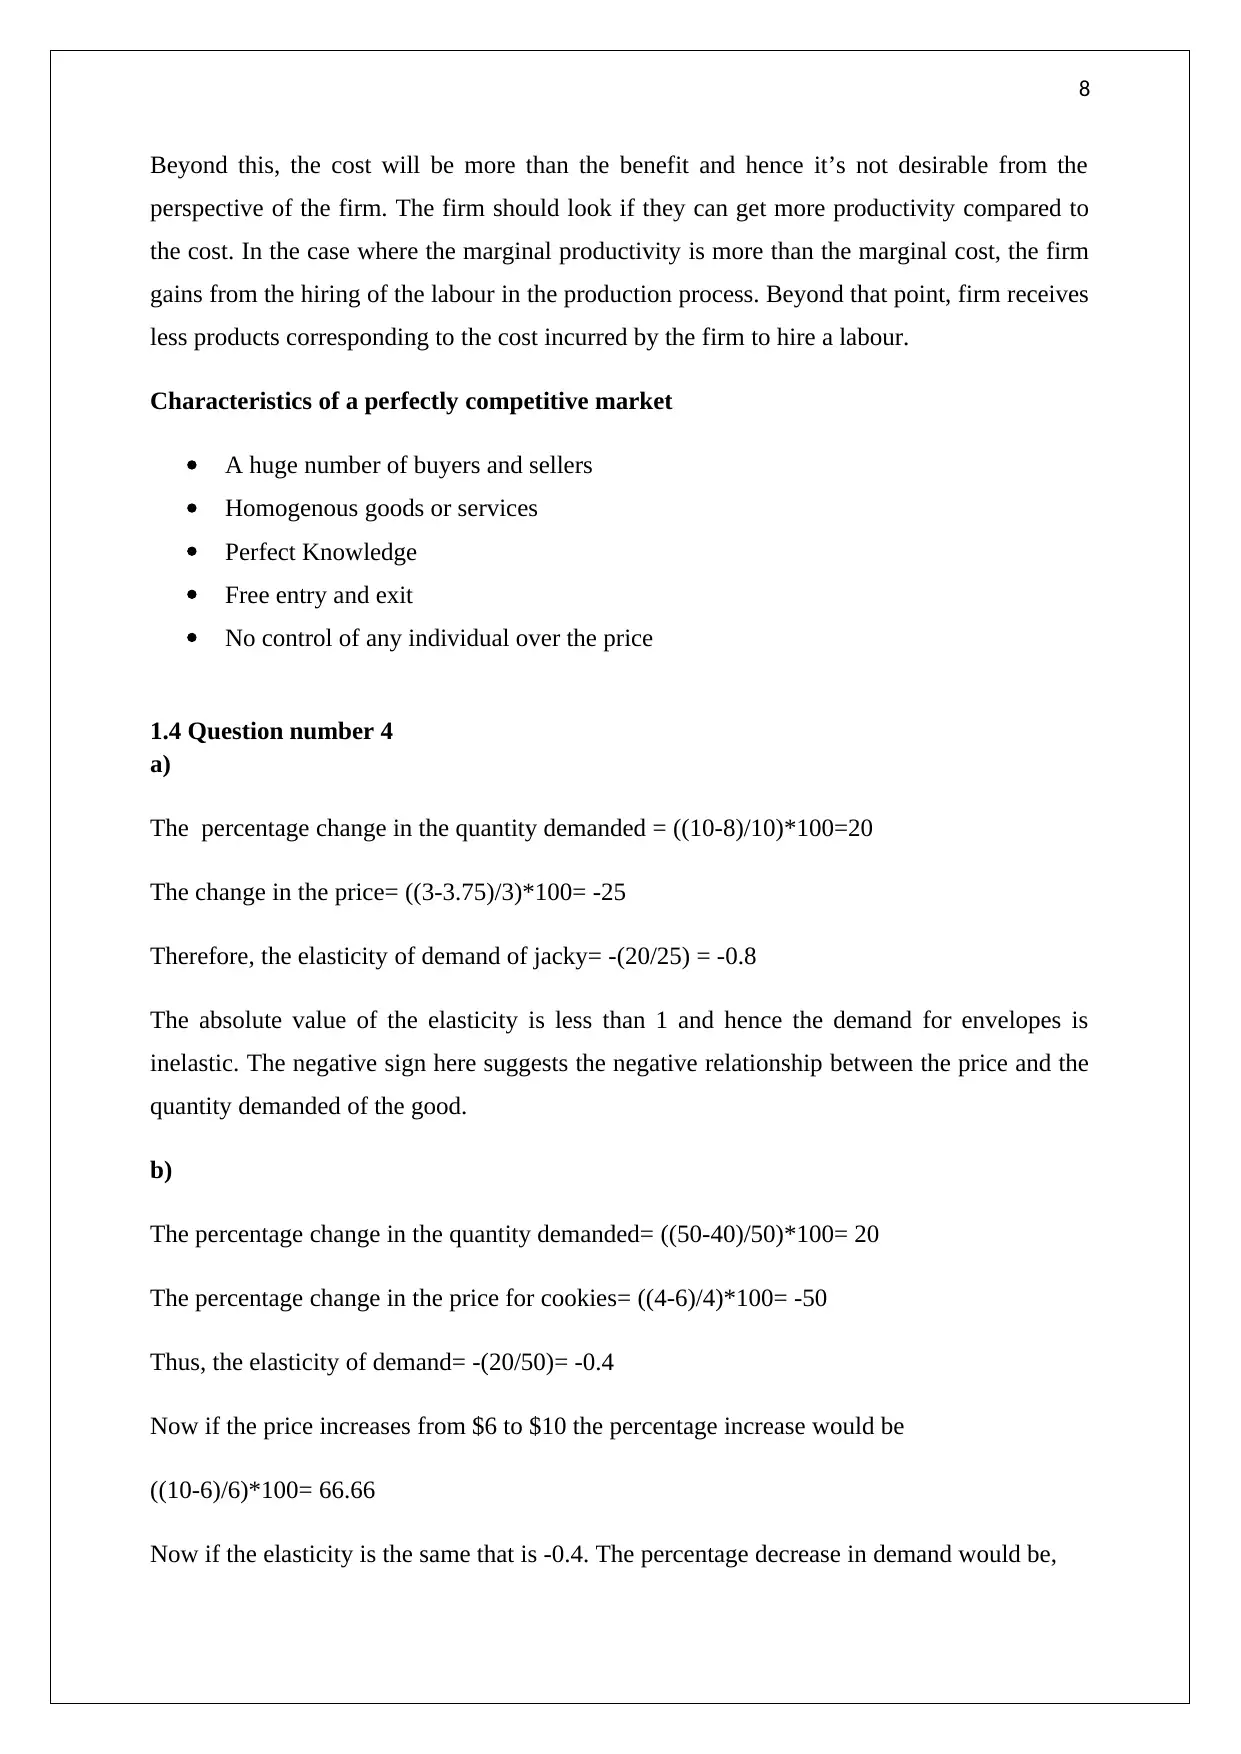
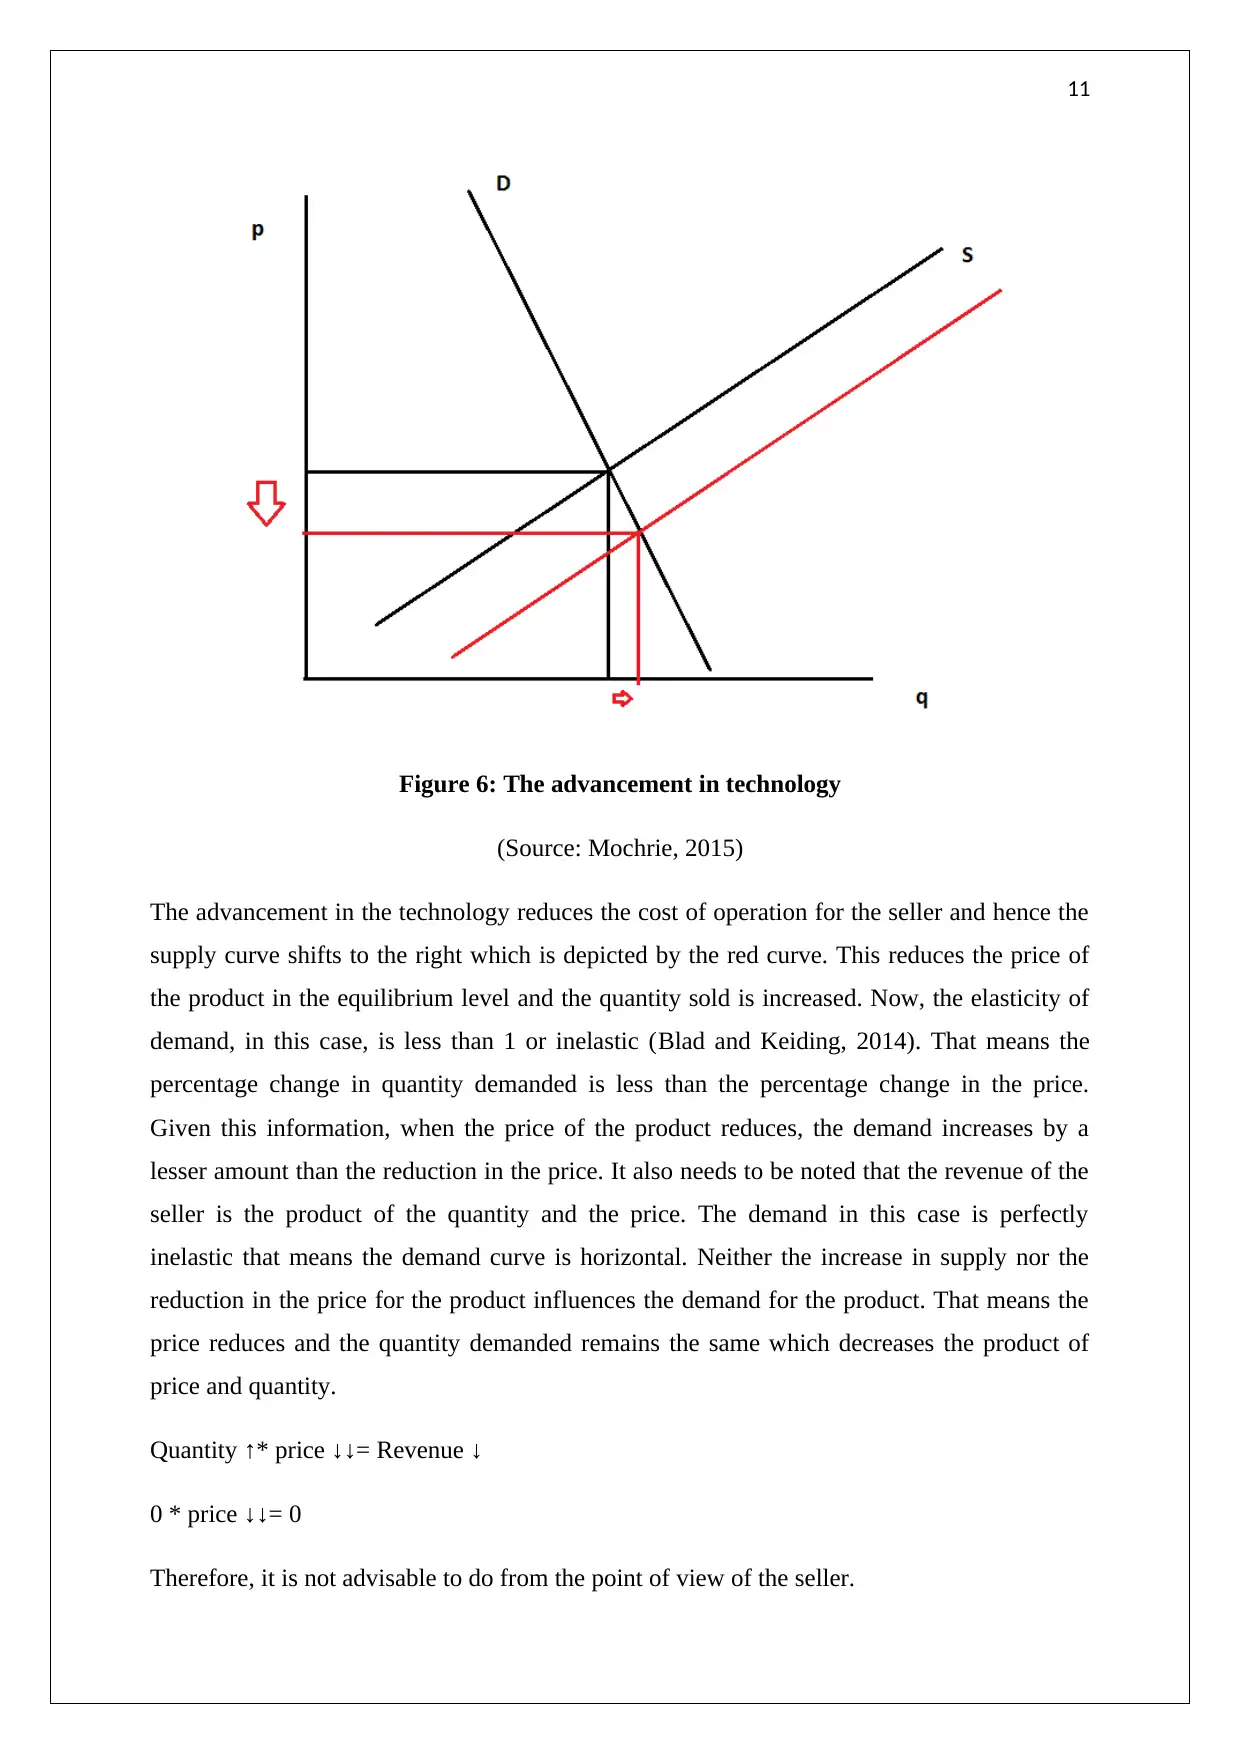
Figure 6: The advancement in technology
(Source: Mochrie, 2015)
The advancement in the technology reduces the cost of operation for the seller and hence the
supply curve shifts to the right which is depicted by the red curve. This reduces the price of
the product in the equilibrium level and the quantity sold is increased. Now, the elasticity of
demand, in this case, is less than 1 or inelastic (Blad and Keiding, 2014). That means the
percentage change in quantity demanded is less than the percentage change in the price.
Given this information, when the price of the product reduces, the demand increases by a
lesser amount than the reduction in the price. It also needs to be noted that the revenue of the
seller is the product of the quantity and the price. The demand in this case is perfectly
inelastic that means the demand curve is horizontal. Neither the increase in supply nor the
reduction in the price for the product influences the demand for the product. That means the
price reduces and the quantity demanded remains the same which decreases the product of
price and quantity.
Quantity ↑* price ↓↓= Revenue ↓
0 * price ↓↓= 0
Therefore, it is not advisable to do from the point of view of the seller.
12
2.2 Question number 2
a) The emerging market form in the case of UAE is of an oligopoly. The oligopolistic market
is a structure where there is more than one seller in the market. One of the major
characteristics of the oligopoly is that the total number of sellers is limited. Apart from that,
the action of one seller directly impacts the other seller of the market. The products sold by
the sellers may be identical or not. In the case of emerging telecom market of UAE, the
products or the service sold by the companies are somewhat similar to each other. Lastly,
there exist, barriers to entry and exit in this market form. The action of the sellers in the
telecom market of UAE also influences the other sellers of the market as well. This
characteristic also matches with the features of oligopolistic market. Due to the small number
of sellers in the market, gains of the firms are intertwined with each other. Mochrie (2015)
noted that, this feature of the market pushes the firm to form a cartel among themselves.
b) Depending on the characteristics of the oligopolistic market, there can be a number of
pricing policies which can be used by sellers in the market. First and the foremost pricing
strategy that is often common in case of oligopoly is the price cartel. In this policy, the sellers
of the market enter into a mutual contract to keep the prices same for a said amount of time as
the decrease in price or price war may lead to a disadvantage for all the firms of the market
(Lynham, 2018). This policy intends to extract all the surplus of the market jointly.
Government in some of the oligopolistic market also intervenes in order to break the cartel so
that price can further be lowered benefiting the customers of the market. In addition to that,
another pricing policy that can be seen in the telecom industry of UAE is the price leadership.
Under this policy, there exists no contract among the firms of the market. One firm sets the
price and the other firm follows the strategy in order to avoid any kind of price war which
may lead to the mutual disadvantage of the firms. Price war is a common place under this
strategy as the firms often look to undercut the leader in terms of prices in order to have a
better market share. Lastly, the firms of telecom industry of UAE can also engage in direct
price war reducing price individually in order to increase the market share. However, one of
the disadvantages of this policy is that it reduces the price of the goods and the services so
much so that it reduces the revenue and the margin of the firms.
c)
⊘ This is a preview!⊘
Do you want full access?
Subscribe today to unlock all pages.
Trusted by 1+ million students worldwide
1 out of 15
Related Documents


Your All-in-One AI-Powered Toolkit for Academic Success.
+13062052269
info@desklib.com
Available 24*7 on WhatsApp / Email
![[object Object]](/_next/static/media/star-bottom.7253800d.svg)
Unlock your academic potential
Copyright © 2020–2026 A2Z Services. All Rights Reserved. Developed and managed by ZUCOL.