Managerial Economics Assignment: Analysis of Cost, Demand, and Profit
VerifiedAdded on 2020/04/21
|14
|1267
|110
Homework Assignment
AI Summary
This managerial economics assignment analyzes cost functions, demand determinants, and profit maximization strategies. The solution includes regression analysis to estimate cost and demand functions, calculating marginal cost and revenue. The assignment explores price and income elasticity of demand, predicting the impact of price changes on quantity demanded. It also examines the effects of fixed cost changes on profit and revenue maximization. The solution determines optimal pricing and output levels for a firm, considering both profit and revenue objectives. Overall, the assignment provides a comprehensive understanding of key economic principles and their practical application in business decision-making.

Running head: MANAGERIAL ECONOMICS
Managerial Economics
Name of the Student
Name of the University
Author note
Managerial Economics
Name of the Student
Name of the University
Author note
Paraphrase This Document
Need a fresh take? Get an instant paraphrase of this document with our AI Paraphraser
1MANAGERIAL ECONOMICS
Table of Contents
Answer 1....................................................................................................................................2
Answer a.................................................................................................................................2
Answer b....................................................................................................................................3
Answer c.....................................................................................................................................3
Answer 2....................................................................................................................................4
Answer a.................................................................................................................................4
Answer b................................................................................................................................6
Answer b................................................................................................................................6
Answer c.................................................................................................................................7
Answer 3....................................................................................................................................9
Answer 4....................................................................................................................................9
Answer a.................................................................................................................................9
Answer b..............................................................................................................................10
Answer 5..................................................................................................................................10
Answer a...............................................................................................................................10
Answer b..............................................................................................................................10
Answer 6..................................................................................................................................10
Answer 7..................................................................................................................................12
2MANAGERIAL ECONOMICS
Answer 1
Answer a
Regression Statistics
Multiple R 0.80
R Square 0.63
Adjusted R Square 0.60
Standard Error 7.73
Observations 26.00
ANOVA
df SS MS F Significance F
Regression 2.00 2387.50 1193.75 19.97 0.00
Residual 23.00 1374.54 59.76
Total 25.00 3762.04
Coefficients
Standard
Error t Stat P-value Lower 95%
Upper
95%
Intercept 152.881 6.605 23.146 0.000 139.217 166.544
Q -0.061 0.015 -4.199 0.000 -0.092 -0.031
Q2 0.00002 0.000 2.693 0.013 0.000 0.000
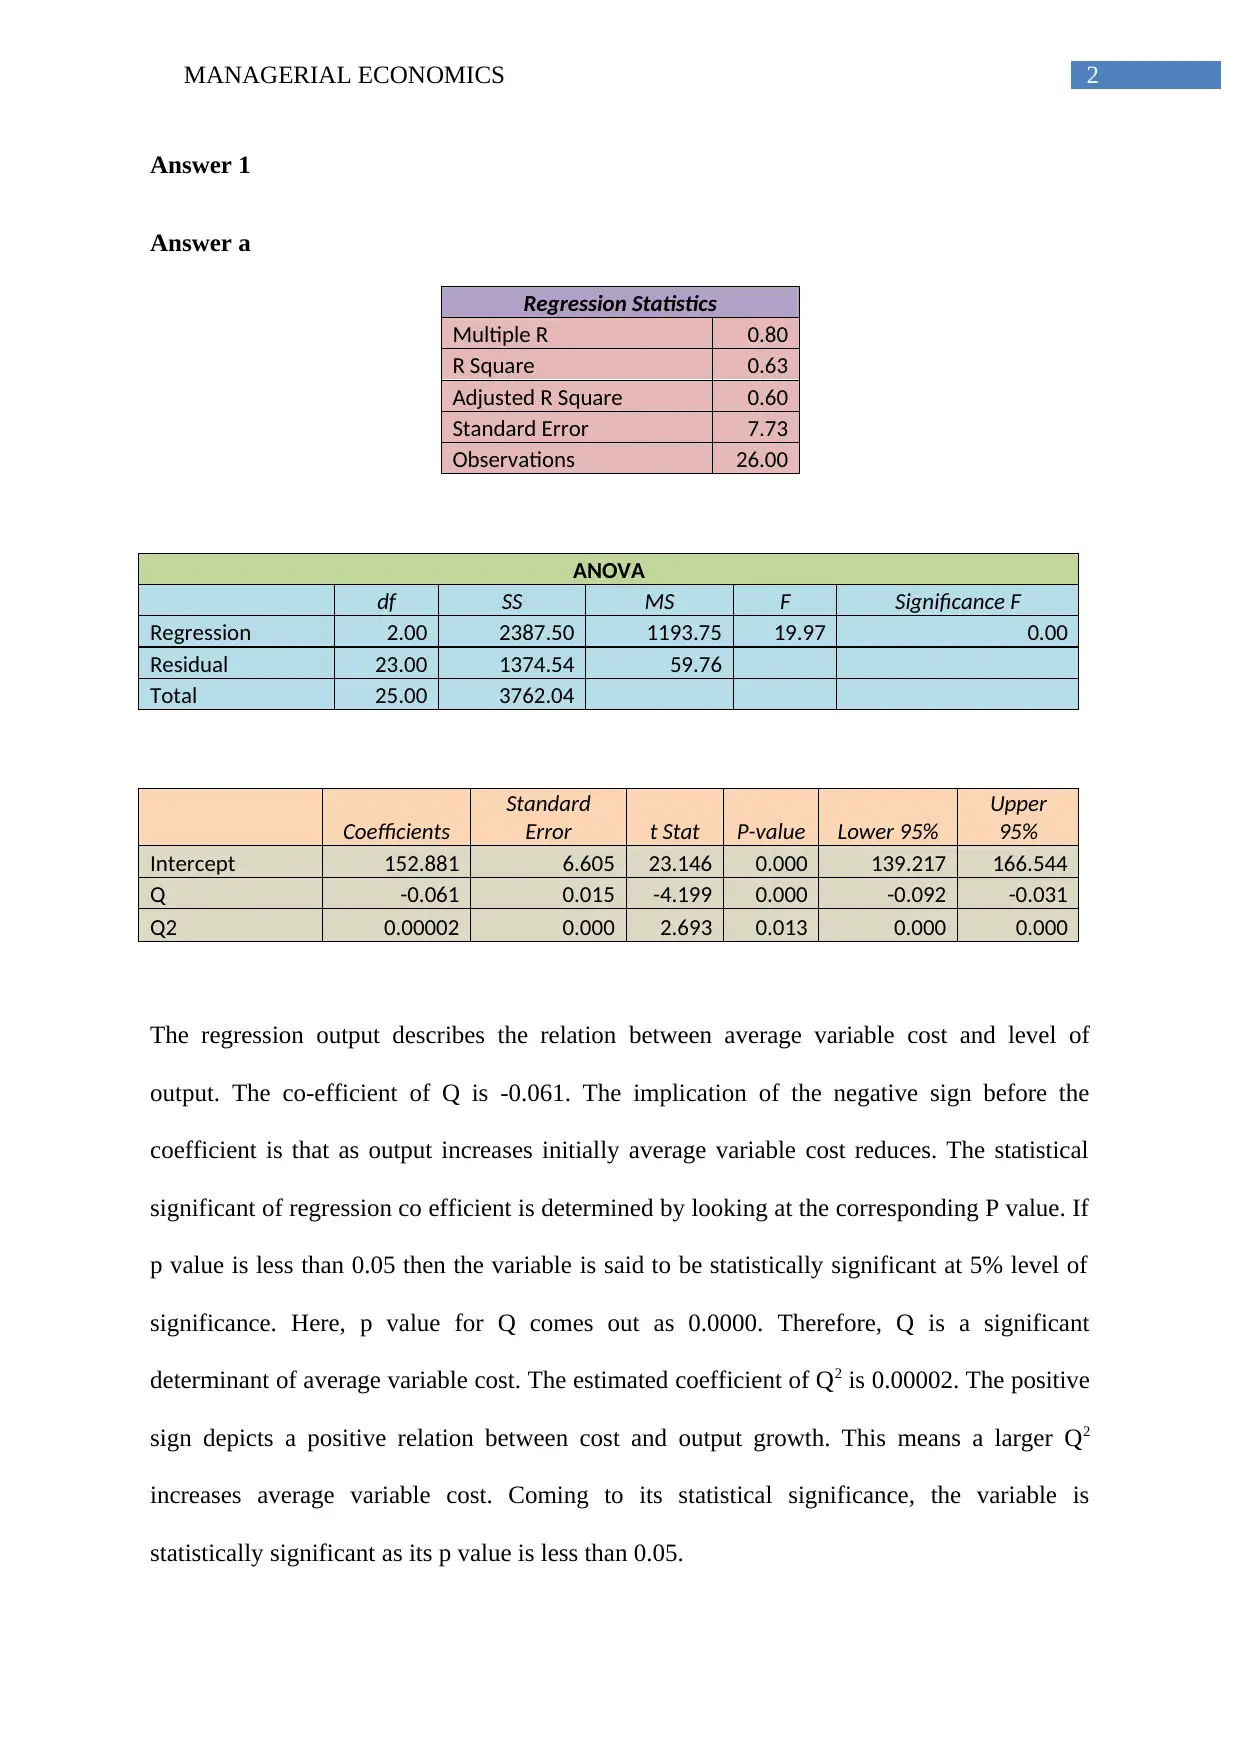
The regression output describes the relation between average variable cost and level of
output. The co-efficient of Q is -0.061. The implication of the negative sign before the
coefficient is that as output increases initially average variable cost reduces. The statistical
significant of regression co efficient is determined by looking at the corresponding P value. If
p value is less than 0.05 then the variable is said to be statistically significant at 5% level of
significance. Here, p value for Q comes out as 0.0000. Therefore, Q is a significant
determinant of average variable cost. The estimated coefficient of Q2 is 0.00002. The positive
sign depicts a positive relation between cost and output growth. This means a larger Q2
increases average variable cost. Coming to its statistical significance, the variable is
statistically significant as its p value is less than 0.05.
Answer 1
Answer a
Regression Statistics
Multiple R 0.80
R Square 0.63
Adjusted R Square 0.60
Standard Error 7.73
Observations 26.00
ANOVA
df SS MS F Significance F
Regression 2.00 2387.50 1193.75 19.97 0.00
Residual 23.00 1374.54 59.76
Total 25.00 3762.04
Coefficients
Standard
Error t Stat P-value Lower 95%
Upper
95%
Intercept 152.881 6.605 23.146 0.000 139.217 166.544
Q -0.061 0.015 -4.199 0.000 -0.092 -0.031
Q2 0.00002 0.000 2.693 0.013 0.000 0.000
The regression output describes the relation between average variable cost and level of
output. The co-efficient of Q is -0.061. The implication of the negative sign before the
coefficient is that as output increases initially average variable cost reduces. The statistical
significant of regression co efficient is determined by looking at the corresponding P value. If
p value is less than 0.05 then the variable is said to be statistically significant at 5% level of
significance. Here, p value for Q comes out as 0.0000. Therefore, Q is a significant
determinant of average variable cost. The estimated coefficient of Q2 is 0.00002. The positive
sign depicts a positive relation between cost and output growth. This means a larger Q2
increases average variable cost. Coming to its statistical significance, the variable is
statistically significant as its p value is less than 0.05.
⊘ This is a preview!⊘
Do you want full access?
Subscribe today to unlock all pages.
Trusted by 1+ million students worldwide
3MANAGERIAL ECONOMICS
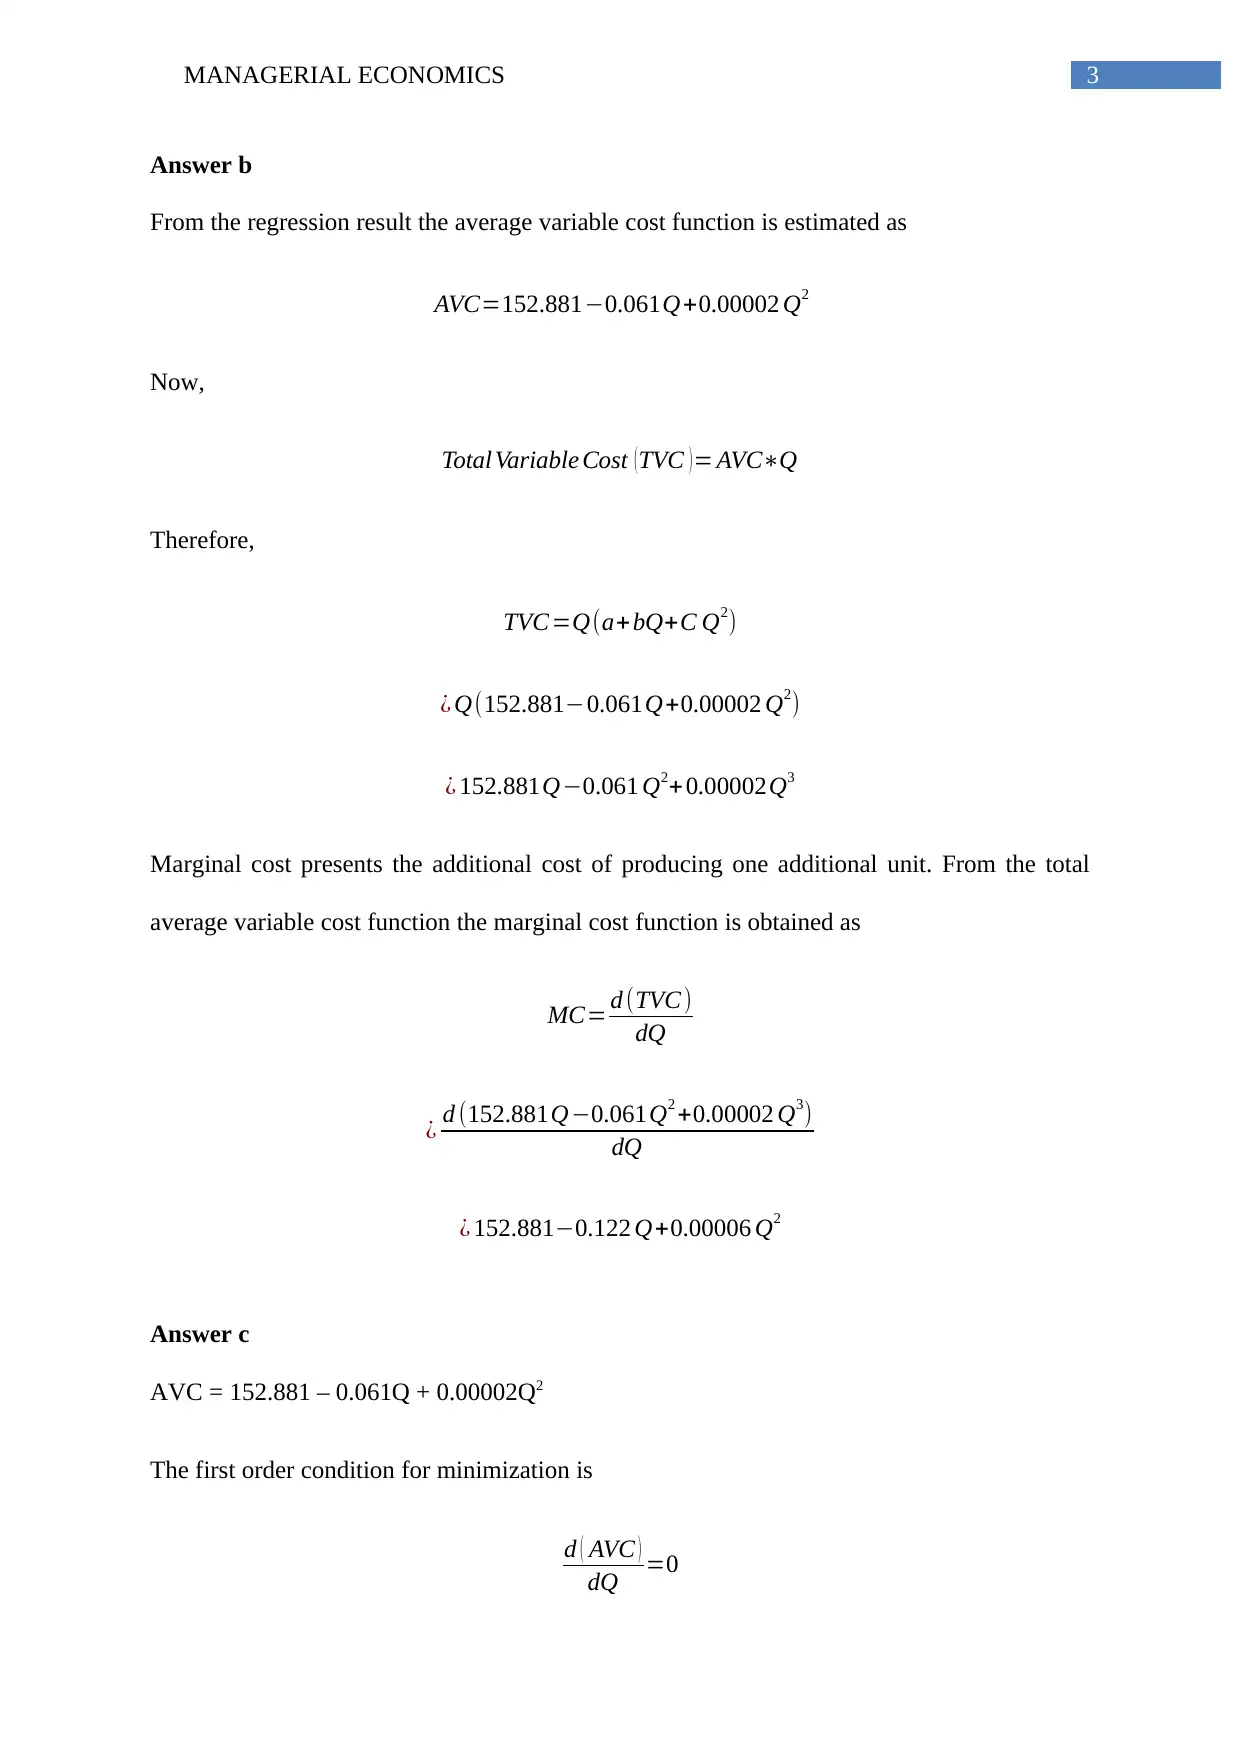
Answer b
From the regression result the average variable cost function is estimated as
AVC=152.881−0.061Q+0.00002 Q2
Now,
Total Variable Cost (TVC )= AVC∗Q
Therefore,
TVC =Q(a+bQ+C Q2)
¿ Q(152.881−0.061Q+0.00002 Q2)
¿ 152.881Q−0.061 Q2+0.00002Q3
Marginal cost presents the additional cost of producing one additional unit. From the total
average variable cost function the marginal cost function is obtained as
MC= d (TVC )
dQ
¿ d (152.881Q−0.061Q2 +0.00002 Q3)
dQ
¿ 152.881−0.122 Q+0.00006 Q2
Answer c
AVC = 152.881 – 0.061Q + 0.00002Q2
The first order condition for minimization is
d ( AVC )
dQ =0
Paraphrase This Document
Need a fresh take? Get an instant paraphrase of this document with our AI Paraphraser
4MANAGERIAL ECONOMICS
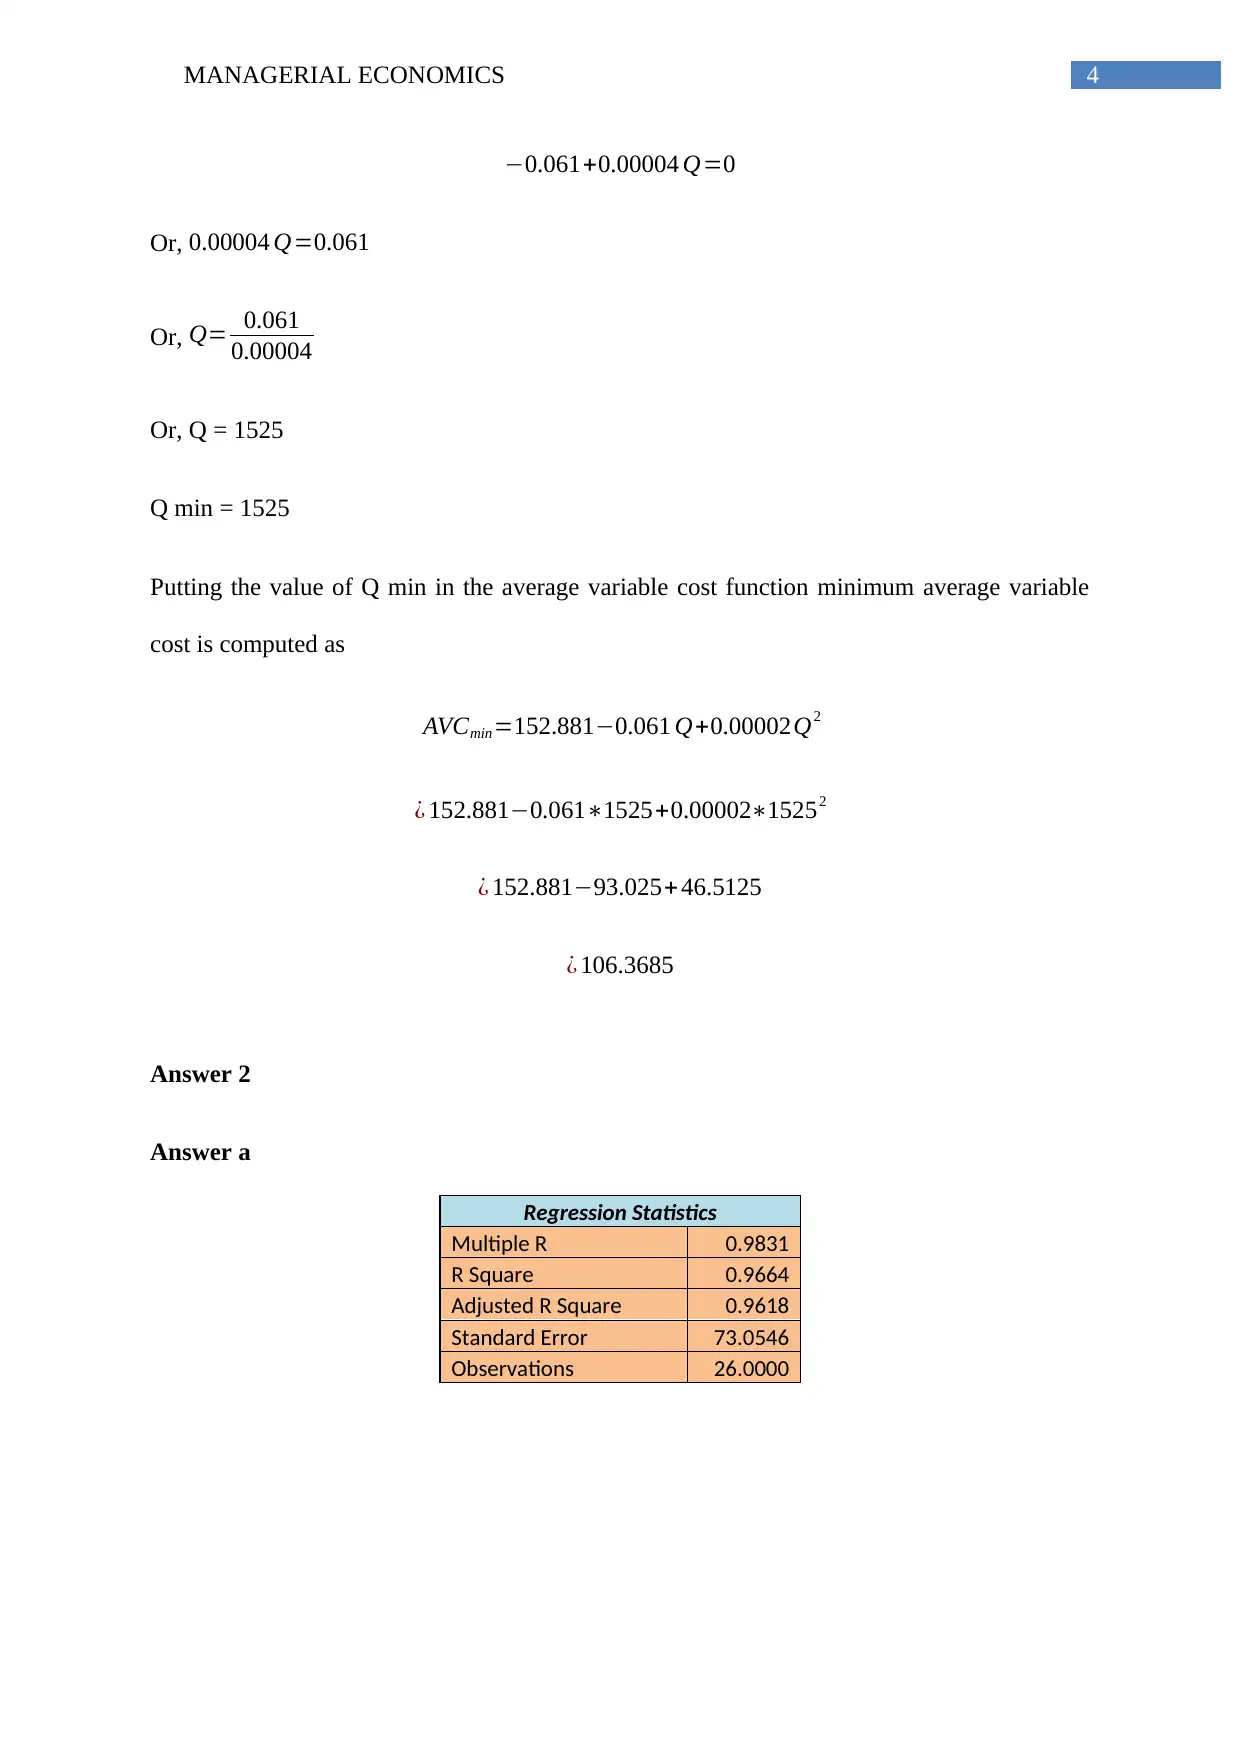
−0.061+0.00004 Q=0
Or, 0.00004 Q=0.061
Or, Q= 0.061
0.00004
Or, Q = 1525
Q min = 1525
Putting the value of Q min in the average variable cost function minimum average variable
cost is computed as
AVCmin=152.881−0.061 Q+0.00002Q2
¿ 152.881−0.061∗1525+0.00002∗15252
¿ 152.881−93.025+ 46.5125
¿ 106.3685
Answer 2
Answer a
Regression Statistics
Multiple R 0.9831
R Square 0.9664
Adjusted R Square 0.9618
Standard Error 73.0546
Observations 26.0000
5MANAGERIAL ECONOMICS
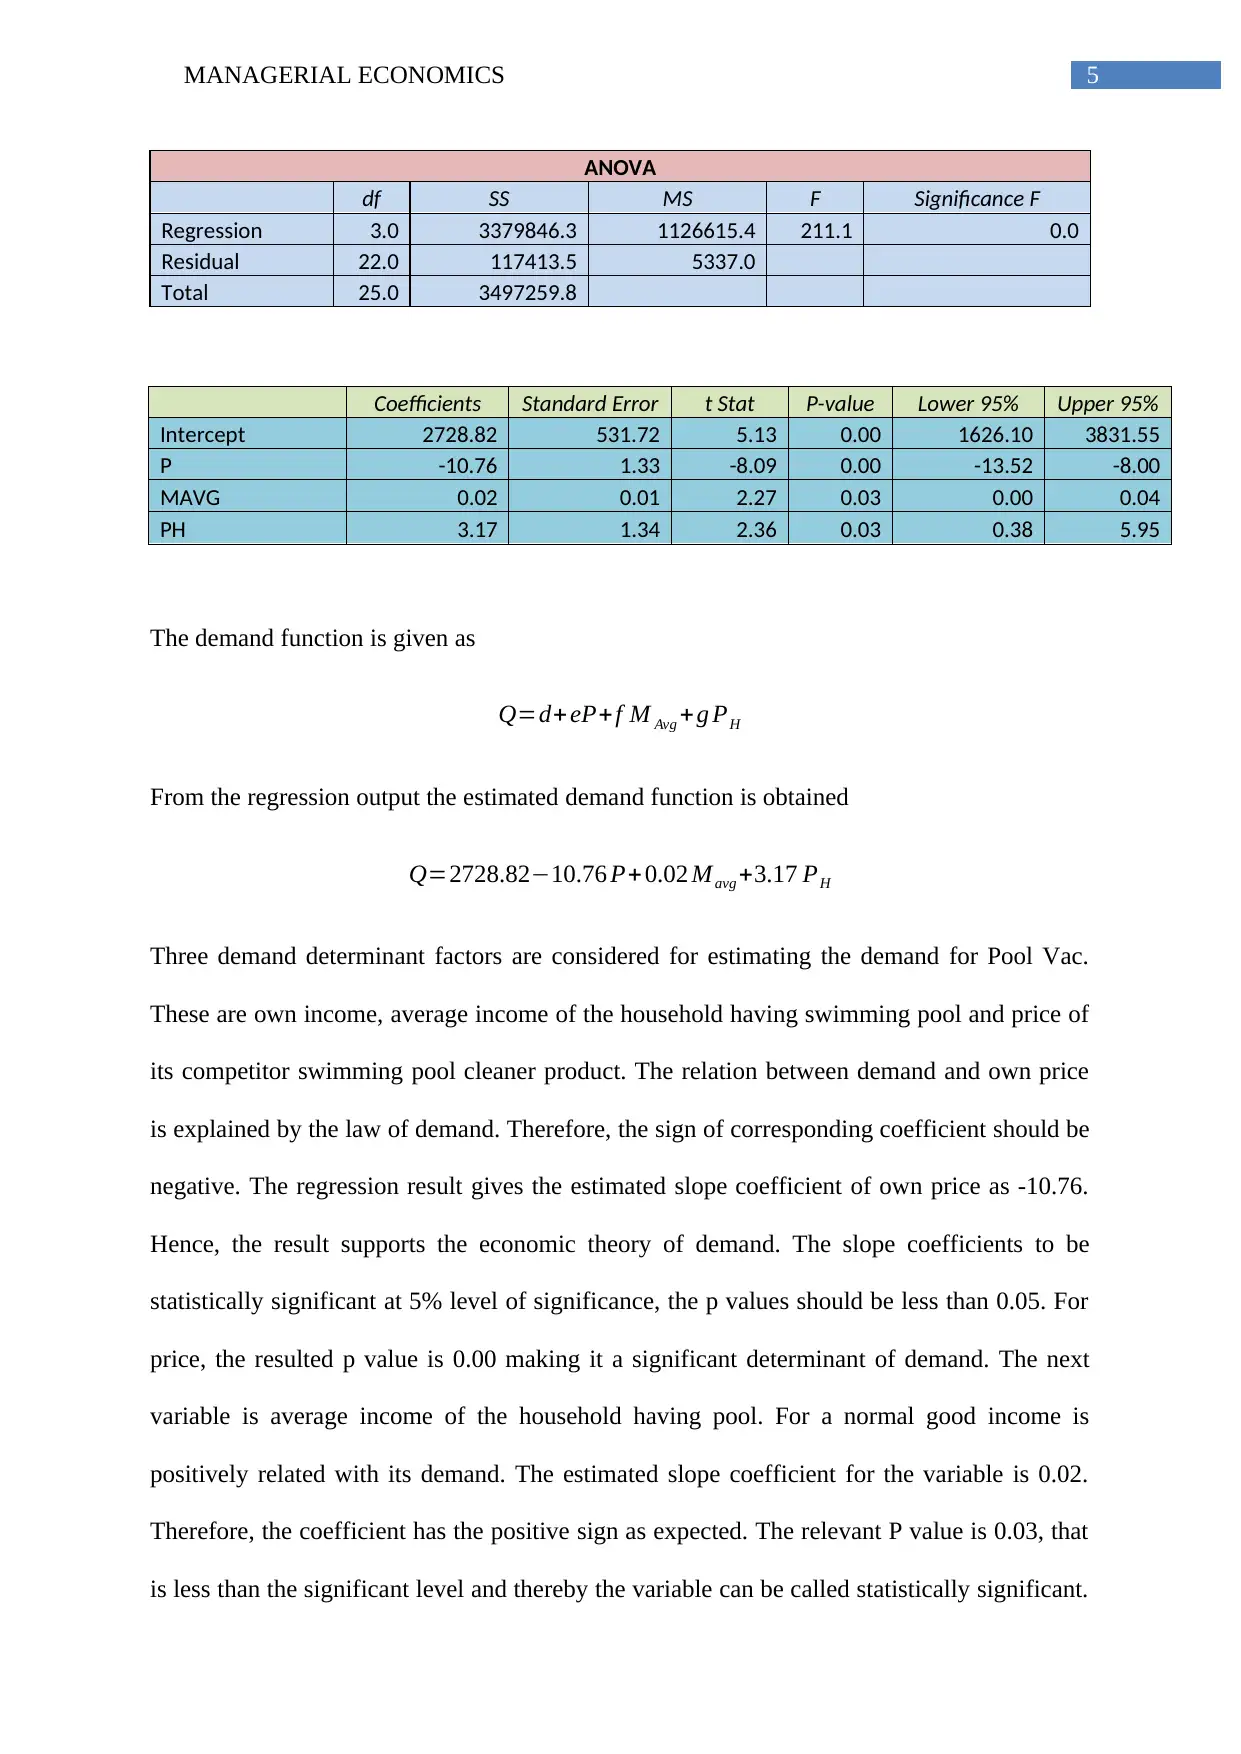
ANOVA
df SS MS F Significance F
Regression 3.0 3379846.3 1126615.4 211.1 0.0
Residual 22.0 117413.5 5337.0
Total 25.0 3497259.8
Coefficients Standard Error t Stat P-value Lower 95% Upper 95%
Intercept 2728.82 531.72 5.13 0.00 1626.10 3831.55
P -10.76 1.33 -8.09 0.00 -13.52 -8.00
MAVG 0.02 0.01 2.27 0.03 0.00 0.04
PH 3.17 1.34 2.36 0.03 0.38 5.95
The demand function is given as
Q=d+ eP+f M Avg +g PH
From the regression output the estimated demand function is obtained
Q=2728.82−10.76 P+ 0.02 Mavg +3.17 PH
Three demand determinant factors are considered for estimating the demand for Pool Vac.
These are own income, average income of the household having swimming pool and price of
its competitor swimming pool cleaner product. The relation between demand and own price
is explained by the law of demand. Therefore, the sign of corresponding coefficient should be
negative. The regression result gives the estimated slope coefficient of own price as -10.76.
Hence, the result supports the economic theory of demand. The slope coefficients to be
statistically significant at 5% level of significance, the p values should be less than 0.05. For
price, the resulted p value is 0.00 making it a significant determinant of demand. The next
variable is average income of the household having pool. For a normal good income is
positively related with its demand. The estimated slope coefficient for the variable is 0.02.
Therefore, the coefficient has the positive sign as expected. The relevant P value is 0.03, that
is less than the significant level and thereby the variable can be called statistically significant.
⊘ This is a preview!⊘
Do you want full access?
Subscribe today to unlock all pages.
Trusted by 1+ million students worldwide
6MANAGERIAL ECONOMICS
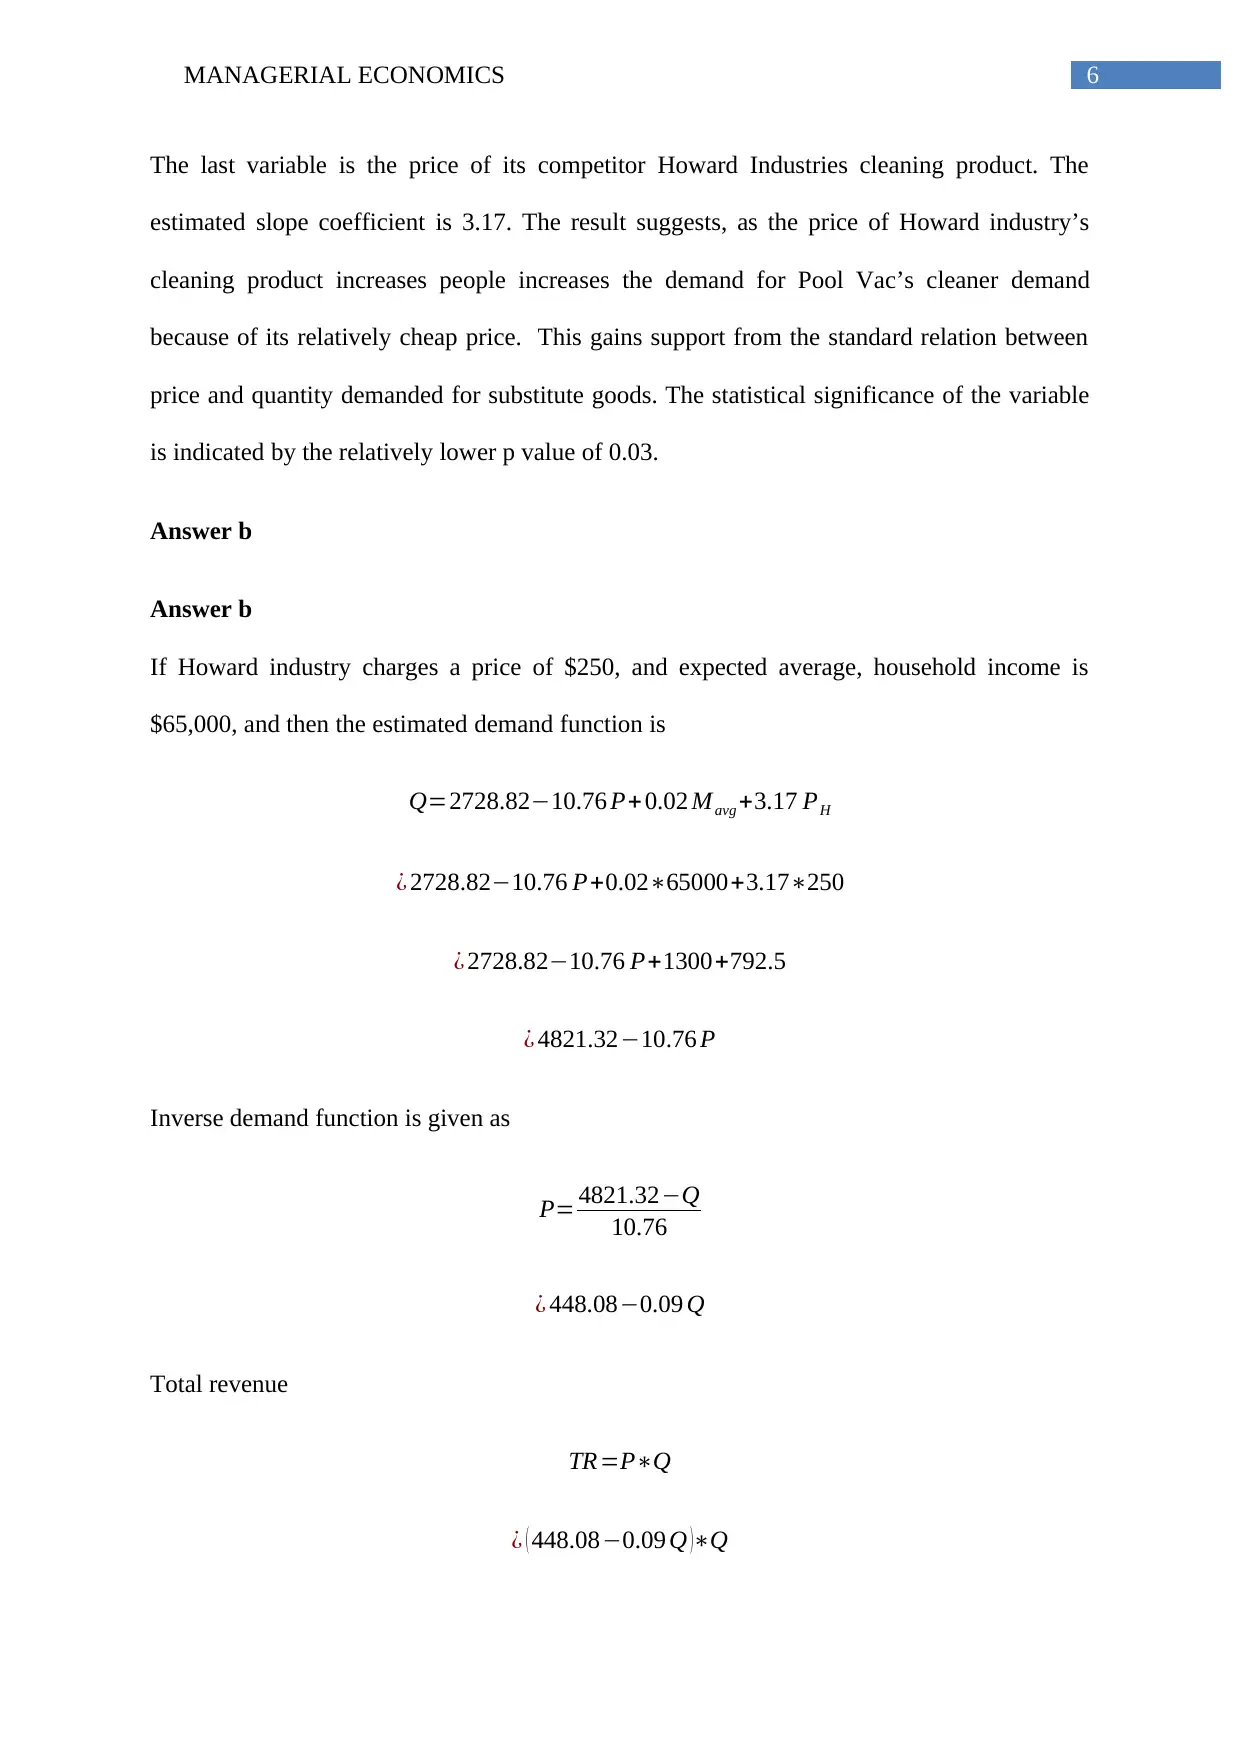
The last variable is the price of its competitor Howard Industries cleaning product. The
estimated slope coefficient is 3.17. The result suggests, as the price of Howard industry’s
cleaning product increases people increases the demand for Pool Vac’s cleaner demand
because of its relatively cheap price. This gains support from the standard relation between
price and quantity demanded for substitute goods. The statistical significance of the variable
is indicated by the relatively lower p value of 0.03.
Answer b
Answer b
If Howard industry charges a price of $250, and expected average, household income is
$65,000, and then the estimated demand function is
Q=2728.82−10.76 P+ 0.02 Mavg +3.17 PH
¿ 2728.82−10.76 P+0.02∗65000+3.17∗250
¿ 2728.82−10.76 P+1300+792.5
¿ 4821.32−10.76 P
Inverse demand function is given as
P= 4821.32−Q
10.76
¿ 448.08−0.09 Q
Total revenue
TR=P∗Q
¿ ( 448.08−0.09 Q )∗Q
Paraphrase This Document
Need a fresh take? Get an instant paraphrase of this document with our AI Paraphraser
7MANAGERIAL ECONOMICS
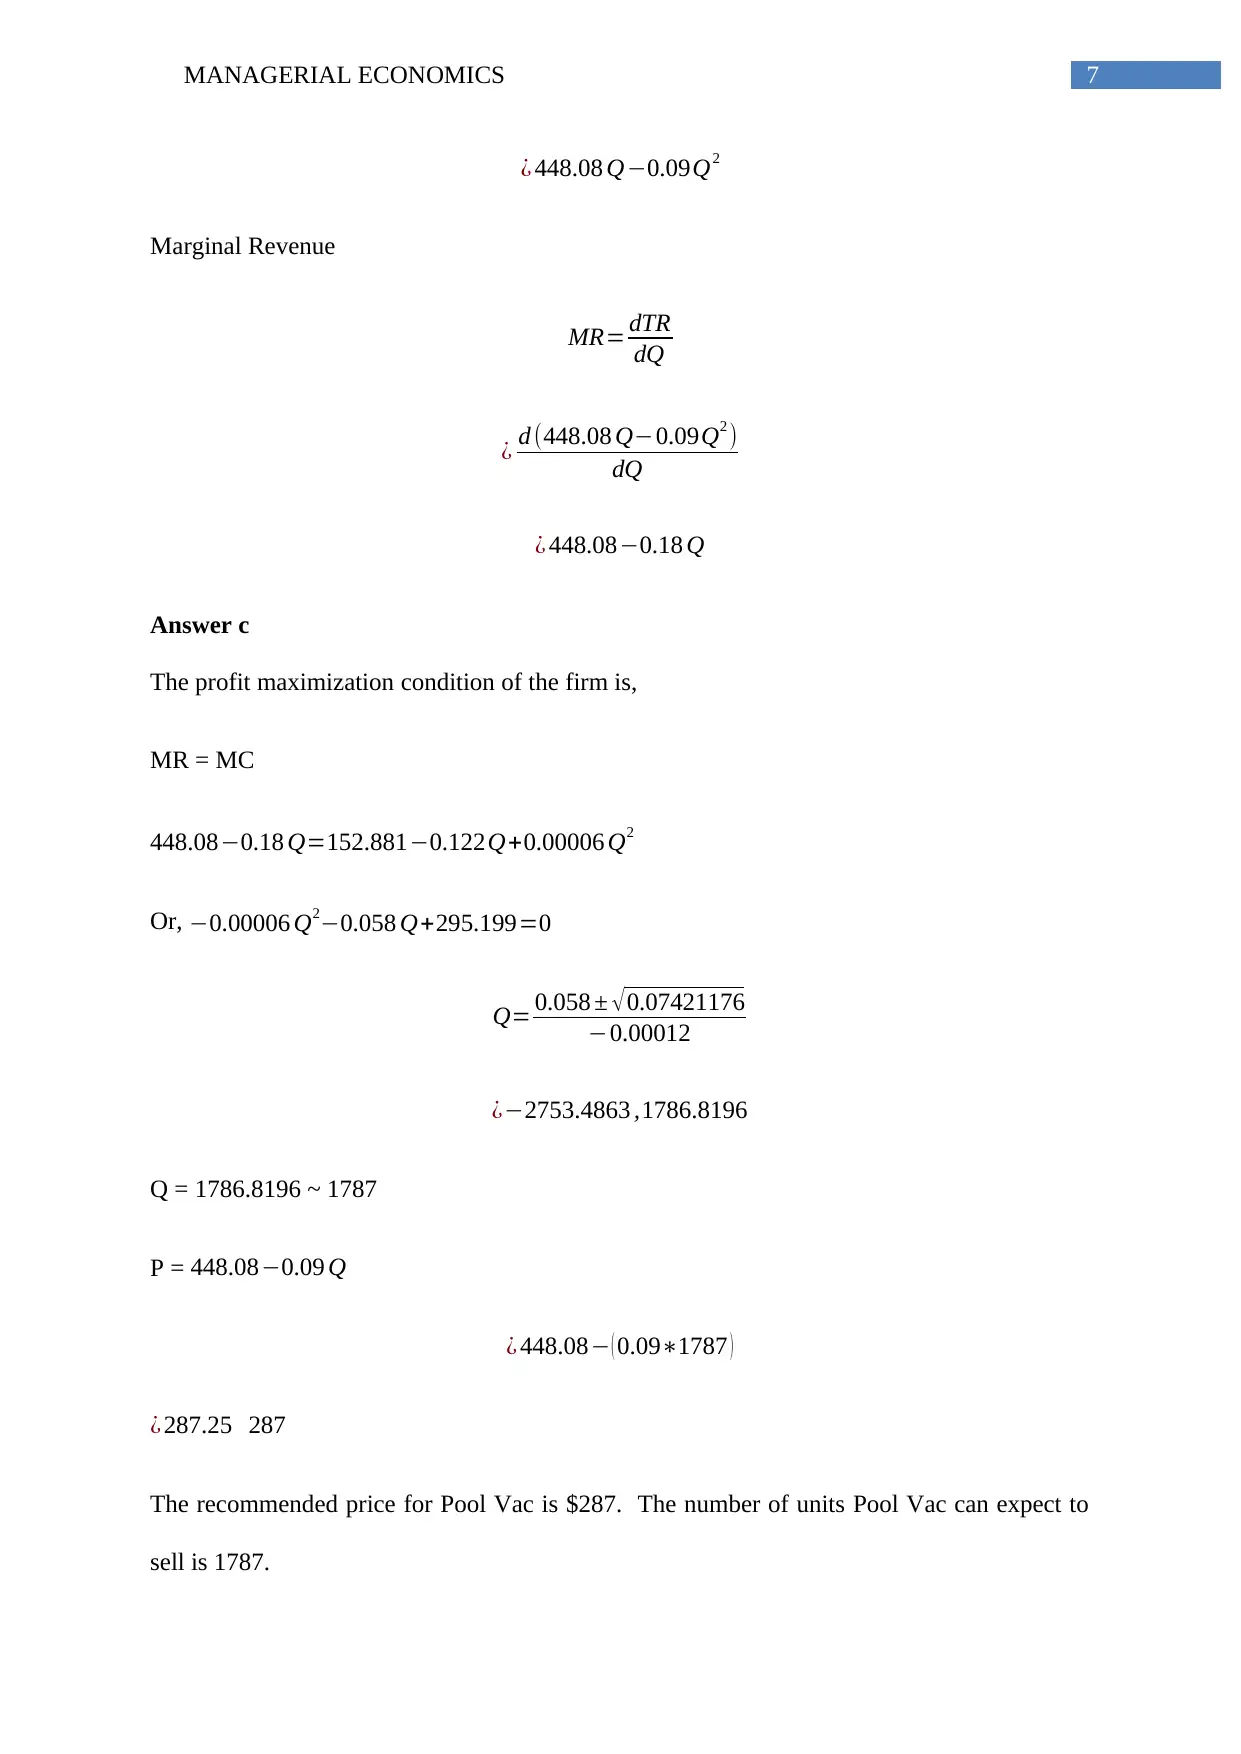
¿ 448.08 Q−0.09Q2
Marginal Revenue
MR= dTR
dQ
¿ d (448.08 Q−0.09Q2 )
dQ
¿ 448.08−0.18 Q
Answer c
The profit maximization condition of the firm is,
MR = MC
448.08−0.18 Q=152.881−0.122Q+0.00006 Q2
Or, −0.00006 Q2−0.058 Q+295.199=0
Q= 0.058 ± √ 0.07421176
−0.00012
¿−2753.4863 ,1786.8196
Q = 1786.8196 ~ 1787
P = 448.08−0.09 Q
¿ 448.08− ( 0.09∗1787 )
¿ 287.25 287
The recommended price for Pool Vac is $287. The number of units Pool Vac can expect to
sell is 1787.
8MANAGERIAL ECONOMICS
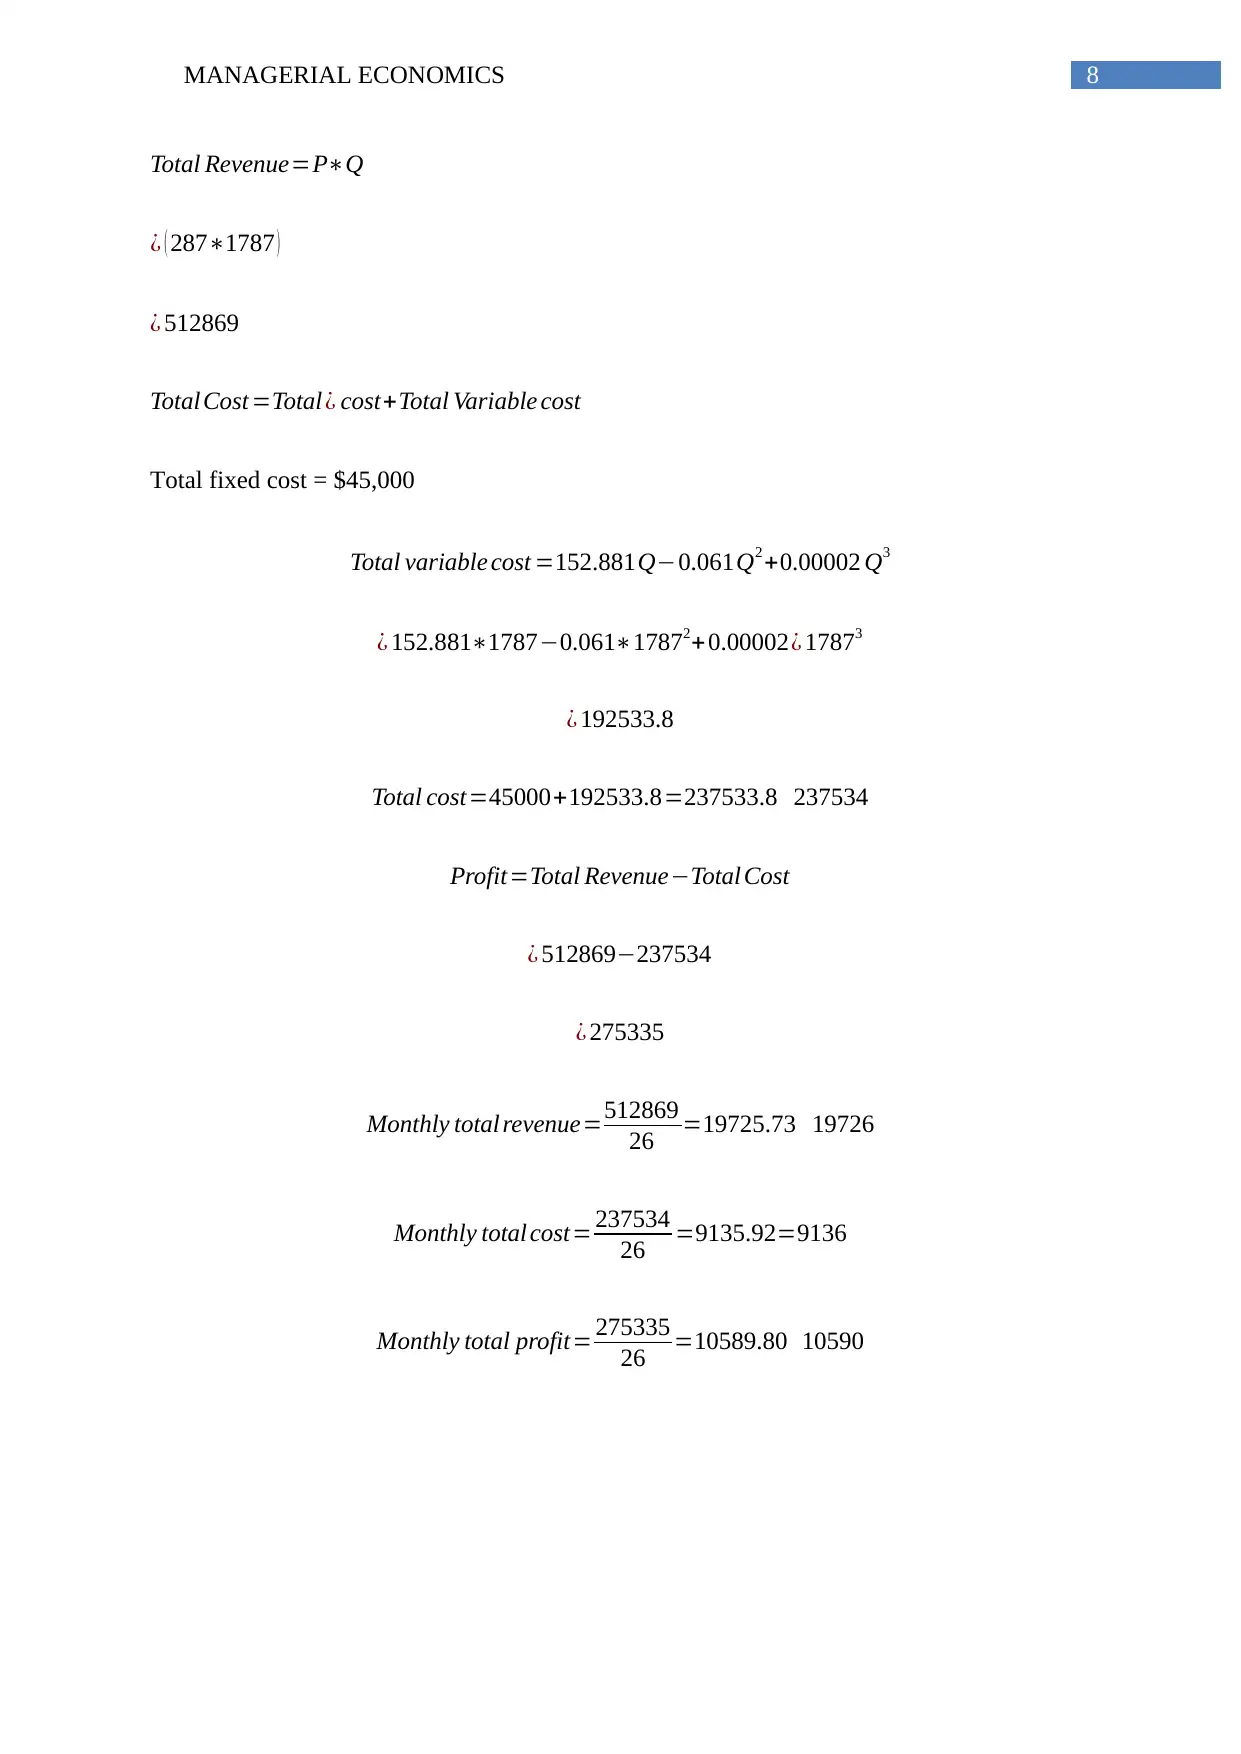
Total Revenue=P∗Q
¿ ( 287∗1787 )
¿ 512869
Total Cost =Total ¿ cost+Total Variable cost
Total fixed cost = $45,000
Total variable cost =152.881Q−0.061Q2 +0.00002 Q3
¿ 152.881∗1787−0.061∗17872+0.00002¿ 17873
¿ 192533.8
Total cost=45000+192533.8=237533.8 237534
Profit=Total Revenue−Total Cost
¿ 512869−237534
¿ 275335
Monthly total revenue=512869
26 =19725.73 19726
Monthly total cost= 237534
26 =9135.92=9136
Monthly total profit= 275335
26 =10589.80 10590
⊘ This is a preview!⊘
Do you want full access?
Subscribe today to unlock all pages.
Trusted by 1+ million students worldwide
9MANAGERIAL ECONOMICS
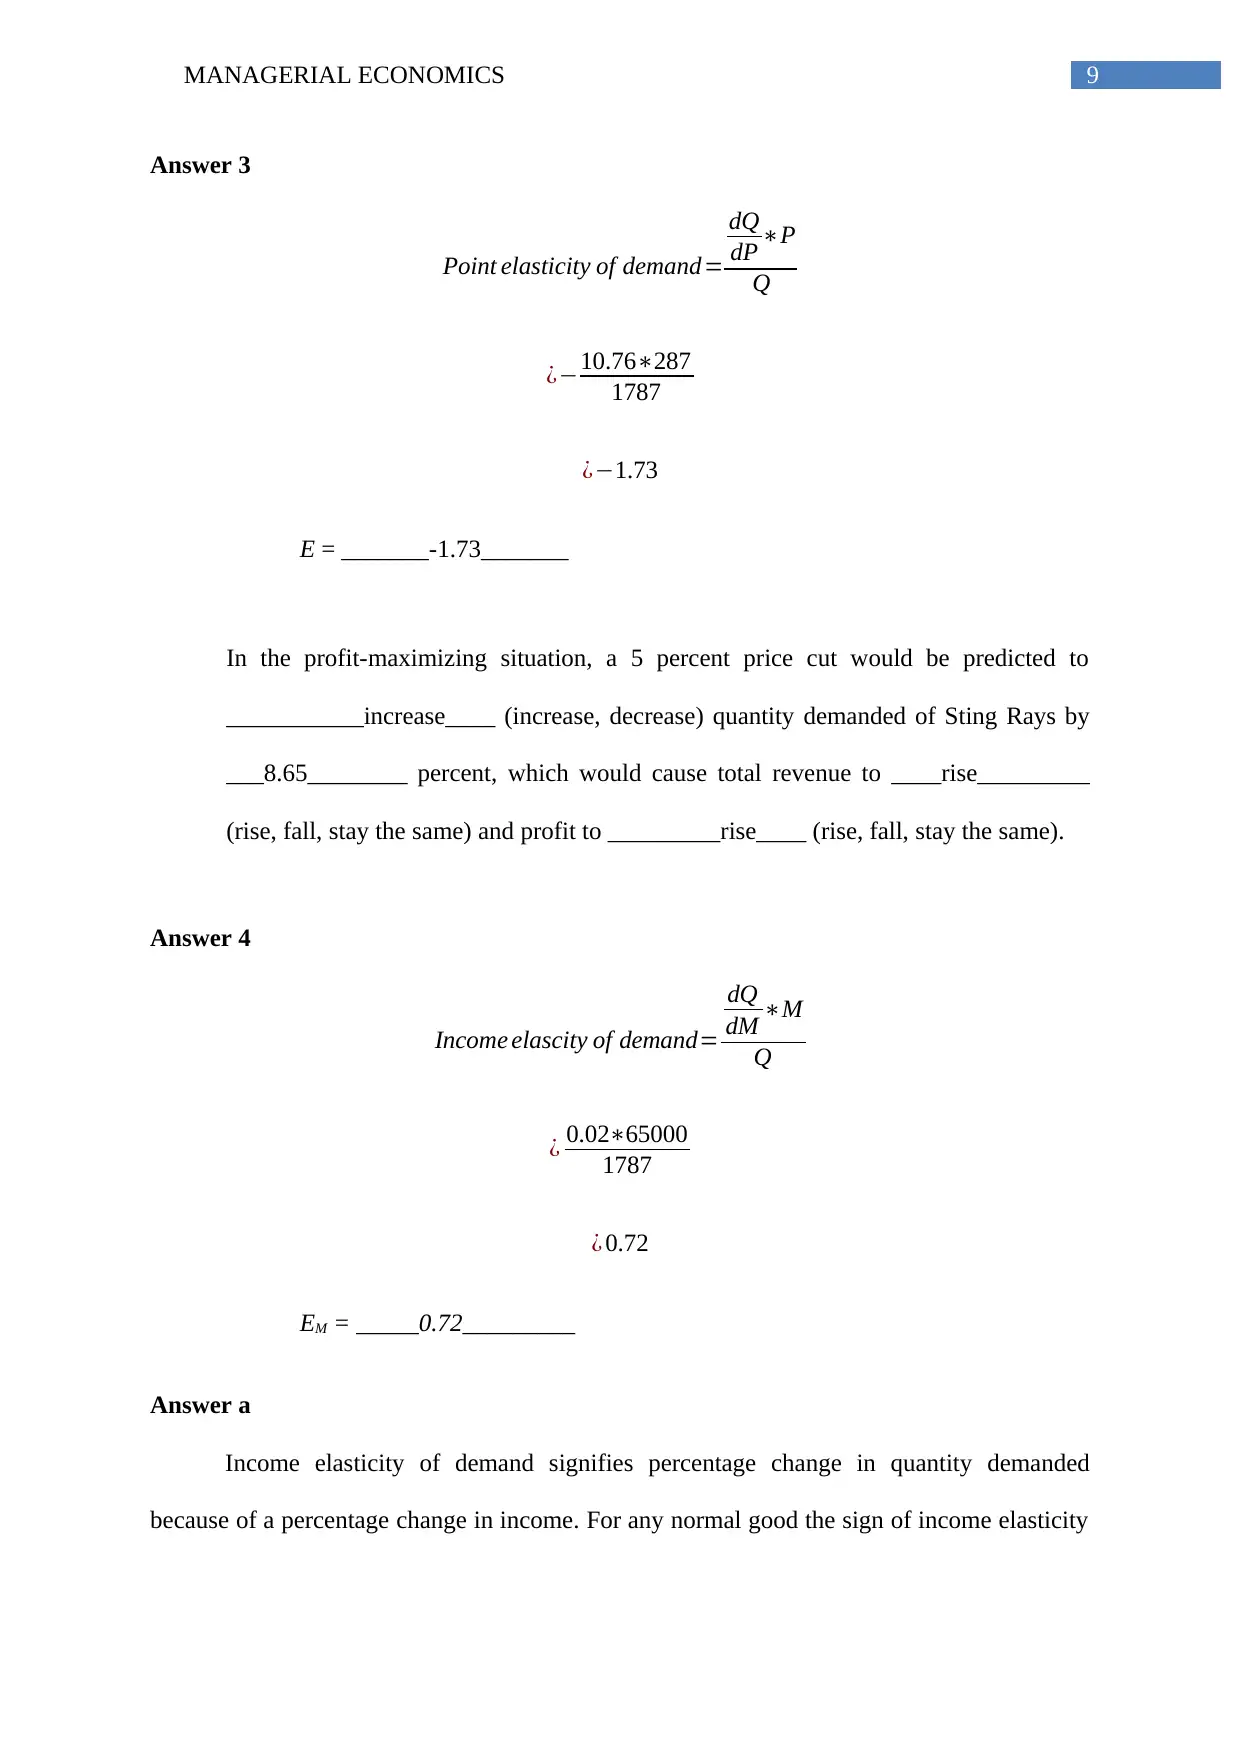
Answer 3
Point elasticity of demand=
dQ
dP ∗P
Q
¿−10.76∗287
1787
¿−1.73
E = _______-1.73_______
In the profit-maximizing situation, a 5 percent price cut would be predicted to
___________increase____ (increase, decrease) quantity demanded of Sting Rays by
___8.65________ percent, which would cause total revenue to ____rise_________
(rise, fall, stay the same) and profit to _________rise____ (rise, fall, stay the same).
Answer 4
Income elascity of demand=
dQ
dM ∗M
Q
¿ 0.02∗65000
1787
¿ 0.72
EM = _____0.72_________
Answer a
Income elasticity of demand signifies percentage change in quantity demanded
because of a percentage change in income. For any normal good the sign of income elasticity
Paraphrase This Document
Need a fresh take? Get an instant paraphrase of this document with our AI Paraphraser
10MANAGERIAL ECONOMICS
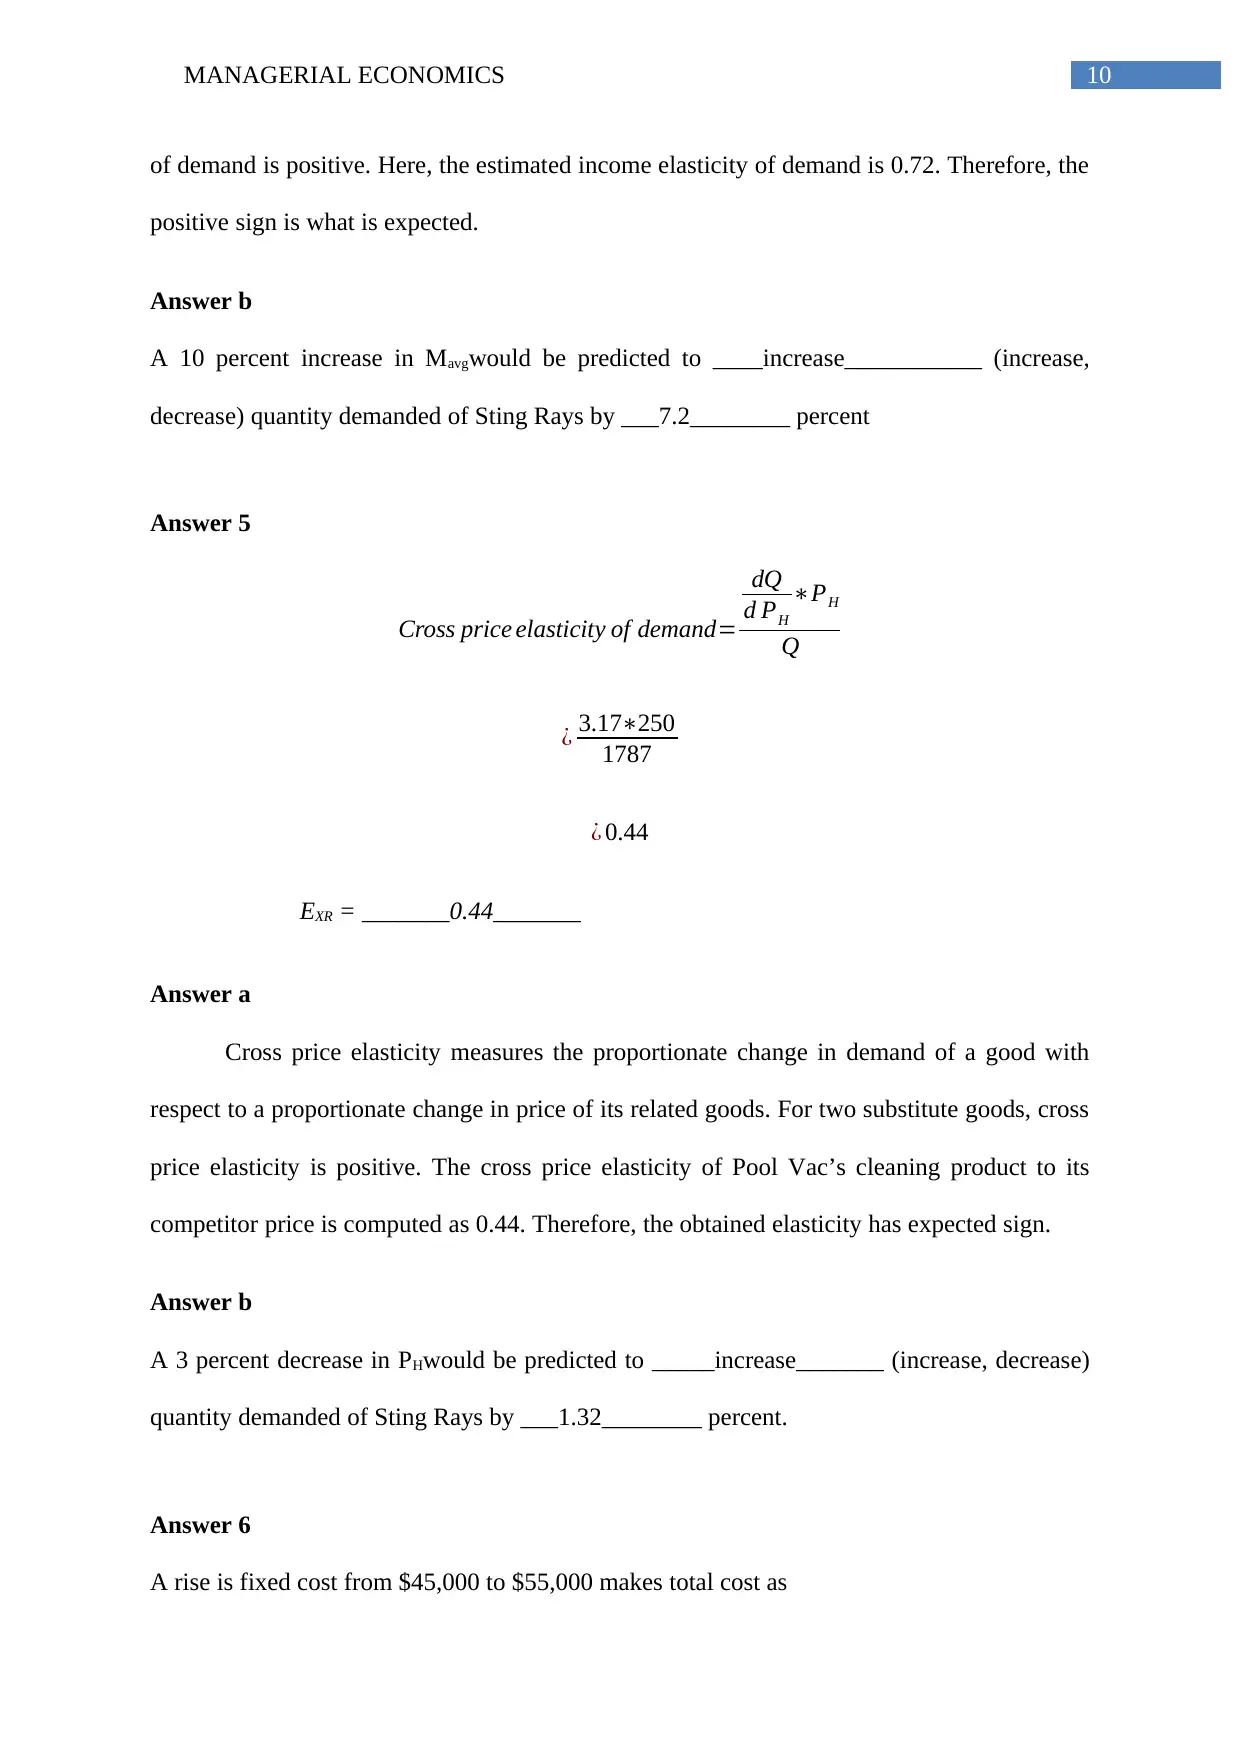
of demand is positive. Here, the estimated income elasticity of demand is 0.72. Therefore, the
positive sign is what is expected.
Answer b
A 10 percent increase in Mavgwould be predicted to ____increase___________ (increase,
decrease) quantity demanded of Sting Rays by ___7.2________ percent
Answer 5
Cross price elasticity of demand=
dQ
d PH
∗PH
Q
¿ 3.17∗250
1787
¿ 0.44
EXR = _______0.44_______
Answer a
Cross price elasticity measures the proportionate change in demand of a good with
respect to a proportionate change in price of its related goods. For two substitute goods, cross
price elasticity is positive. The cross price elasticity of Pool Vac’s cleaning product to its
competitor price is computed as 0.44. Therefore, the obtained elasticity has expected sign.
Answer b
A 3 percent decrease in PHwould be predicted to _____increase_______ (increase, decrease)
quantity demanded of Sting Rays by ___1.32________ percent.
Answer 6
A rise is fixed cost from $45,000 to $55,000 makes total cost as
11MANAGERIAL ECONOMICS
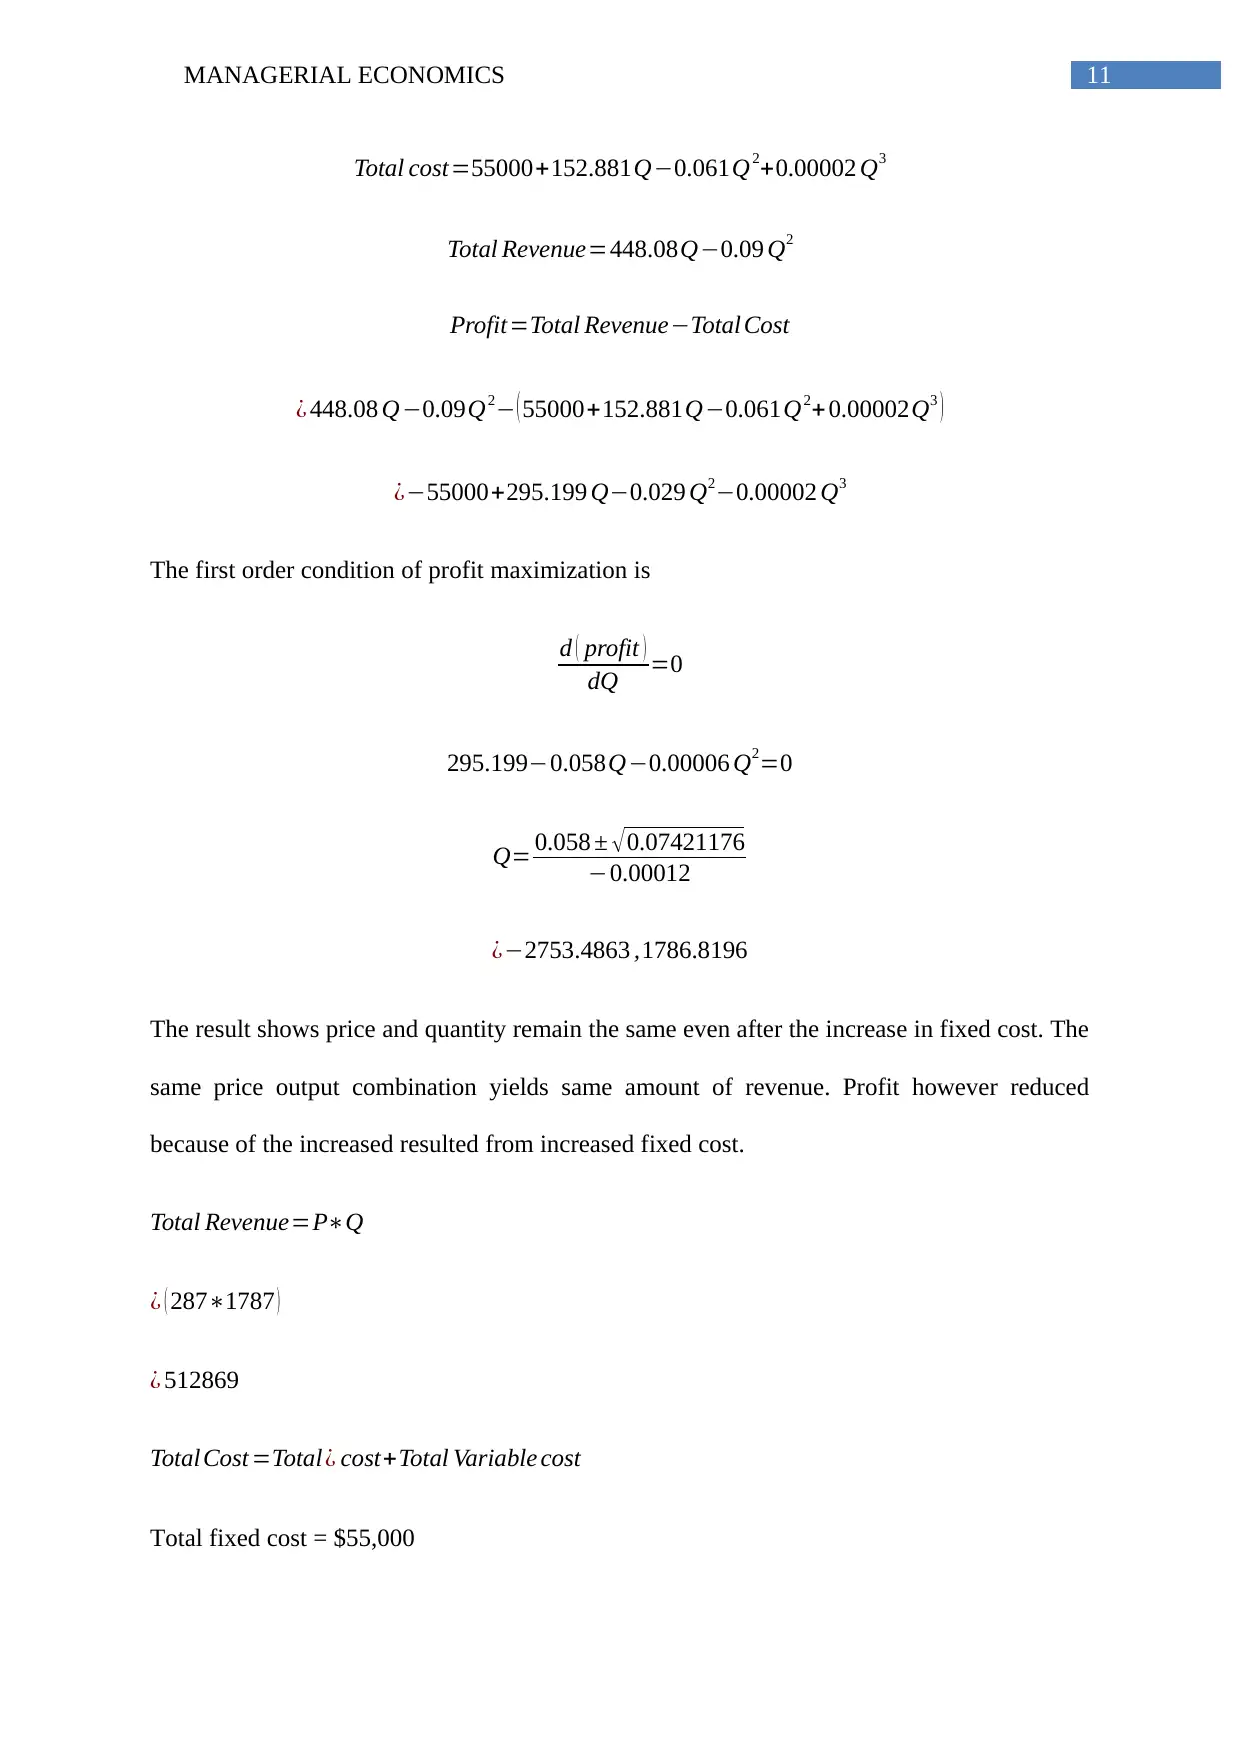
Total cost=55000+152.881Q−0.061Q2+0.00002 Q3
Total Revenue=448.08Q−0.09 Q2
Profit=Total Revenue−Total Cost
¿ 448.08 Q−0.09Q2− ( 55000+152.881Q−0.061Q2+0.00002Q3 )
¿−55000+295.199 Q−0.029 Q2−0.00002 Q3
The first order condition of profit maximization is
d ( profit )
dQ =0
295.199−0.058Q−0.00006 Q2=0
Q= 0.058 ± √ 0.07421176
−0.00012
¿−2753.4863 ,1786.8196
The result shows price and quantity remain the same even after the increase in fixed cost. The
same price output combination yields same amount of revenue. Profit however reduced
because of the increased resulted from increased fixed cost.
Total Revenue=P∗Q
¿ ( 287∗1787 )
¿ 512869
Total Cost =Total¿ cost+Total Variable cost
Total fixed cost = $55,000
⊘ This is a preview!⊘
Do you want full access?
Subscribe today to unlock all pages.
Trusted by 1+ million students worldwide
1 out of 14
Related Documents


Your All-in-One AI-Powered Toolkit for Academic Success.
+13062052269
info@desklib.com
Available 24*7 on WhatsApp / Email
![[object Object]](/_next/static/media/star-bottom.7253800d.svg)
Unlock your academic potential
Copyright © 2020–2026 A2Z Services. All Rights Reserved. Developed and managed by ZUCOL.