Managerial Economics Assignment - Analysis of Market Dynamics
VerifiedAdded on 2020/10/05
|20
|5343
|72
Homework Assignment
AI Summary
This managerial economics assignment delves into core concepts such as demand and supply curves, equilibrium price and quantity, and the characteristics of a perfectly competitive market. The assignment explores the impact of various events on market dynamics, including changes in journalist salaries and the price of cotton. It also examines market structures, particularly perfect competition, outlining its key features with examples. Furthermore, the assignment calculates and interprets the elasticity of demand for different scenarios, including Jacky's and Katy's cases. It concludes by discussing government interventions to address market failures, such as the use of taxes, subsidies, regulations, and price controls. The assignment also covers supply schedules, factors affecting supply, and pricing policies within the UAE telecom industry, including profit maximization strategies in an oligopoly market.

TOPIC:
Managerial economics
Managerial economics
Paraphrase This Document
Need a fresh take? Get an instant paraphrase of this document with our AI Paraphraser
TABLE OF CONTENTS
INTRODUCTION...........................................................................................................................1
SECTION “A”.................................................................................................................................1
1. Showing the effect of demand curve, supply curve, equilibrium price and equilibrium
quantity with the help of diagram in different event...................................................................1
2. Features of perfect competition market with examples..........................................................4
3. Graphical representation of a point at which a firm should stop hiring the workers in a
perfect competitive market and characteristics of the market form............................................5
Q.4 COMPUTATION OF ELASTICITY..................................................................................1
5.) Explaining four tools available for government interventions to deal with market features.2
5.) Explaining four tools available for government interventions to deal with market features.2
CONCLUSION................................................................................................................................3
SECTION B.....................................................................................................................................5
1. a) Discussing supply schedule and factors affecting supply in the market.............................5
1. b) Perfectly inelastic demand and effect on supply due to technological innovation.............6
2. a) Characteristics of market in UAE telecom industry..........................................................8
2.b) Describing and analysing the pricing policies in oligopoly market.....................................8
2.c) Profit maximization strategy ...............................................................................................9
REFERENCES..............................................................................................................................11
INTRODUCTION
Managerial economics is the practise of applying economic theories to the field of
management. It assists the managers in identifying rational and optimum way of adjusting to
change in the business environment. The present report will cover concepts of effect of demand,
supply, equilibrium price and quantity of various cases, features of perfect competition market,
computation of demand elasticity. The assignment will also highlight different tools that
government could use for dealing with market failures in section A. Further in section B , it will
discuss supply schedule and factors affecting supply in the market. Pricing policies, profit
maximization strategy will be discussed for telecom industry of UAE.
SECTION “A”
1. Showing the effect of demand curve, supply curve, equilibrium price and equilibrium quantity
with the help of diagram in different event.
Demand curve:
A demand curve is can be defined as a way of transforming the information about change
in the demand of a product or services due to occurrence of any specific event (Chow and Niu,
2015). It can also be termed as the graphical presentation of providing information about the
relationship between change in demand of product or services and change in price over a specific
time period.
Supply curve:
Supply curve refers to a graphical representation of showing relationship between cost of
products and its effect on the quantity of supply. In this curve the cost of product is plotted
Equilibrium price
Equilibrium price is the level of price at which the demand and supply of the product and
services become equal (Mandl and et.al., 2015). At this stage, both supplier and consumer of the
product or services gets equal level of satisfaction.
Equilibrium quantity
Same as the equilibrium price, the equilibrium quantity can be defined as the level at
which quantity of product demanded and supplied become equal. In a graphical presentation, the
equilibrium can be found at the point at which both supply curve and demand curve meet.
A) The market for newspapers in Kuwait
Case 1. increase in salary of the journalist
1
⊘ This is a preview!⊘
Do you want full access?
Subscribe today to unlock all pages.
Trusted by 1+ million students worldwide
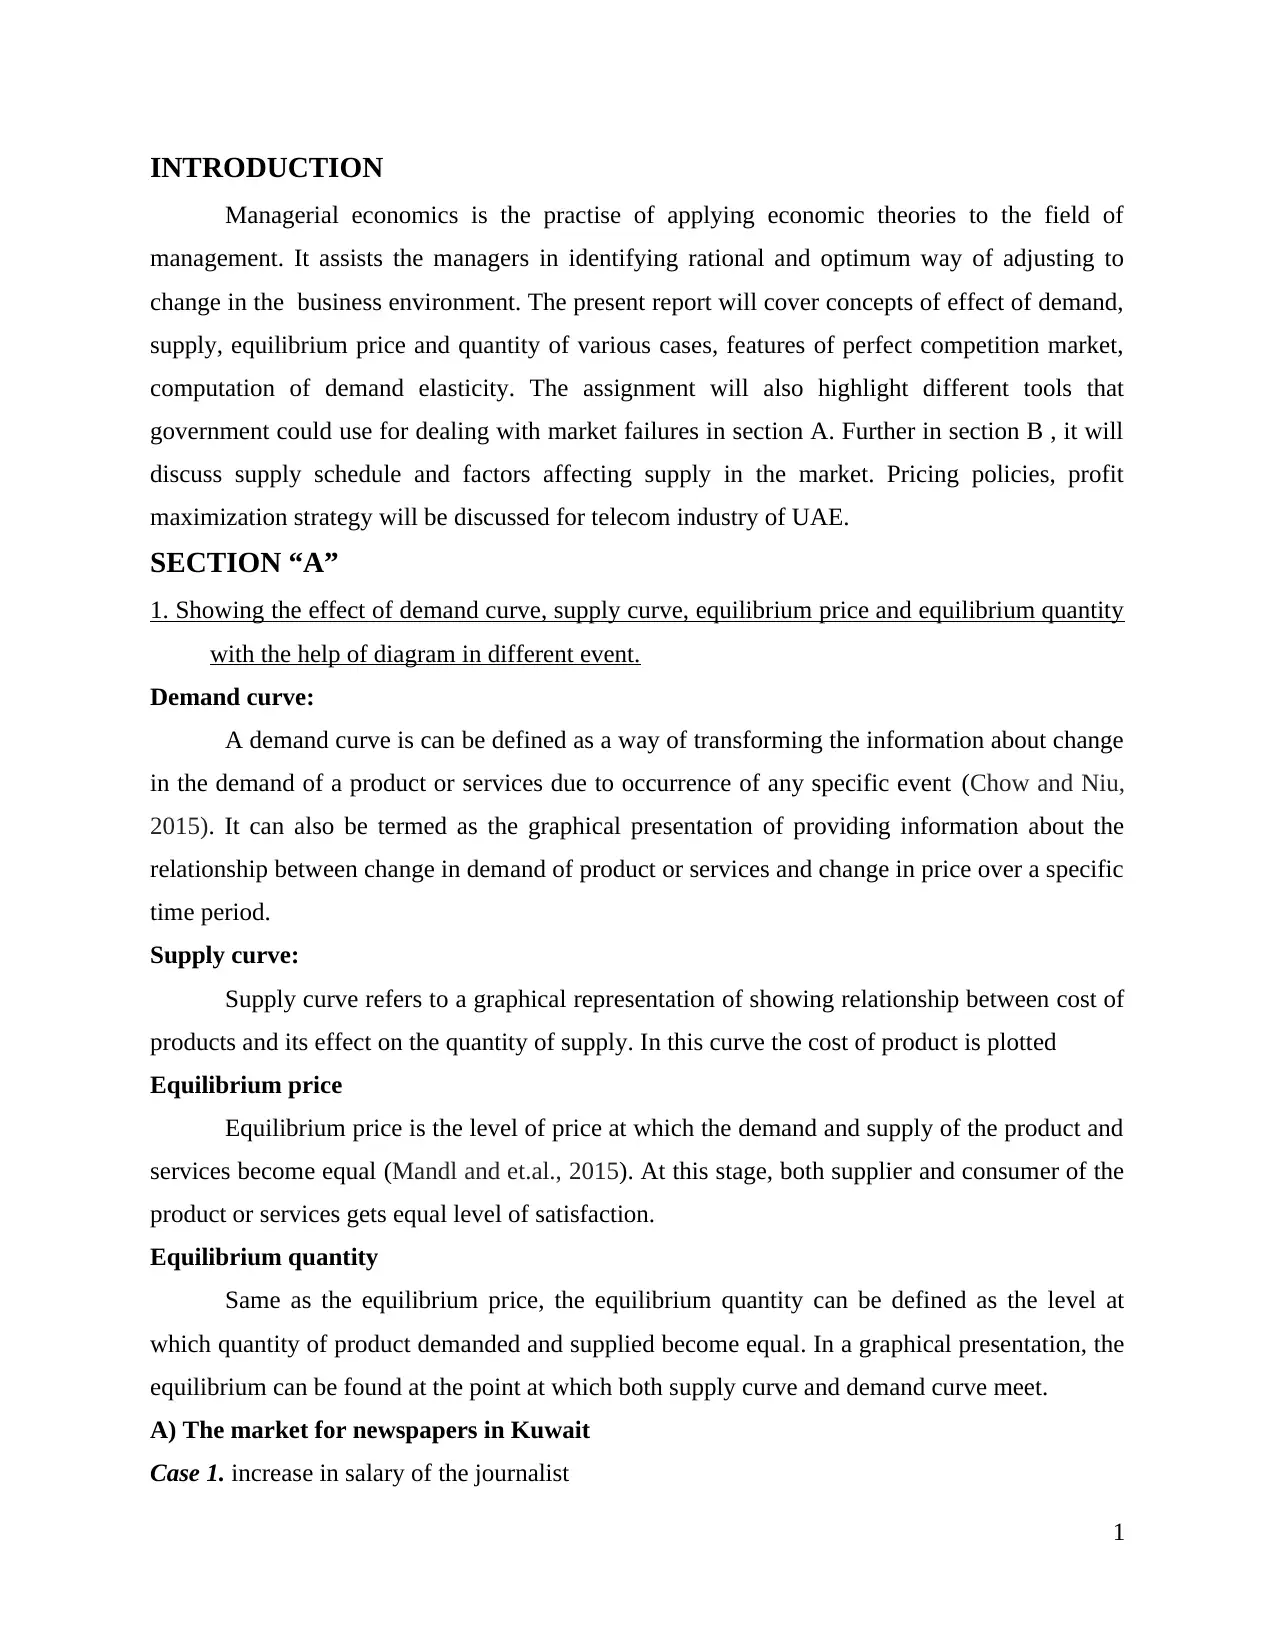
Case 2. Including a big news event in the news paper.
Interpretation:
Due to first case of increasing the salary of journalist, the cost of the newspaper would
increase which may effect the supply of the newspaper, on the other hand, due to including a
news about a bing event the demand of newspaper may increase.
The point where the demand curve and the supply curve are meeting shows the
equilibrium price and quantity of the newspapers.
B) Market for St. Louis Rams ( a professional football team) cotton T-shirts.
Case 1. Ram win the super bowl competition
Case 2 The price of cotton increase
Interpretation:
The above graph shows that winning the competition by Ram increased the craze of
football t shirts in the market that will increase the demand of the T-shirts. On the other hand,
due to increase in the cotton price, the cost of the firm will increase which may effect the supply
of the product. In the regard, the equilibrium price and quantity of the product.
2
Interpretation:
Due to first case of increasing the salary of journalist, the cost of the newspaper would
increase which may effect the supply of the newspaper, on the other hand, due to including a
news about a bing event the demand of newspaper may increase.
The point where the demand curve and the supply curve are meeting shows the
equilibrium price and quantity of the newspapers.
B) Market for St. Louis Rams ( a professional football team) cotton T-shirts.
Case 1. Ram win the super bowl competition
Case 2 The price of cotton increase
Interpretation:
The above graph shows that winning the competition by Ram increased the craze of
football t shirts in the market that will increase the demand of the T-shirts. On the other hand,
due to increase in the cotton price, the cost of the firm will increase which may effect the supply
of the product. In the regard, the equilibrium price and quantity of the product.
2
Paraphrase This Document
Need a fresh take? Get an instant paraphrase of this document with our AI Paraphraser
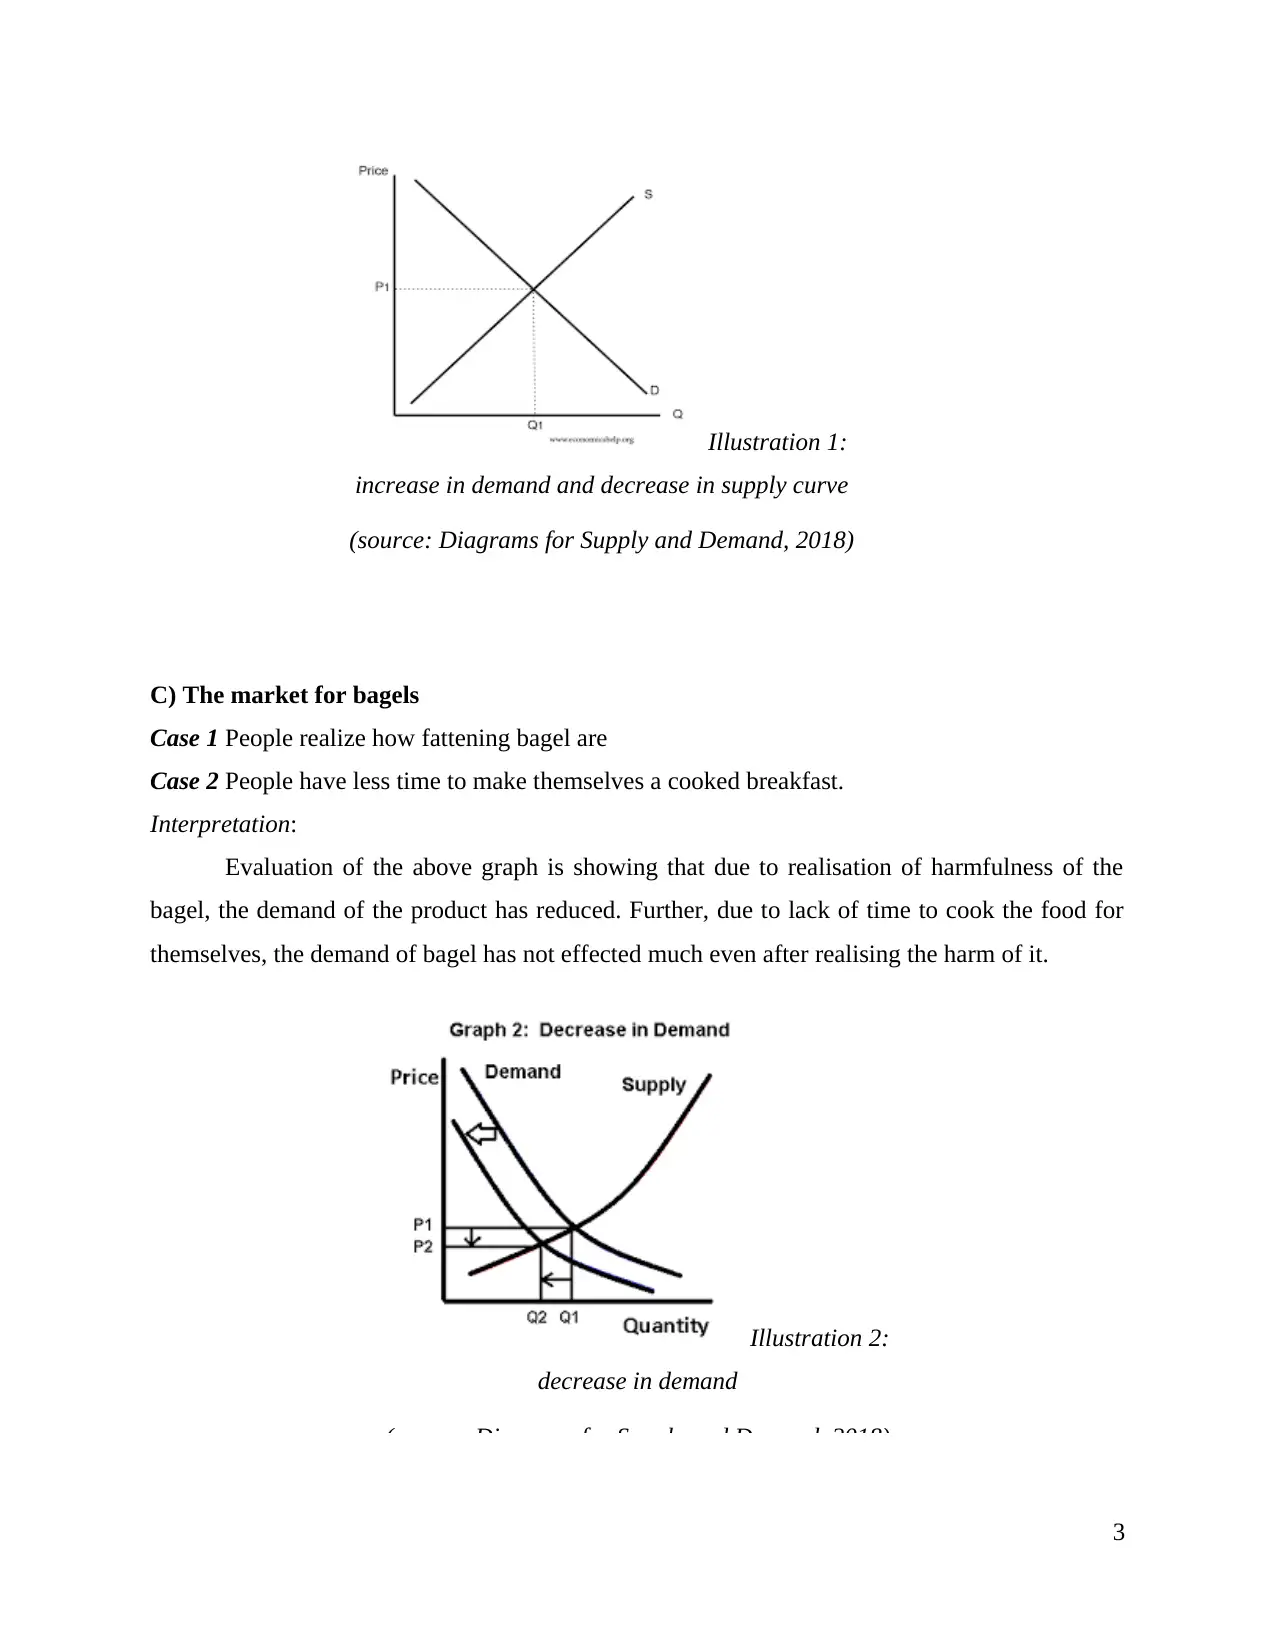
C) The market for bagels
Case 1 People realize how fattening bagel are
Case 2 People have less time to make themselves a cooked breakfast.
Interpretation:
Evaluation of the above graph is showing that due to realisation of harmfulness of the
bagel, the demand of the product has reduced. Further, due to lack of time to cook the food for
themselves, the demand of bagel has not effected much even after realising the harm of it.
3
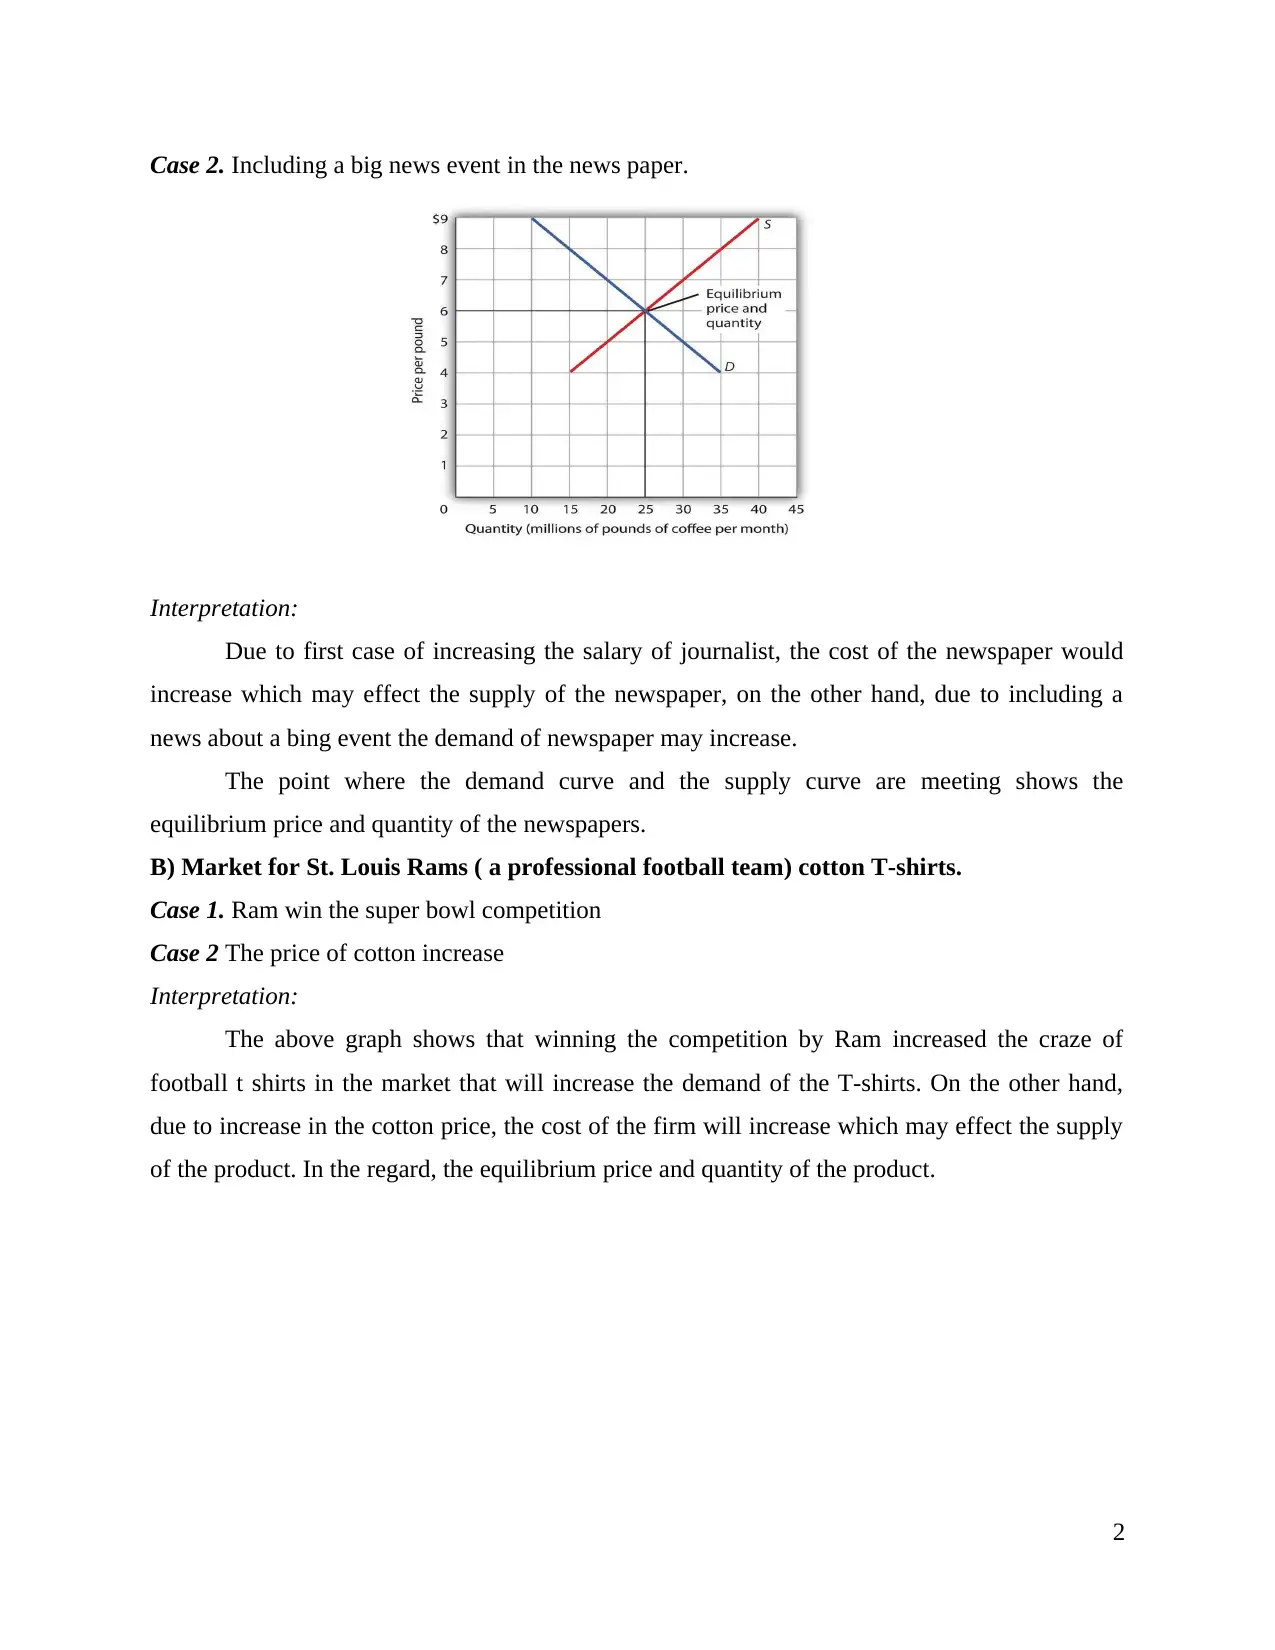
Illustration 1:
increase in demand and decrease in supply curve
(source: Diagrams for Supply and Demand, 2018)
Illustration 2:
decrease in demand
(source: Diagrams for Supply and Demand, 2018)
Case 1 People realize how fattening bagel are
Case 2 People have less time to make themselves a cooked breakfast.
Interpretation:
Evaluation of the above graph is showing that due to realisation of harmfulness of the
bagel, the demand of the product has reduced. Further, due to lack of time to cook the food for
themselves, the demand of bagel has not effected much even after realising the harm of it.
3
Illustration 1:
increase in demand and decrease in supply curve
(source: Diagrams for Supply and Demand, 2018)
Illustration 2:
decrease in demand
(source: Diagrams for Supply and Demand, 2018)
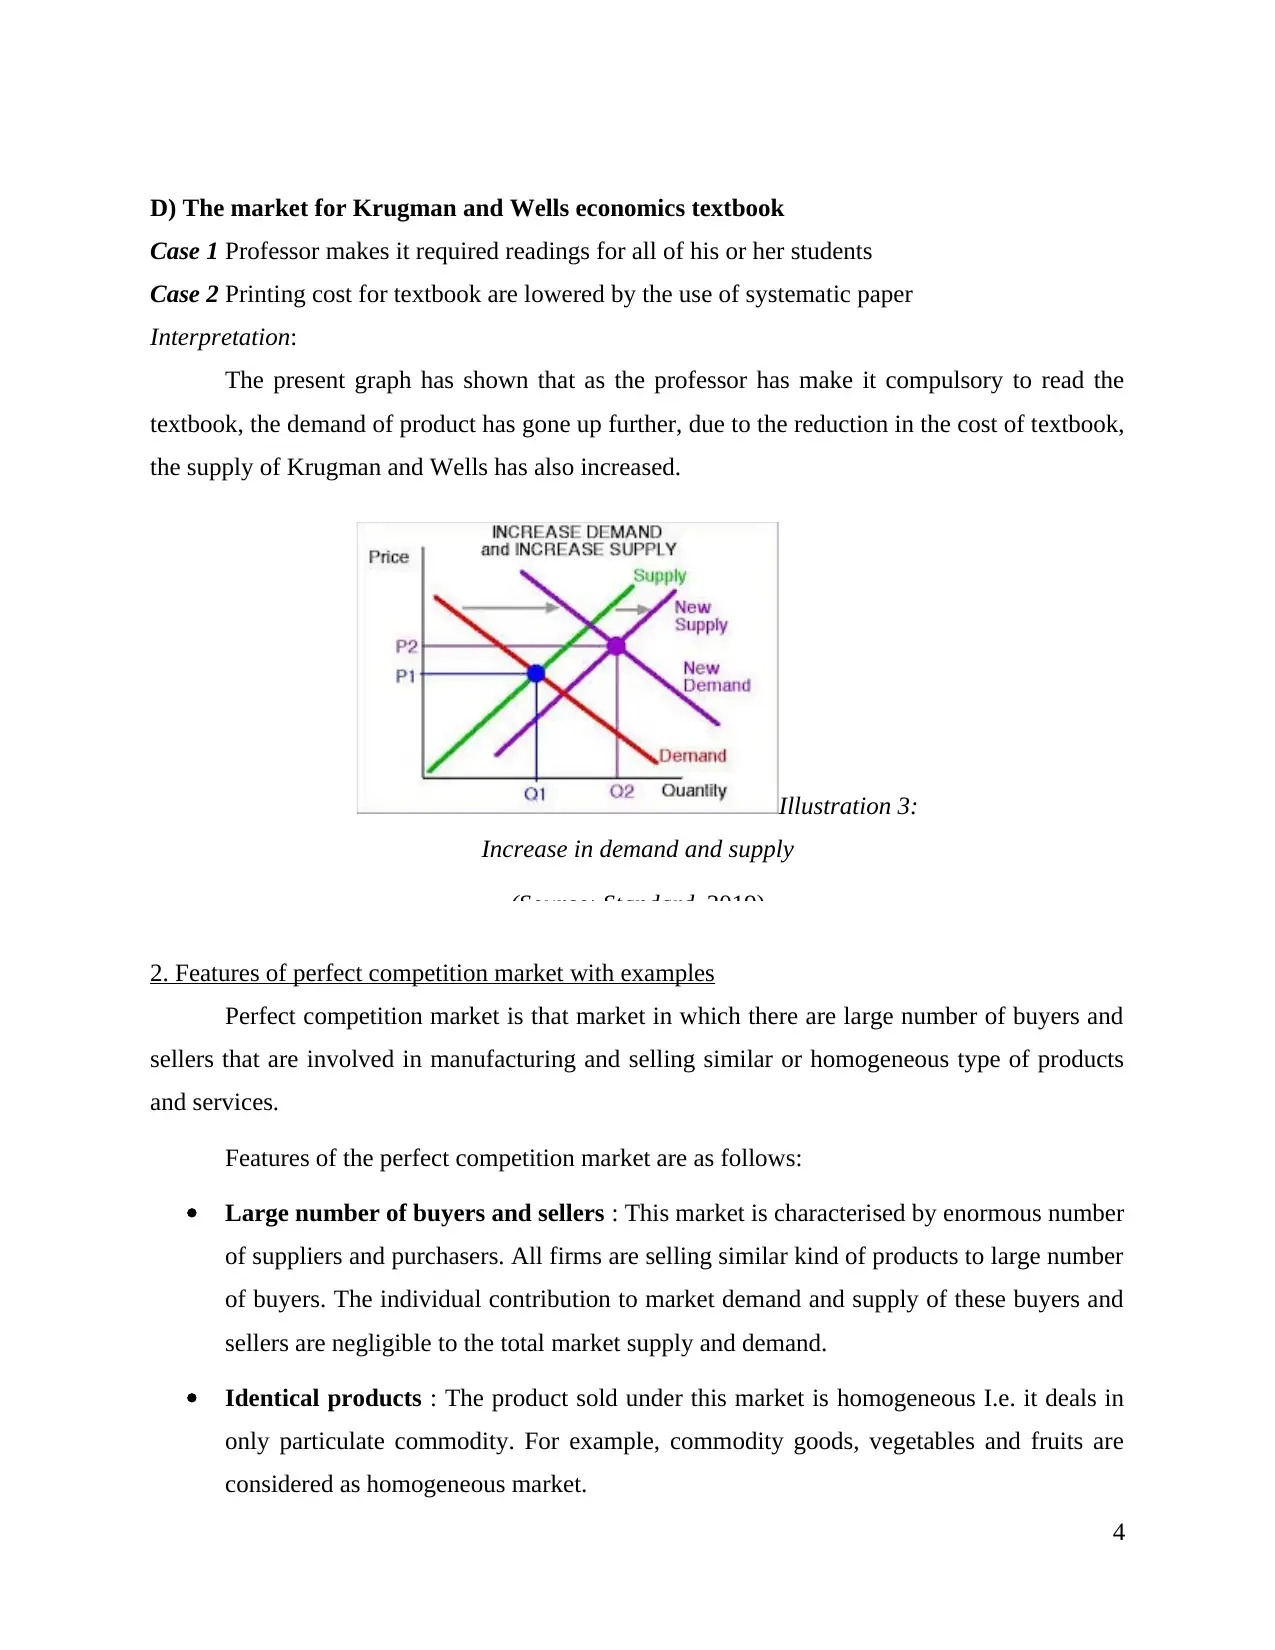
D) The market for Krugman and Wells economics textbook
Case 1 Professor makes it required readings for all of his or her students
Case 2 Printing cost for textbook are lowered by the use of systematic paper
Interpretation:
The present graph has shown that as the professor has make it compulsory to read the
textbook, the demand of product has gone up further, due to the reduction in the cost of textbook,
the supply of Krugman and Wells has also increased.
2. Features of perfect competition market with examples
Perfect competition market is that market in which there are large number of buyers and
sellers that are involved in manufacturing and selling similar or homogeneous type of products
and services.
Features of the perfect competition market are as follows:
Large number of buyers and sellers : This market is characterised by enormous number
of suppliers and purchasers. All firms are selling similar kind of products to large number
of buyers. The individual contribution to market demand and supply of these buyers and
sellers are negligible to the total market supply and demand.
Identical products : The product sold under this market is homogeneous I.e. it deals in
only particulate commodity. For example, commodity goods, vegetables and fruits are
considered as homogeneous market.
4
Illustration 3:
Increase in demand and supply
(Source: Standard, 2019)
⊘ This is a preview!⊘
Do you want full access?
Subscribe today to unlock all pages.
Trusted by 1+ million students worldwide
Free entry and exits : There are no restrictions on entering or leaving the market, a firm
can at anytime enter and exit the trading place. An small vendor can open up a shop of
vegetables and fruits and leave the market anytime it wants to (Azevedo and
Gottlieb ,2017).
Perfect knowledge of market : Buyers and suppliers have all the necessary information
about the prices of the product at which it is sold and bought in the market. This assist in
bringing uniformity in prices of goods. For instance, people know the average of
vegetables and fruits based upon which trading takes place in this market.
Absence of transport cost : Another feature of perfect competition market is absence of
transport cost. There should be no or very negligible transport cost for maintaining the
uniformity in the price of commodity. For instance, a supplier incurring too much on
transportation will sell its product on high prices which will not be accepted buyers in
this market and will very easily switch to other seller because there exist only one price
for a commodity (Lamantia and Radi, 2018).
3. Graphical representation of a point at which a firm should stop hiring the workers in a perfect
competitive market and characteristics of the market form
Market form
Market form also termed as the market structure, can be defined as the a nature and
volume of competition available in the market for various products and services (Basu and
Bundick, 2017). The market structure can be of various types like oligopoly market, monopoly
market, natural market, monopoly market, etc. each market form helps the company in framing
the best policies and strategies for the business, as, the market competition of the company
majorly depends upon the type of market structure in which the company is operating its
business activities.
The major characteristics of the market form are as under:
Number of sellers: It is a major characteristics of market structure. Number of sellers
differs in each type of market forms. For example, in pure competitive market, there
large number of sellers as compare to oligopoly market where there are only few number
of firms that sales the same product or services (Glasserman and Nouri, 2016). On the
other hand, in pure monopolistic market, there is only single seller in all over the market.
5
Paraphrase This Document
Need a fresh take? Get an instant paraphrase of this document with our AI Paraphraser
Number of buyers: It is also a key characteristic of the market forms. Each type of
market structure have different number of buyers. Like, in pure and monopolistic market,
there are large number of buyer. Whereas number of buyers of oligopoly and pure
monopoly market can not be specified. This characteristic effects the policies and
procedures of the organisation.
Barriers of entry: Barriers are the difficulties that may arise at the time of entering into
any market. Each market have its own barriers for the business. In monopolistic
competitive market, there is small volume of entry (Jensen and et.al., 2016). Whereas, in
the the oligopoly market, and pure monopoly market, a huge amount of berries are
available.
Amount of competition: The amount of competition is a key characteristic of each
market structure. The business of any firm and its profitability depends upon the amount
and degree of competition of the market in which it is doing its business.
Harmonisation of products: It refers to a quality of product for being a substitute of the
another product in the market. It influences the amount of competition of the market. In
case of pure competition, each product or services are homogeneous to each other.
Whereas, in the monopolistic competition, the products or services of one firm are
different from each other.
In this regard, it can be analysed that there are several types of markets i.e. market forms.
Each market have its own characteristics that makes them different from each other.
6
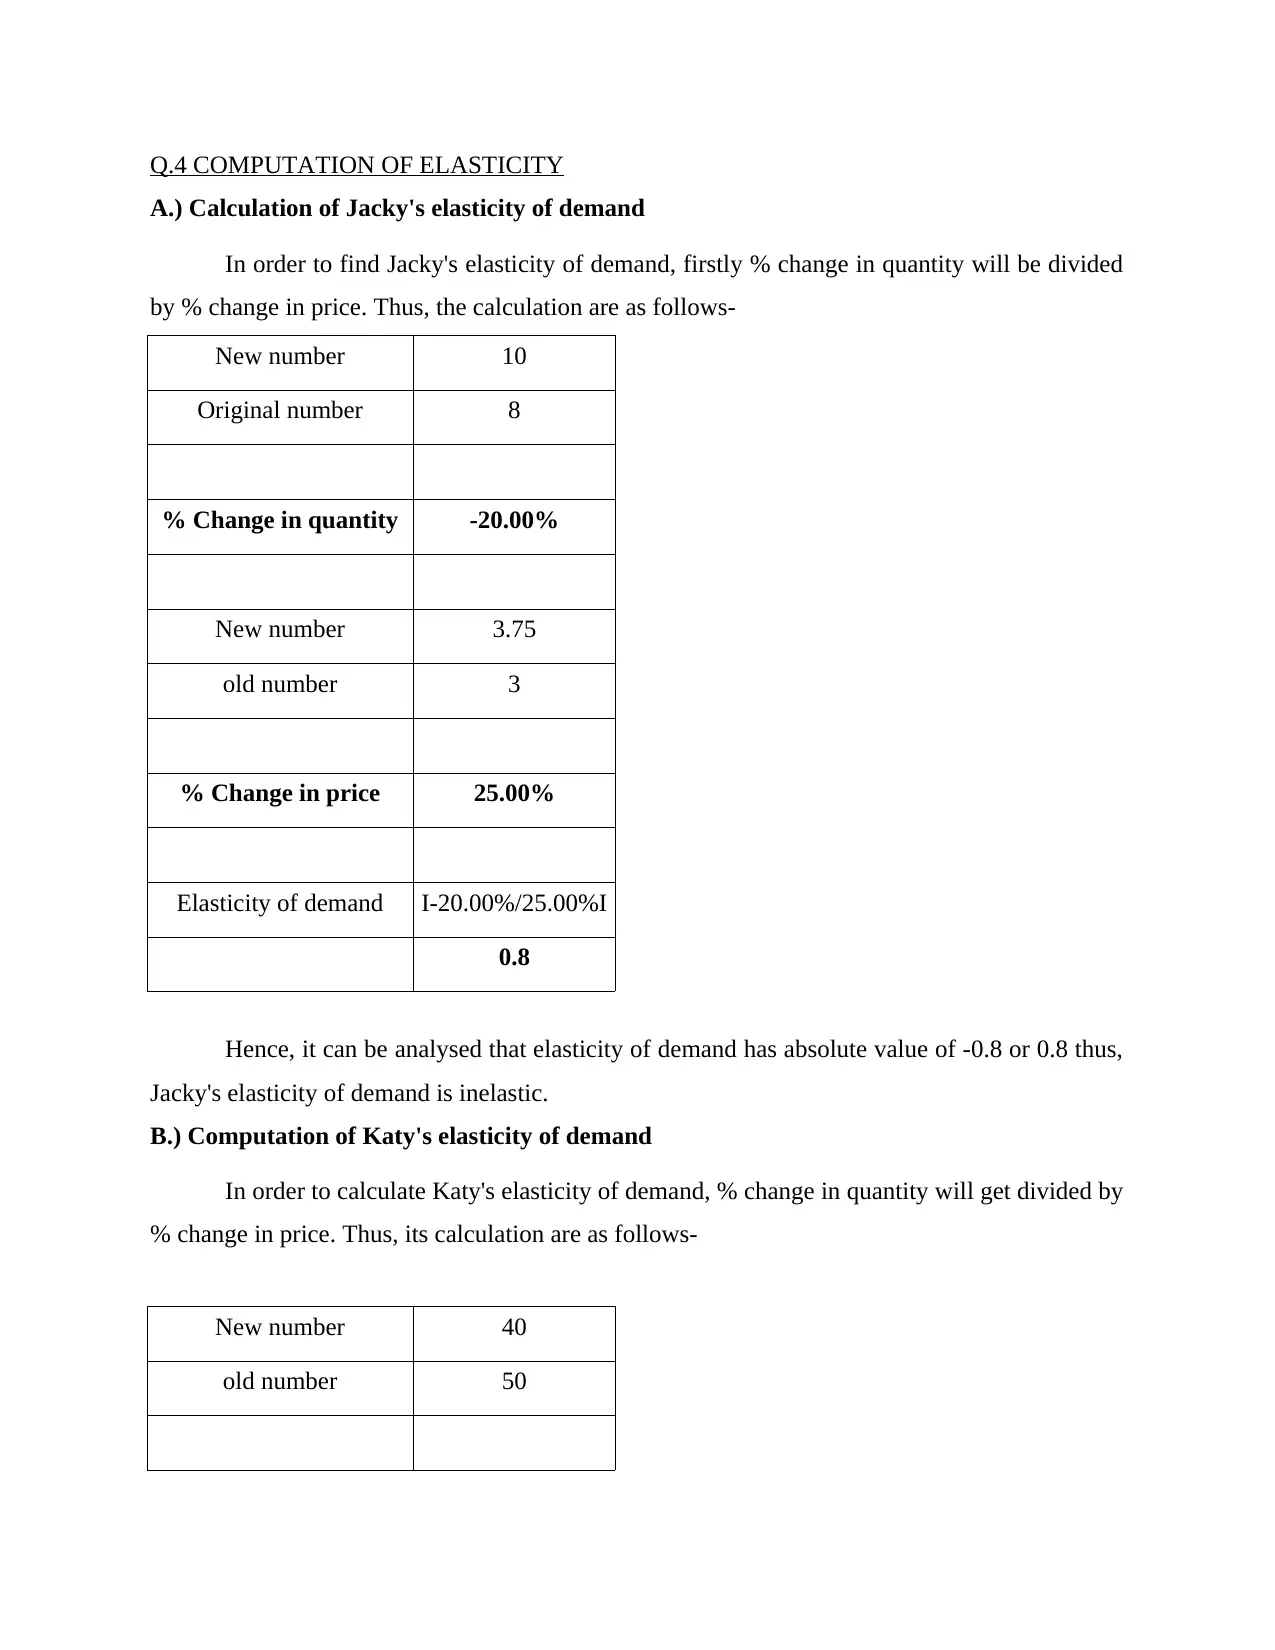
Q.4 COMPUTATION OF ELASTICITY
A.) Calculation of Jacky's elasticity of demand
In order to find Jacky's elasticity of demand, firstly % change in quantity will be divided
by % change in price. Thus, the calculation are as follows-
New number 10
Original number 8
% Change in quantity -20.00%
New number 3.75
old number 3
% Change in price 25.00%
Elasticity of demand I-20.00%/25.00%I
0.8
Hence, it can be analysed that elasticity of demand has absolute value of -0.8 or 0.8 thus,
Jacky's elasticity of demand is inelastic.
B.) Computation of Katy's elasticity of demand
In order to calculate Katy's elasticity of demand, % change in quantity will get divided by
% change in price. Thus, its calculation are as follows-
New number 40
old number 50
⊘ This is a preview!⊘
Do you want full access?
Subscribe today to unlock all pages.
Trusted by 1+ million students worldwide
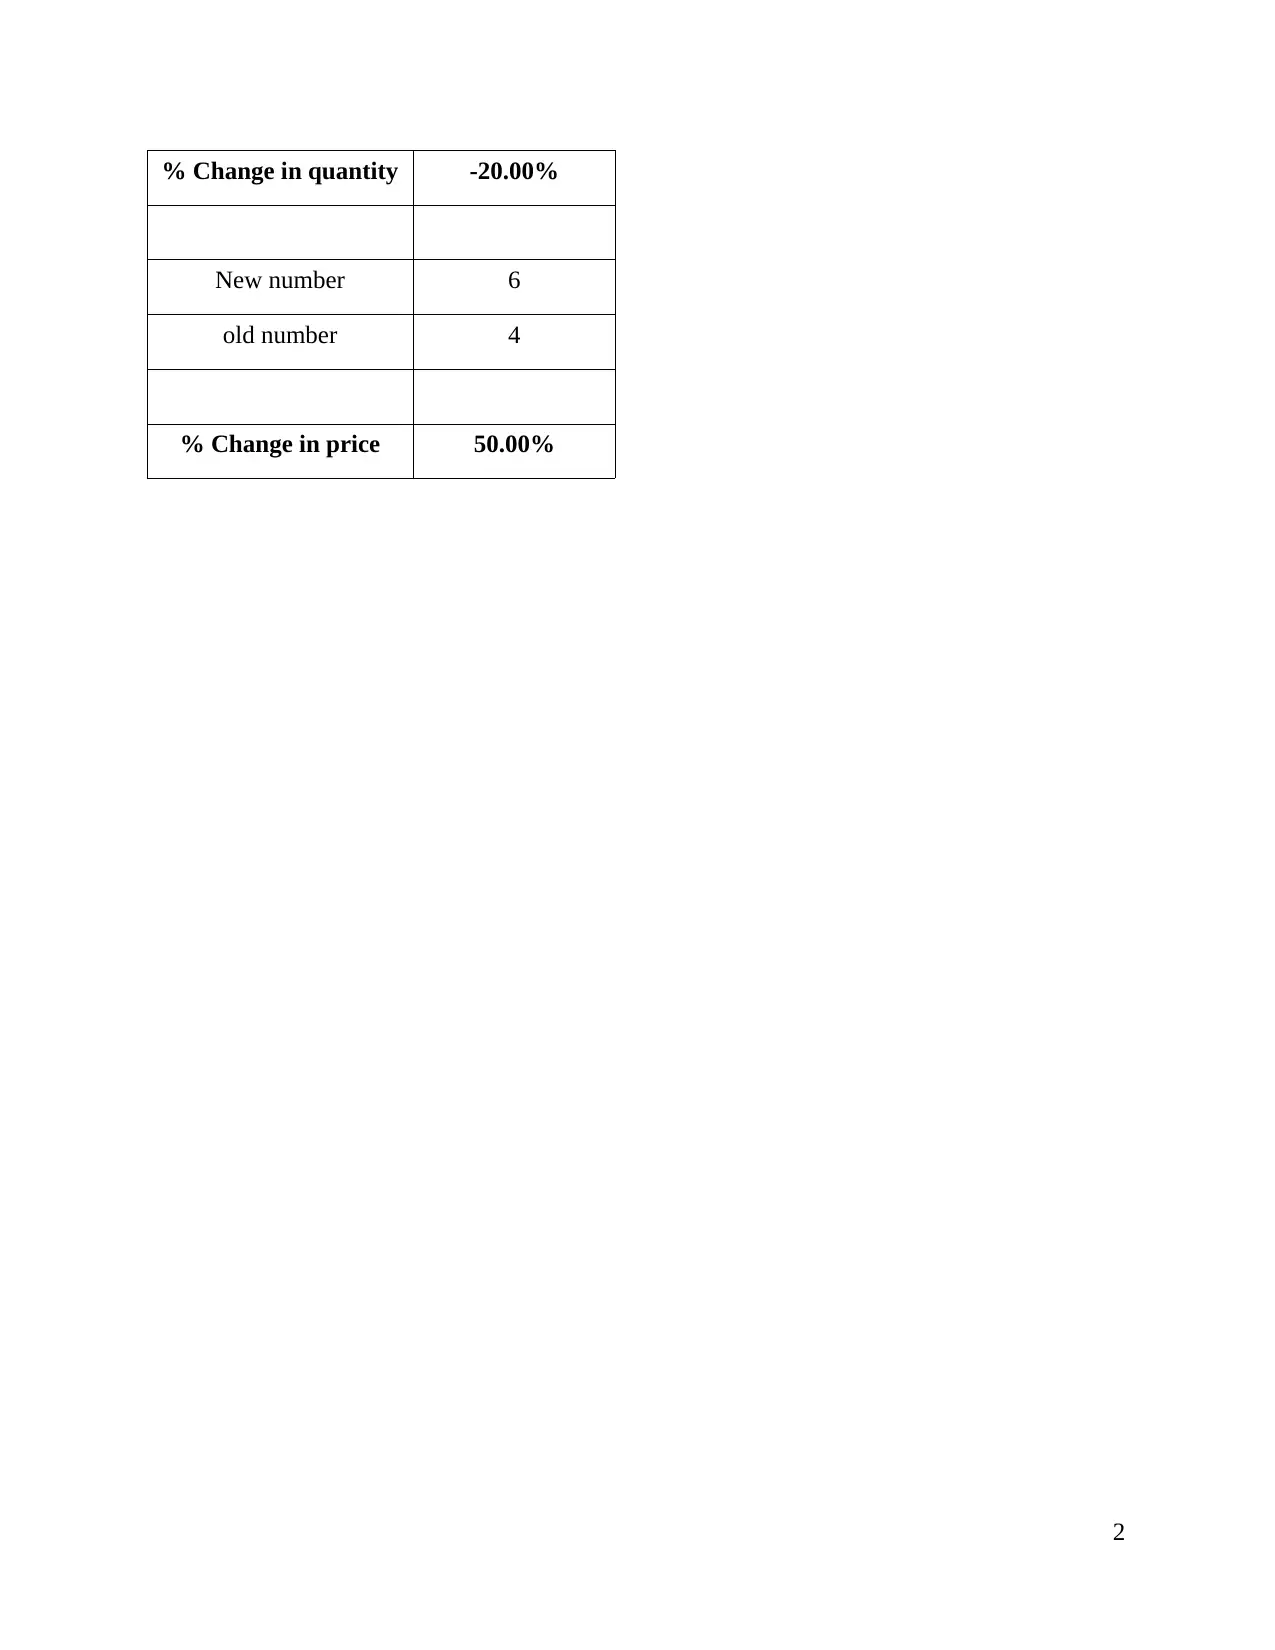
% Change in quantity -20.00%
New number 6
old number 4
% Change in price 50.00%
2
New number 6
old number 4
% Change in price 50.00%
2
Paraphrase This Document
Need a fresh take? Get an instant paraphrase of this document with our AI Paraphraser
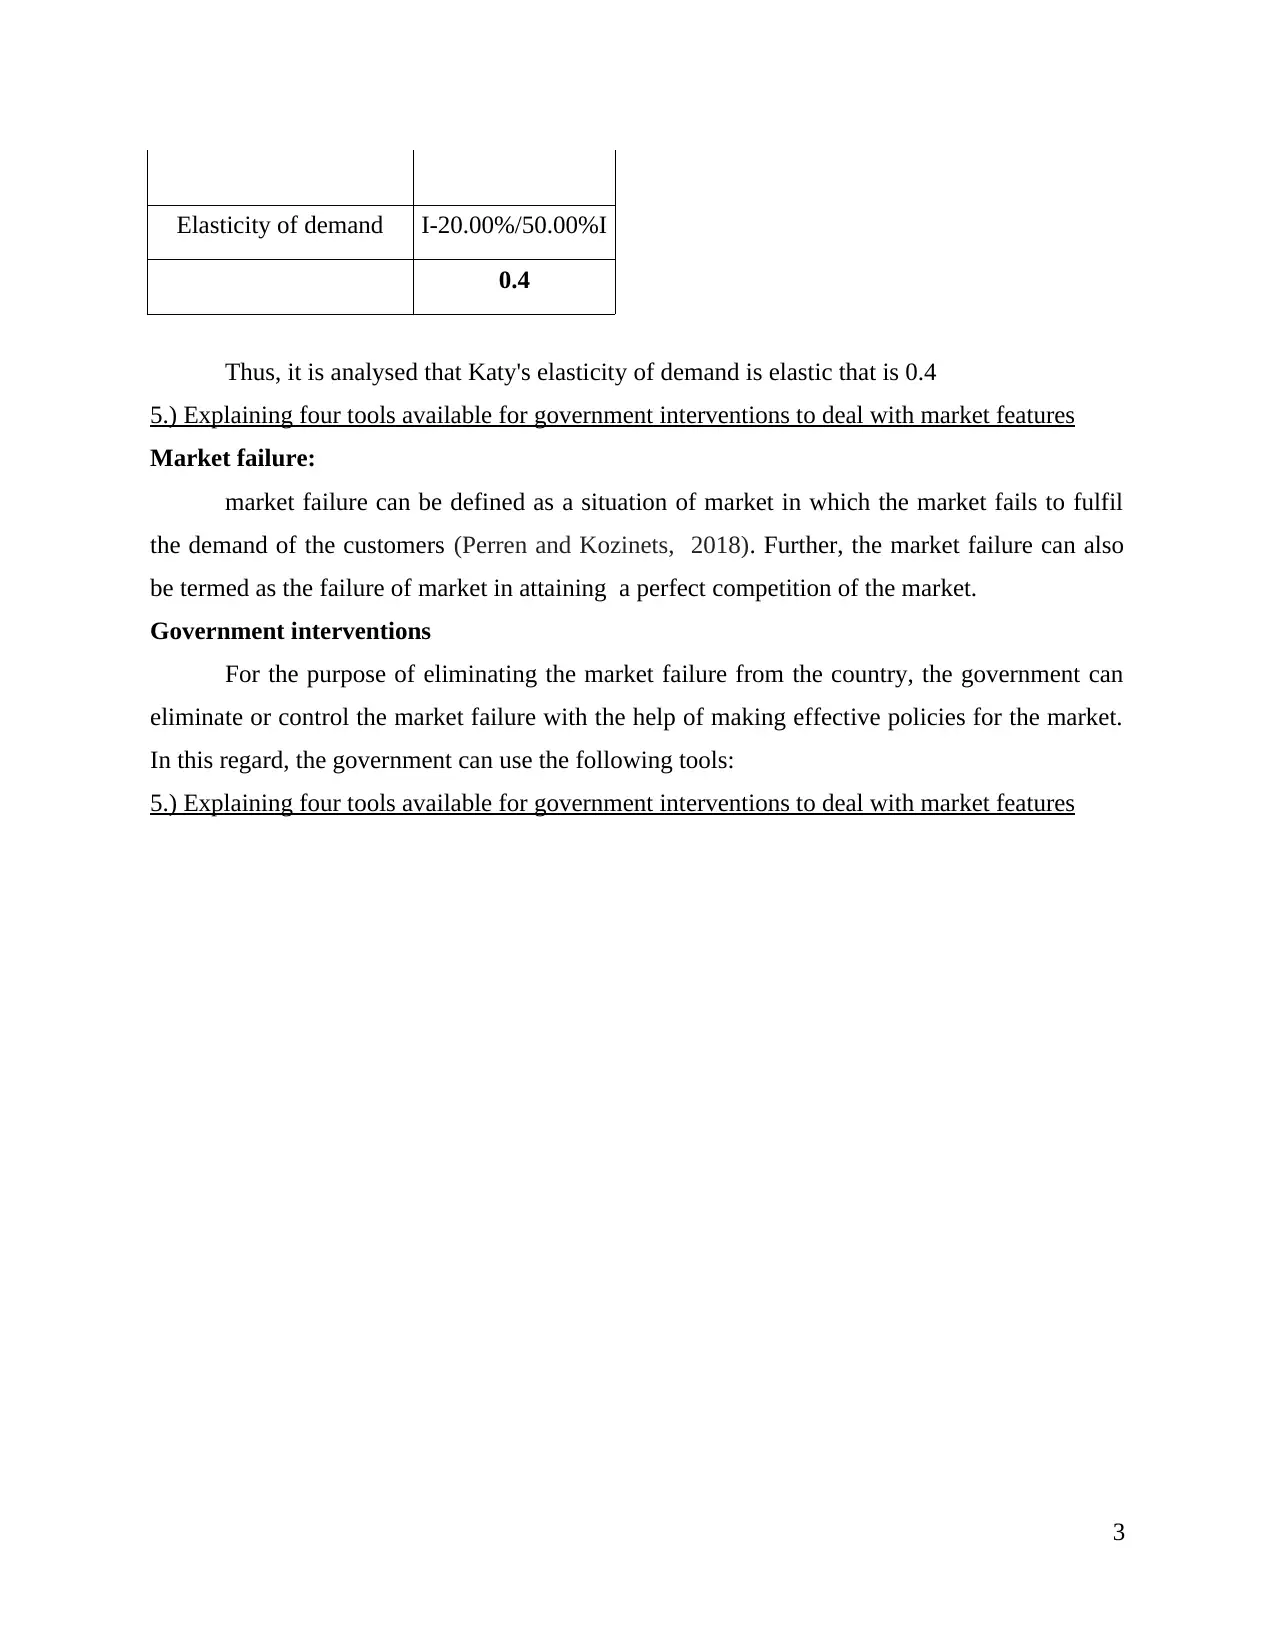
Elasticity of demand I-20.00%/50.00%I
0.4
Thus, it is analysed that Katy's elasticity of demand is elastic that is 0.4
5.) Explaining four tools available for government interventions to deal with market features
Market failure:
market failure can be defined as a situation of market in which the market fails to fulfil
the demand of the customers (Perren and Kozinets, 2018). Further, the market failure can also
be termed as the failure of market in attaining a perfect competition of the market.
Government interventions
For the purpose of eliminating the market failure from the country, the government can
eliminate or control the market failure with the help of making effective policies for the market.
In this regard, the government can use the following tools:
5.) Explaining four tools available for government interventions to deal with market features
3

Taxes and subsidies:
A subsidy is the type of payment which done by government to their supplier in order to
reduce the cost of production and to encourage them for increasing output so that resources are
sufficiently available in the market. Government always tries to engage market inequalities with
the regulation and taxation. This will help them to generate flow of money in economy by which
there will no shortage in availability of resources. For example: government charge tax on the
producer on the goods which they sales in market. Further, producer charge such tax from
retailers and retailers from consumers by which overall revenue in market gets generated.
Ceiling price: In a monopoly market, the firms can set the price of their products as per
their choice. It can lead in failure of the consumers to buy the products (Mazzucato,
2016). The government can reduce the monopolistic price by providing the ceiling price
of each product of the monopolistic market. This tool of government can help it in
providing
4
Illustration 4: government intervention
(source: Analysing and Evaluating Government Intervention in Market, 2018)
⊘ This is a preview!⊘
Do you want full access?
Subscribe today to unlock all pages.
Trusted by 1+ million students worldwide
1 out of 20
Related Documents


Your All-in-One AI-Powered Toolkit for Academic Success.
+13062052269
info@desklib.com
Available 24*7 on WhatsApp / Email
![[object Object]](/_next/static/media/star-bottom.7253800d.svg)
Unlock your academic potential
Copyright © 2020–2026 A2Z Services. All Rights Reserved. Developed and managed by ZUCOL.