Managerial Economics Assignment: Supply, Demand, Elasticity, and Costs

Verified

Added on  2020/04/21

|10
|1048
|444
Homework Assignment
AI Summary
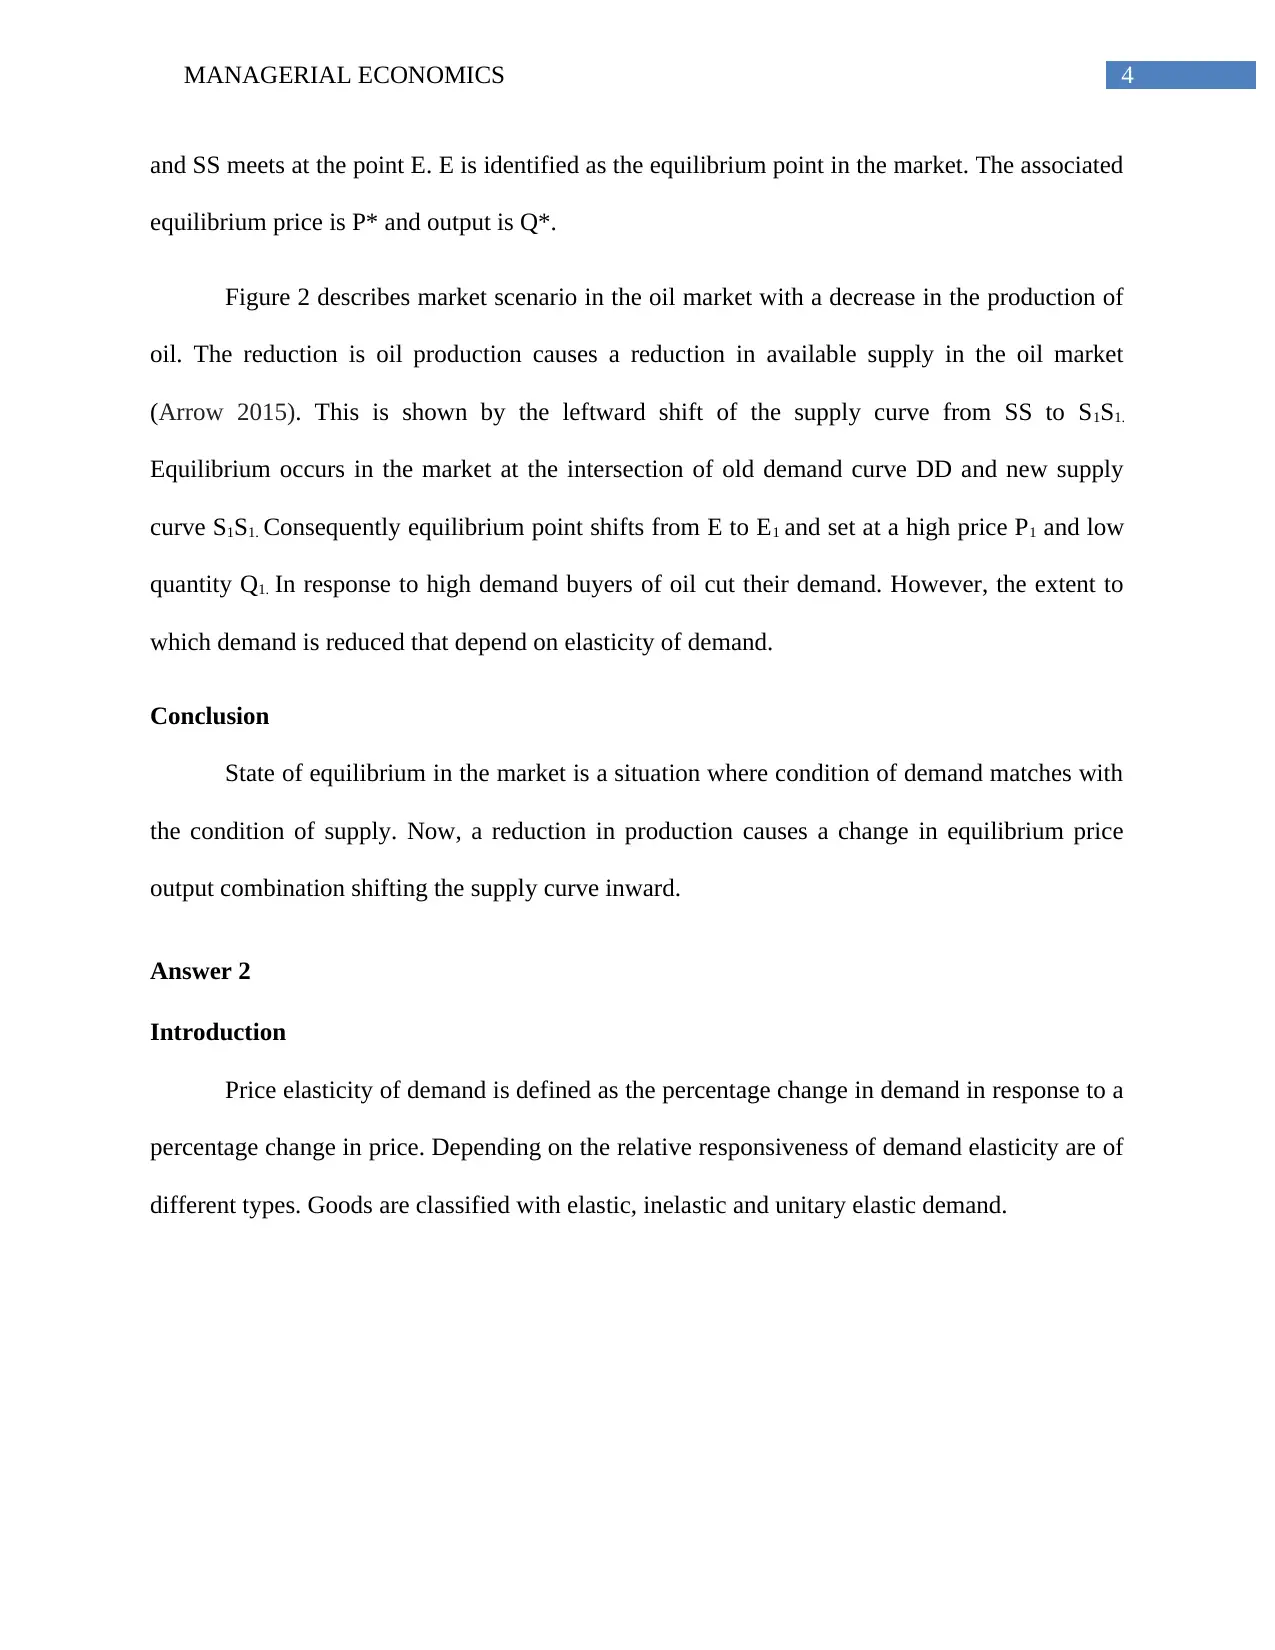
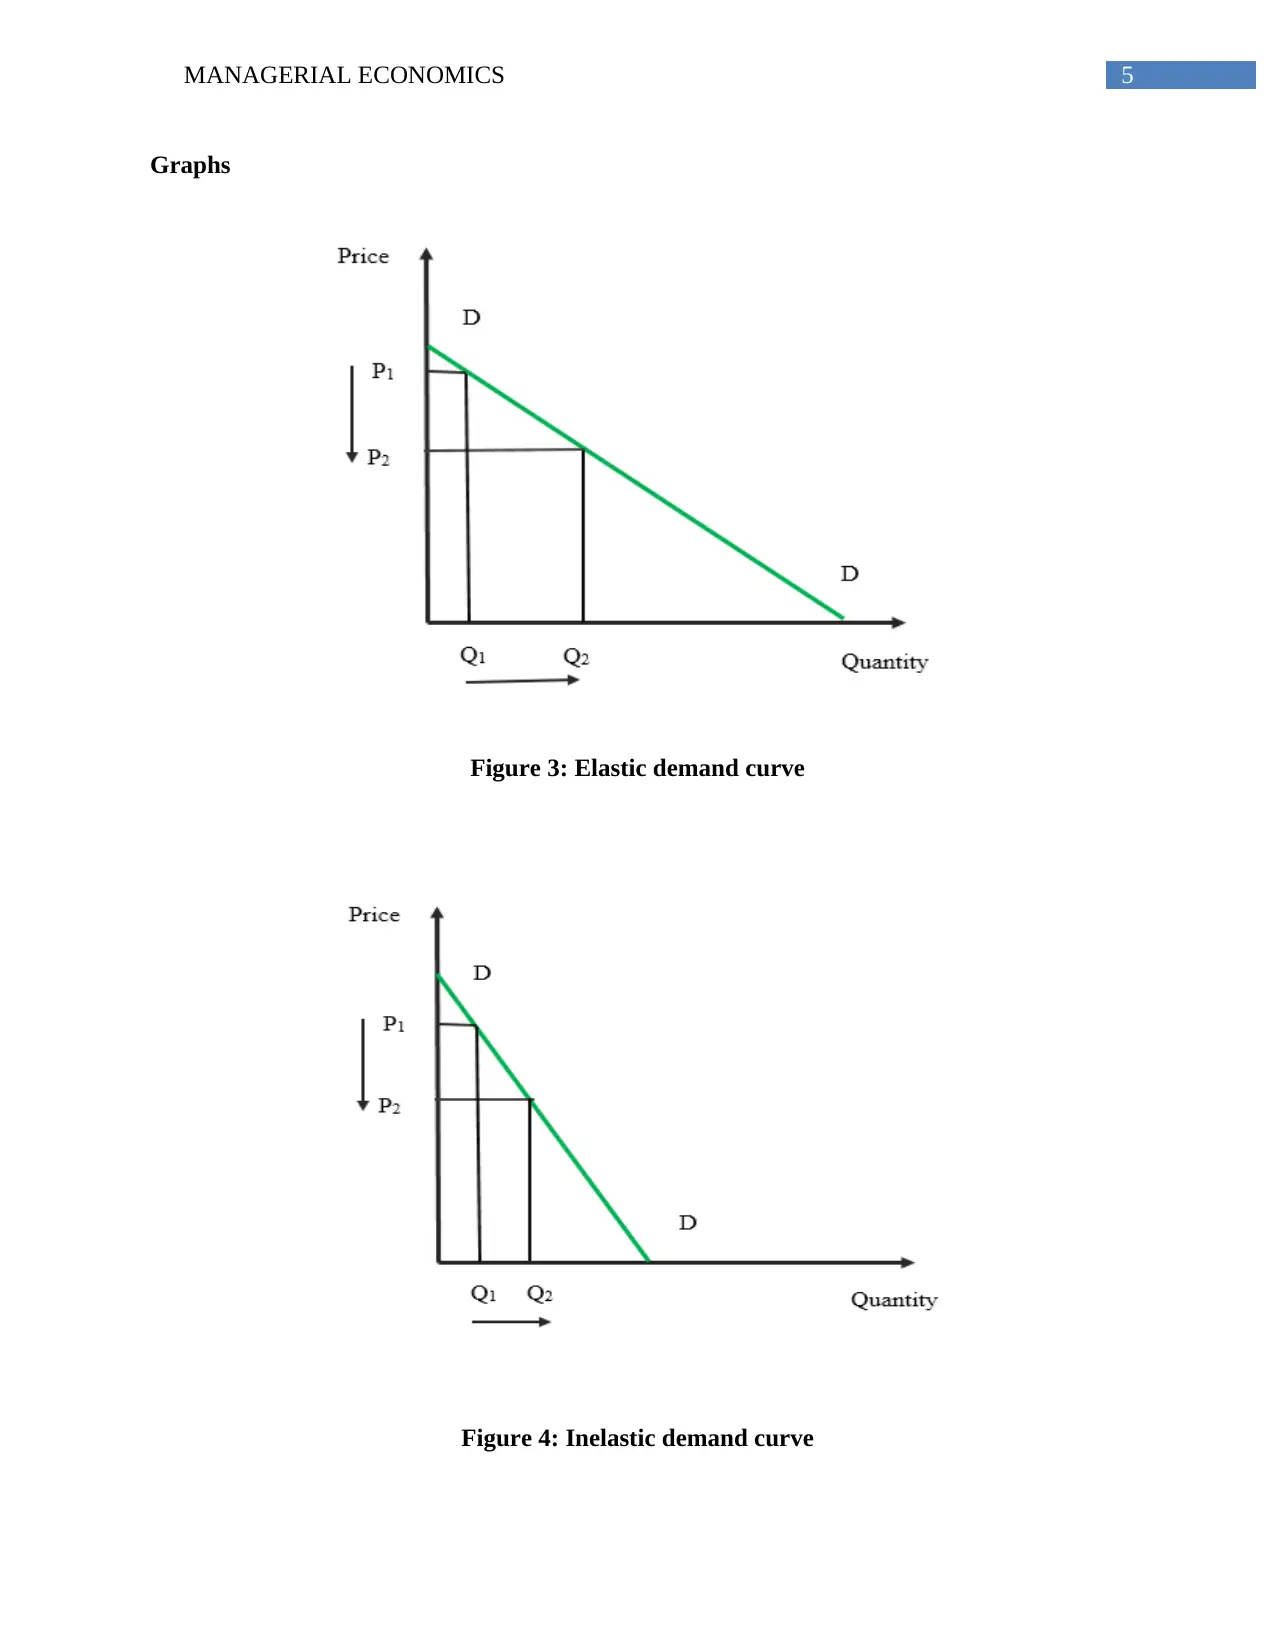
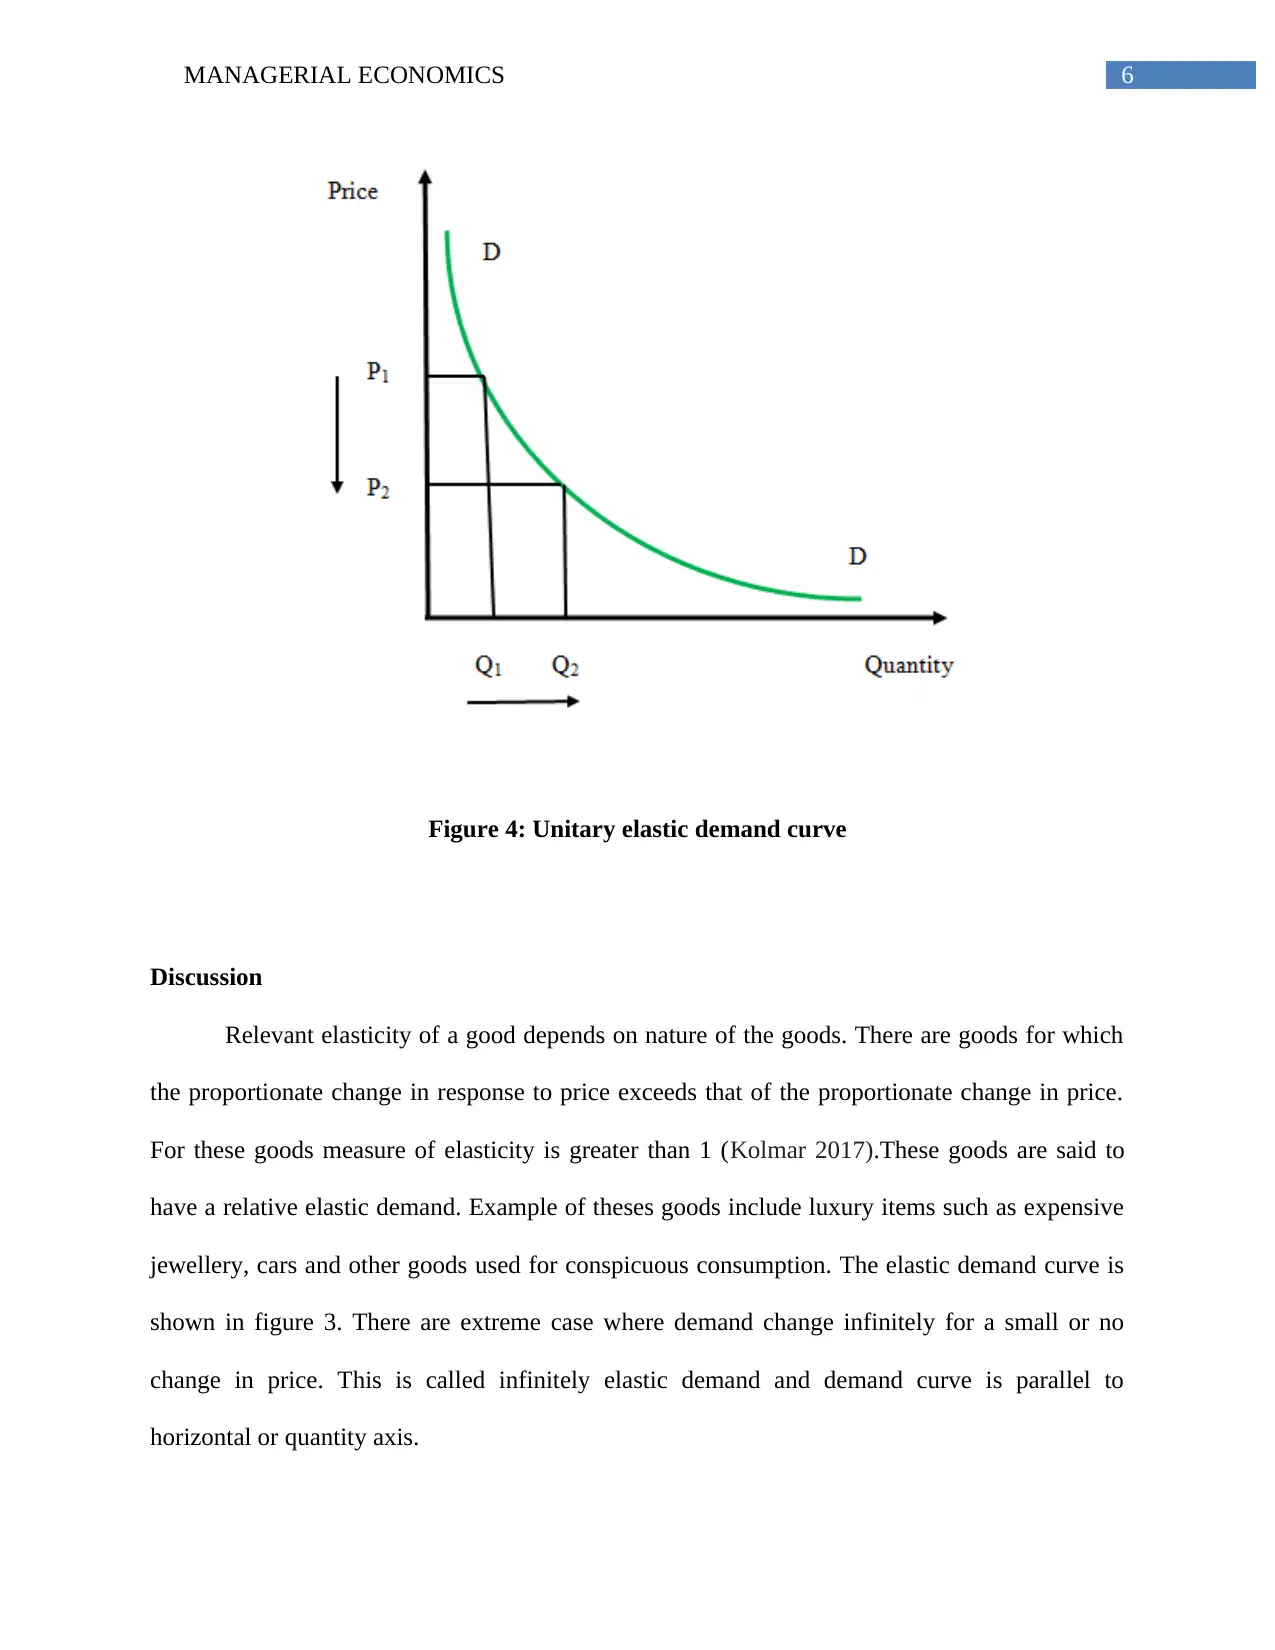
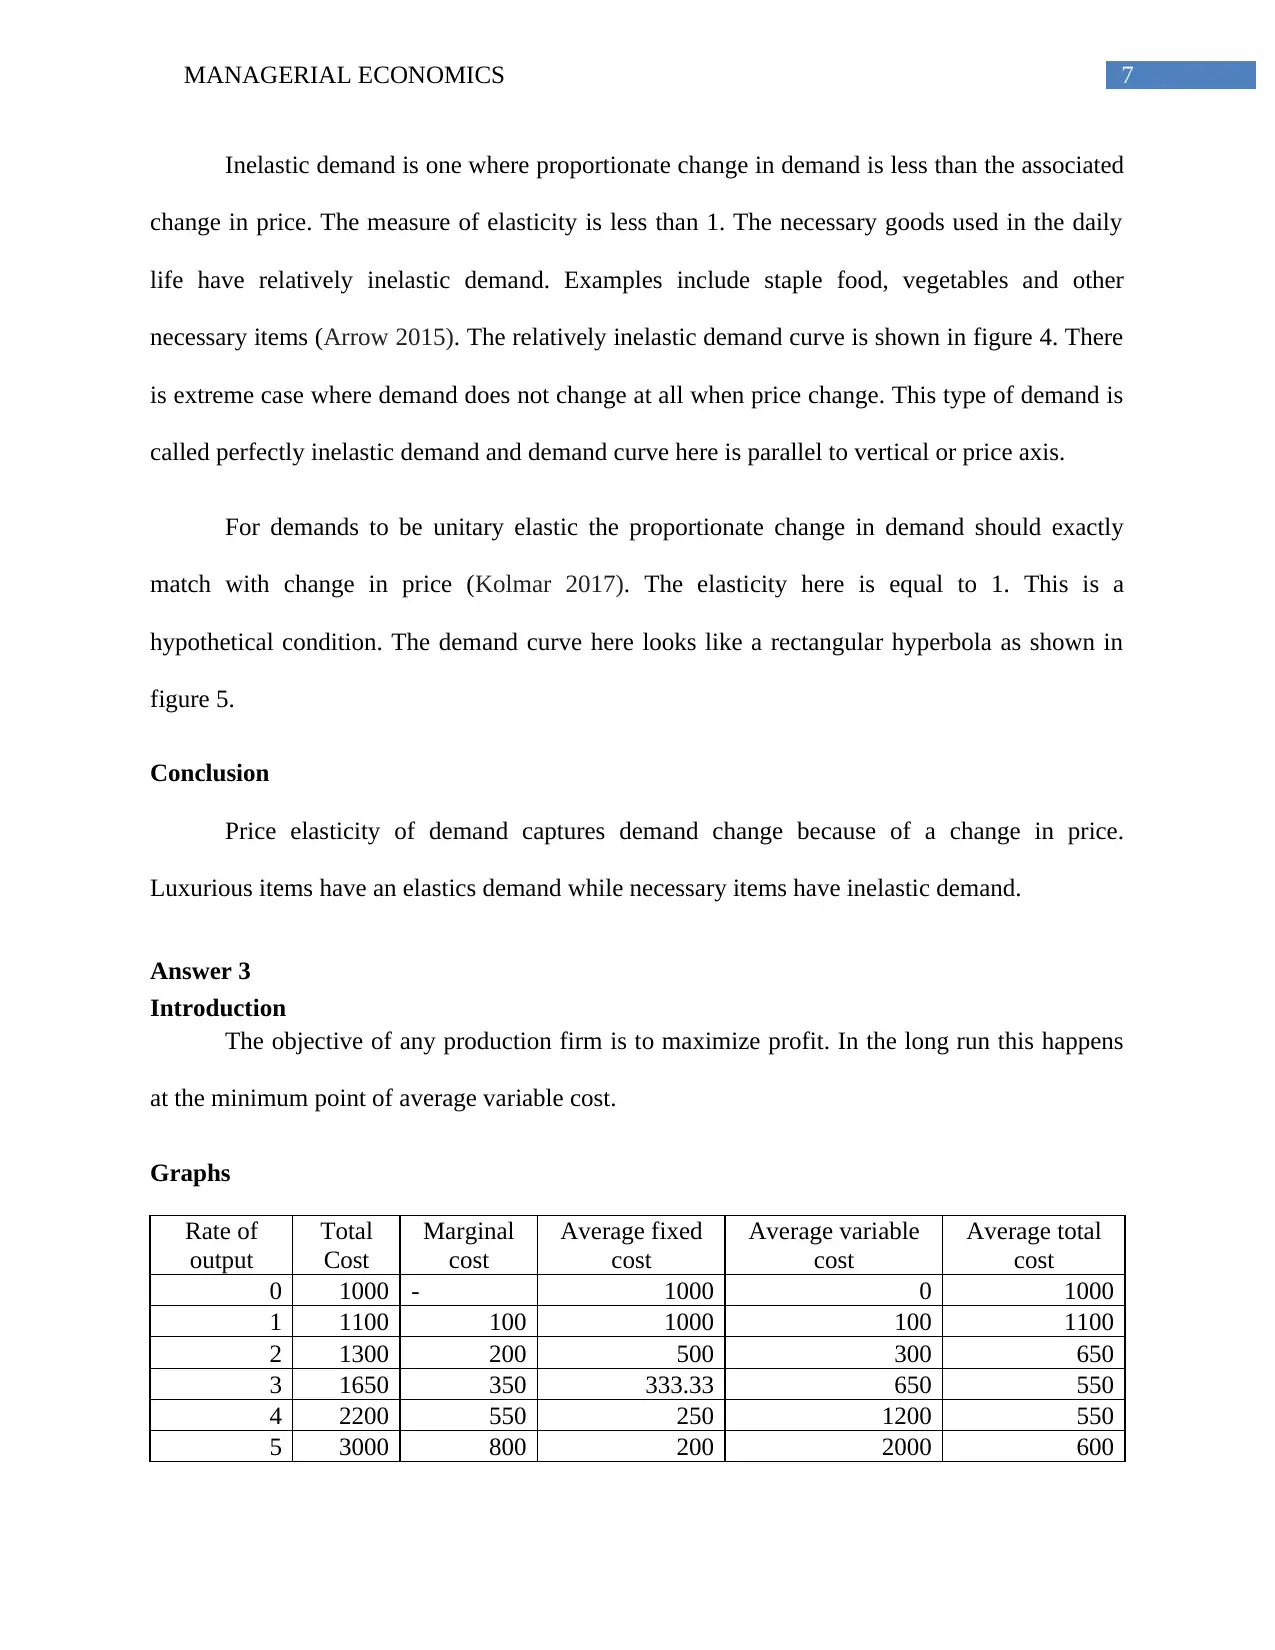
This managerial economics assignment analyzes key economic concepts. It begins with an introduction to market equilibrium, explaining how demand and supply interact to determine prices and quantities, and illustrates these concepts with graphs. The assignment then delves into price elasticity of demand, differentiating between elastic, inelastic, and unitary elastic demands, with graphical representations of each. Finally, the assignment concludes with an examination of cost functions and production, aiming to maximize profit, and presents a cost schedule to determine the minimum average total cost and the optimal output level. This assignment offers a comprehensive overview of core microeconomic principles relevant to managerial decision-making.
Document Page
Running Head: MANAGERIAL ECONOMICS
Managerial Economics
Name of the Student
Name of the University
Author note
tabler-icon-diamond-filled.svg

Paraphrase This Document

Need a fresh take? Get an instant paraphrase of this document with our AI Paraphraser
Document Page
1MANAGERIAL ECONOMICS
Table of Contents
Answer 1..........................................................................................................................................2
Introduction..................................................................................................................................2
Graphs..........................................................................................................................................2
Discussion....................................................................................................................................3
Conclusion...................................................................................................................................4
Answer 2..........................................................................................................................................4
Introduction..................................................................................................................................4
Graphs..........................................................................................................................................5
Discussion....................................................................................................................................6
Conclusion...................................................................................................................................7
Answer 3..........................................................................................................................................7
Introduction..................................................................................................................................7
Graphs..........................................................................................................................................7
Discussion....................................................................................................................................8
Conclusion...................................................................................................................................8
References........................................................................................................................................9
Document Page
2MANAGERIAL ECONOMICS
Answer 1
Introduction
The transaction of goods and services in a market takes place for two simple facts. One is
that it is not possible to produce everything which is consumed. Moreover specialization on a
particular good enhances efficiency and help to produce a larger amount of specialized goods. In
the market the equilibrium price and output of the good is determined by the intersection of the
forces of demand and supply. Any change in either demand or supply causes change in reaction
of buyers and sellers and causes a change in the equilibrium position.
Graphs
Figure 1: Equilibrium with demand and supply
(Source: as created by Author)
Document Page
3MANAGERIAL ECONOMICS
Figure 2: Effect of a reduction in oil production
(Source: as created by Author)
Discussion
Demand and supply are two active forces of markets. Demand represents the desire of
buyers to purchase something backed by their purchasing power. Demand curve depicts the
willingness of buyers at different price points. Supply on the other hand represents the amount
that sellers willing to supply at different price (Kolmar 2017). Now, equilibrium in the market
indicate a point where the interest of buyers and sellers at a particular price and output
combination. This is explained in figure 1. The demand curve is DD and supply curve is SS. DD
tabler-icon-diamond-filled.svg

Paraphrase This Document

Need a fresh take? Get an instant paraphrase of this document with our AI Paraphraser
Document Page
4MANAGERIAL ECONOMICS
and SS meets at the point E. E is identified as the equilibrium point in the market. The associated
equilibrium price is P* and output is Q*.
Figure 2 describes market scenario in the oil market with a decrease in the production of
oil. The reduction is oil production causes a reduction in available supply in the oil market
(Arrow 2015). This is shown by the leftward shift of the supply curve from SS to S1S1.
Equilibrium occurs in the market at the intersection of old demand curve DD and new supply
curve S1S1. Consequently equilibrium point shifts from E to E1 and set at a high price P1 and low
quantity Q1. In response to high demand buyers of oil cut their demand. However, the extent to
which demand is reduced that depend on elasticity of demand.
Conclusion
State of equilibrium in the market is a situation where condition of demand matches with
the condition of supply. Now, a reduction in production causes a change in equilibrium price
output combination shifting the supply curve inward.
Answer 2
Introduction
Price elasticity of demand is defined as the percentage change in demand in response to a
percentage change in price. Depending on the relative responsiveness of demand elasticity are of
different types. Goods are classified with elastic, inelastic and unitary elastic demand.
Document Page
5MANAGERIAL ECONOMICS
Graphs
Figure 3: Elastic demand curve
Figure 4: Inelastic demand curve
Document Page
6MANAGERIAL ECONOMICS
Figure 4: Unitary elastic demand curve
Discussion
Relevant elasticity of a good depends on nature of the goods. There are goods for which
the proportionate change in response to price exceeds that of the proportionate change in price.
For these goods measure of elasticity is greater than 1 (Kolmar 2017).These goods are said to
have a relative elastic demand. Example of theses goods include luxury items such as expensive
jewellery, cars and other goods used for conspicuous consumption. The elastic demand curve is
shown in figure 3. There are extreme case where demand change infinitely for a small or no
change in price. This is called infinitely elastic demand and demand curve is parallel to
horizontal or quantity axis.
tabler-icon-diamond-filled.svg

Paraphrase This Document

Need a fresh take? Get an instant paraphrase of this document with our AI Paraphraser
Document Page
7MANAGERIAL ECONOMICS
Inelastic demand is one where proportionate change in demand is less than the associated
change in price. The measure of elasticity is less than 1. The necessary goods used in the daily
life have relatively inelastic demand. Examples include staple food, vegetables and other
necessary items (Arrow 2015). The relatively inelastic demand curve is shown in figure 4. There
is extreme case where demand does not change at all when price change. This type of demand is
called perfectly inelastic demand and demand curve here is parallel to vertical or price axis.
For demands to be unitary elastic the proportionate change in demand should exactly
match with change in price (Kolmar 2017). The elasticity here is equal to 1. This is a
hypothetical condition. The demand curve here looks like a rectangular hyperbola as shown in
figure 5.
Conclusion
Price elasticity of demand captures demand change because of a change in price.
Luxurious items have an elastics demand while necessary items have inelastic demand.
Answer 3
Introduction
The objective of any production firm is to maximize profit. In the long run this happens
at the minimum point of average variable cost.
Graphs
Rate of
output
Total
Cost
Marginal
cost
Average fixed
cost
Average variable
cost
Average total
cost
0 1000 - 1000 0 1000
1 1100 100 1000 100 1100
2 1300 200 500 300 650
3 1650 350 333.33 650 550
4 2200 550 250 1200 550
5 3000 800 200 2000 600
Document Page
8MANAGERIAL ECONOMICS
0 1 2 3 4 5 6 7 8
0
2
4
6
8
10
12
Average total cost
Marginal cost
Output
Marginal cost, average total cost
Figure 6: Average total cost and marginal cost of production
Discussion
From the cost schedule the minimum average total cost is 550 and this is achieved at the
output level 3.
Conclusion
Firm’s objective is to maximize profit or minimize cost. The minimum average cost is
attained when rate of output is 3.
Document Page
9MANAGERIAL ECONOMICS
References
Arrow, K., 2015. Microeconomics and operations research: Their interactions and
differences. Information Systems Frontiers, 17(1), pp.3-9.
Kolmar, M., 2017. Principles of Microeconomics. Springer Texts in Business and Economics
ReDIF-Book.
chevron_up_icon
1 out of 10
circle_padding
hide_on_mobile
zoom_out_icon
[object Object]