Managerial Economics: Corn Market Analysis Report, University of XYZ

Verified

Added on  2020/02/24

|2
|467
|98
Report
AI Summary
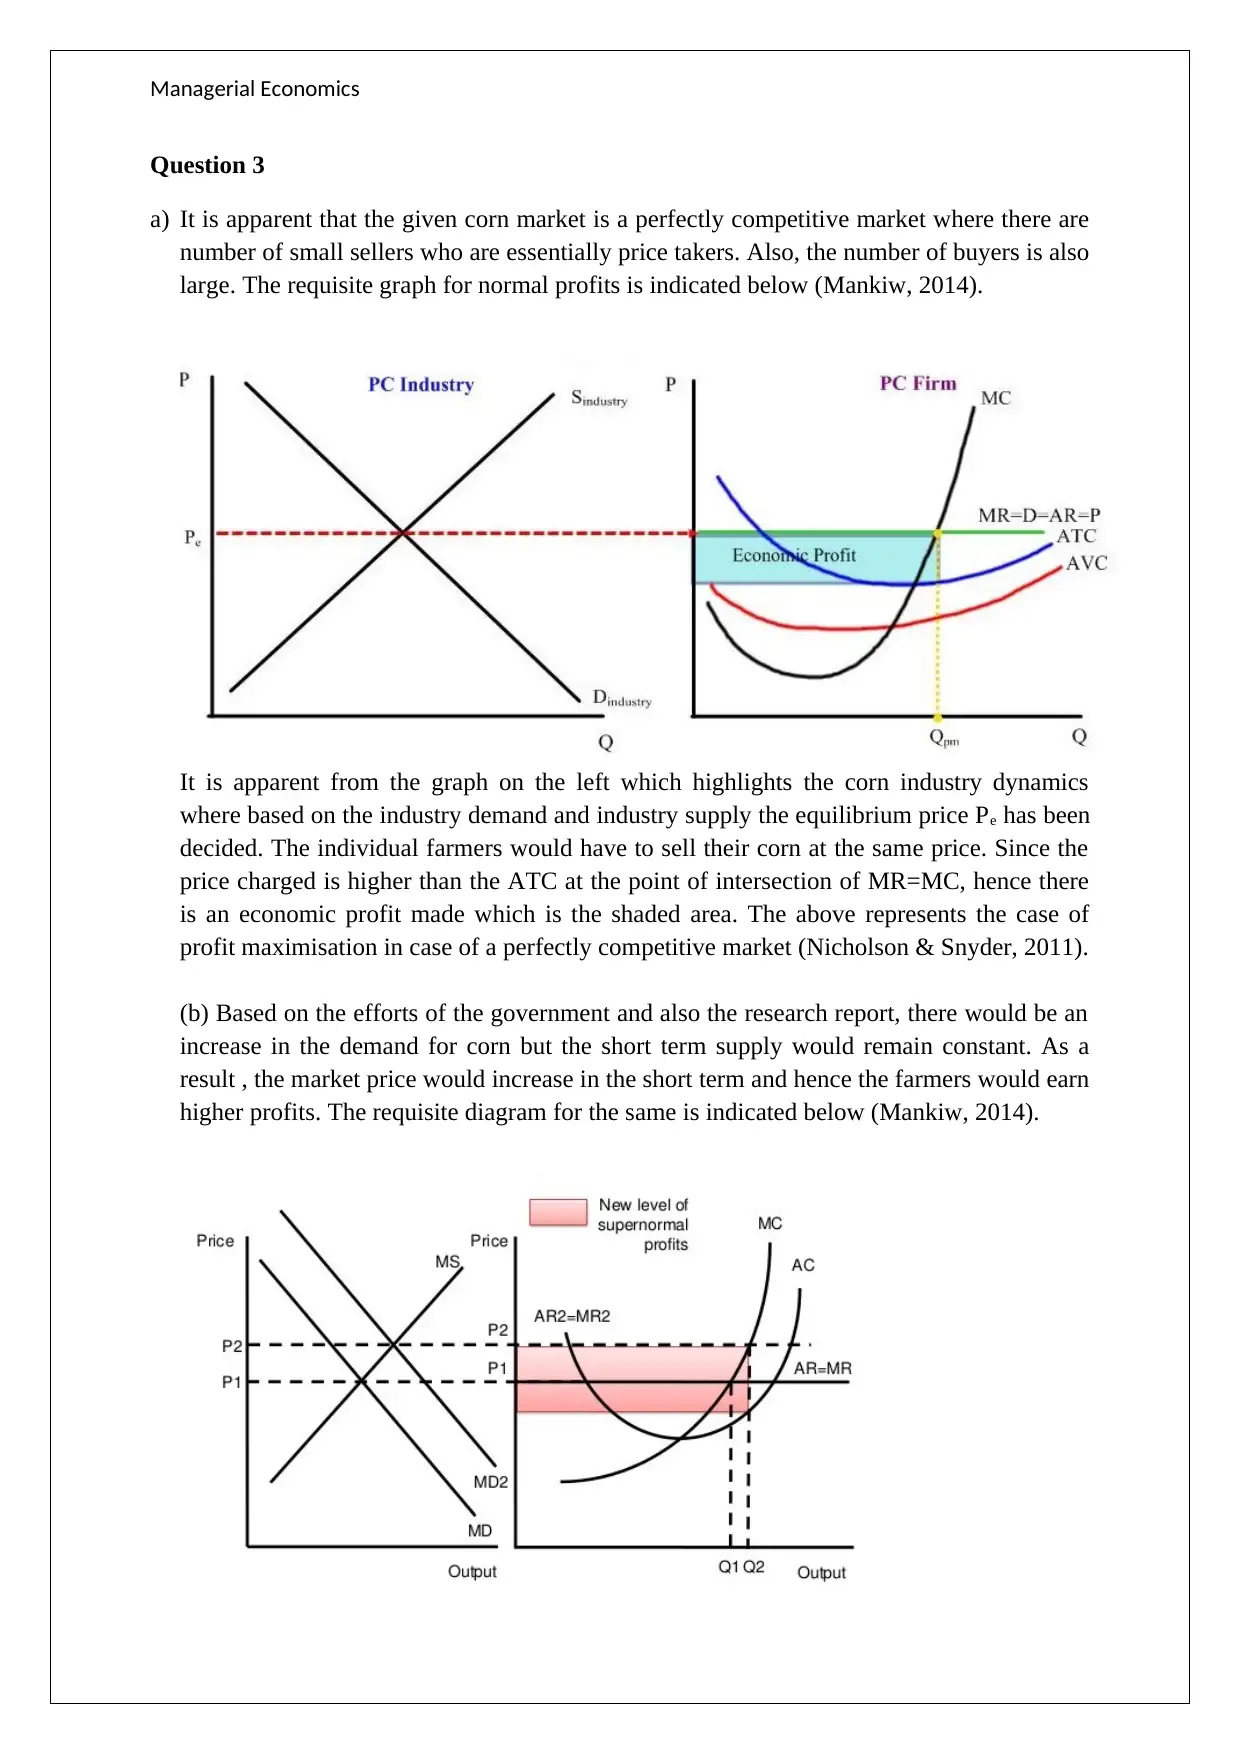
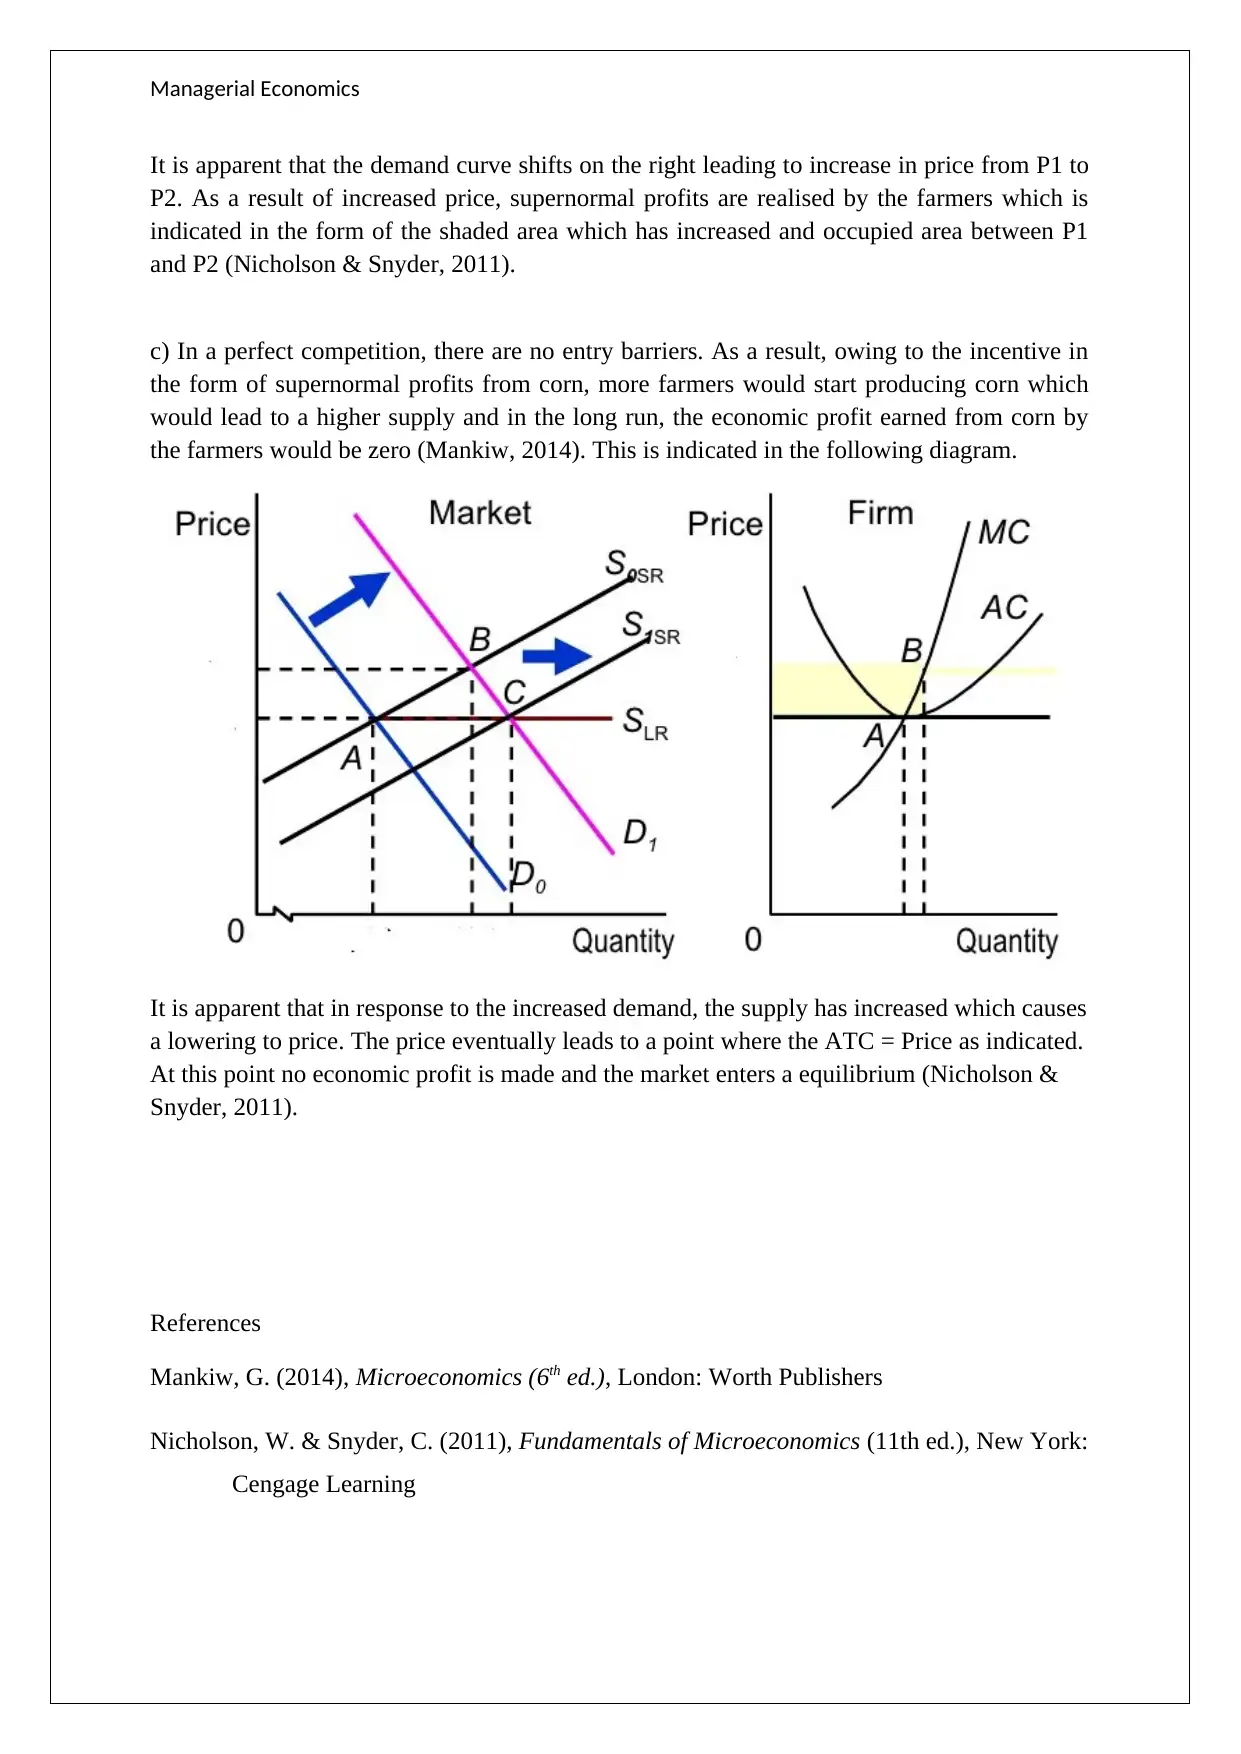
This report provides an analysis of the corn market within the framework of managerial economics. It examines the market's characteristics, including its classification as a perfectly competitive market with numerous small sellers and buyers. The report utilizes graphical representations to illustrate market dynamics, including the determination of equilibrium price and the conditions for profit maximization. It also explores the impact of increased demand on the market, leading to higher short-term profits for farmers. Furthermore, the report discusses the long-run implications of these profits, considering the entry of new producers and the eventual convergence to a state of zero economic profit. The analysis incorporates references to key economic texts to support its findings.
Document Page
Managerial Economics
Question 3
a) It is apparent that the given corn market is a perfectly competitive market where there are
number of small sellers who are essentially price takers. Also, the number of buyers is also
large. The requisite graph for normal profits is indicated below (Mankiw, 2014).
It is apparent from the graph on the left which highlights the corn industry dynamics
where based on the industry demand and industry supply the equilibrium price Pe has been
decided. The individual farmers would have to sell their corn at the same price. Since the
price charged is higher than the ATC at the point of intersection of MR=MC, hence there
is an economic profit made which is the shaded area. The above represents the case of
profit maximisation in case of a perfectly competitive market (Nicholson & Snyder, 2011).
(b) Based on the efforts of the government and also the research report, there would be an
increase in the demand for corn but the short term supply would remain constant. As a
result , the market price would increase in the short term and hence the farmers would earn
higher profits. The requisite diagram for the same is indicated below (Mankiw, 2014).
tabler-icon-diamond-filled.svg

Paraphrase This Document

Need a fresh take? Get an instant paraphrase of this document with our AI Paraphraser
Document Page
Managerial Economics
It is apparent that the demand curve shifts on the right leading to increase in price from P1 to
P2. As a result of increased price, supernormal profits are realised by the farmers which is
indicated in the form of the shaded area which has increased and occupied area between P1
and P2 (Nicholson & Snyder, 2011).
c) In a perfect competition, there are no entry barriers. As a result, owing to the incentive in
the form of supernormal profits from corn, more farmers would start producing corn which
would lead to a higher supply and in the long run, the economic profit earned from corn by
the farmers would be zero (Mankiw, 2014). This is indicated in the following diagram.
It is apparent that in response to the increased demand, the supply has increased which causes
a lowering to price. The price eventually leads to a point where the ATC = Price as indicated.
At this point no economic profit is made and the market enters a equilibrium (Nicholson &
Snyder, 2011).
References
Mankiw, G. (2014), Microeconomics (6th ed.), London: Worth Publishers
Nicholson, W. & Snyder, C. (2011), Fundamentals of Microeconomics (11th ed.), New York:
Cengage Learning
chevron_up_icon
1 out of 2
circle_padding
hide_on_mobile
zoom_out_icon
[object Object]