Managerial Economics: Analyzing Uber, Land Value Tax, and Subsidies

Verified

Added on  2023/06/07

|11
|1313
|203
Homework Assignment
AI Summary
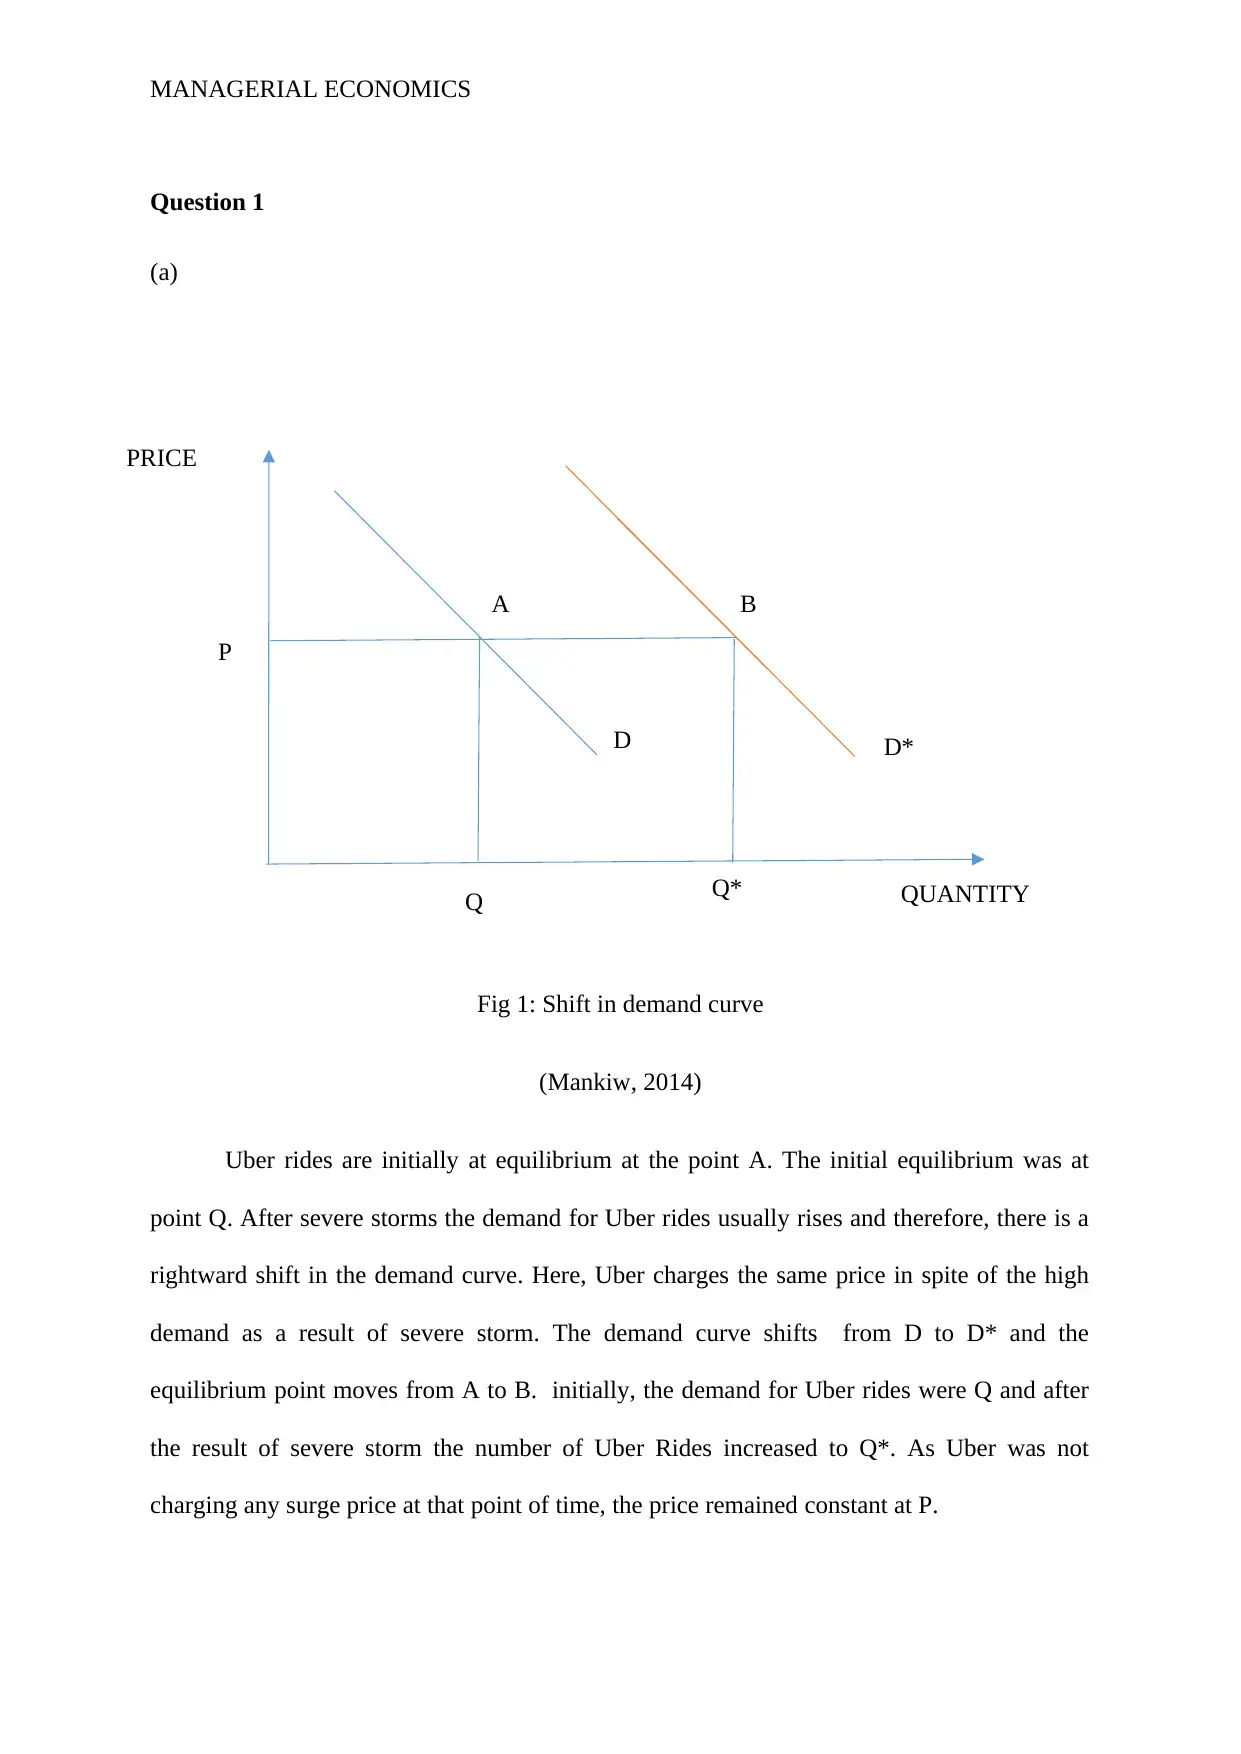
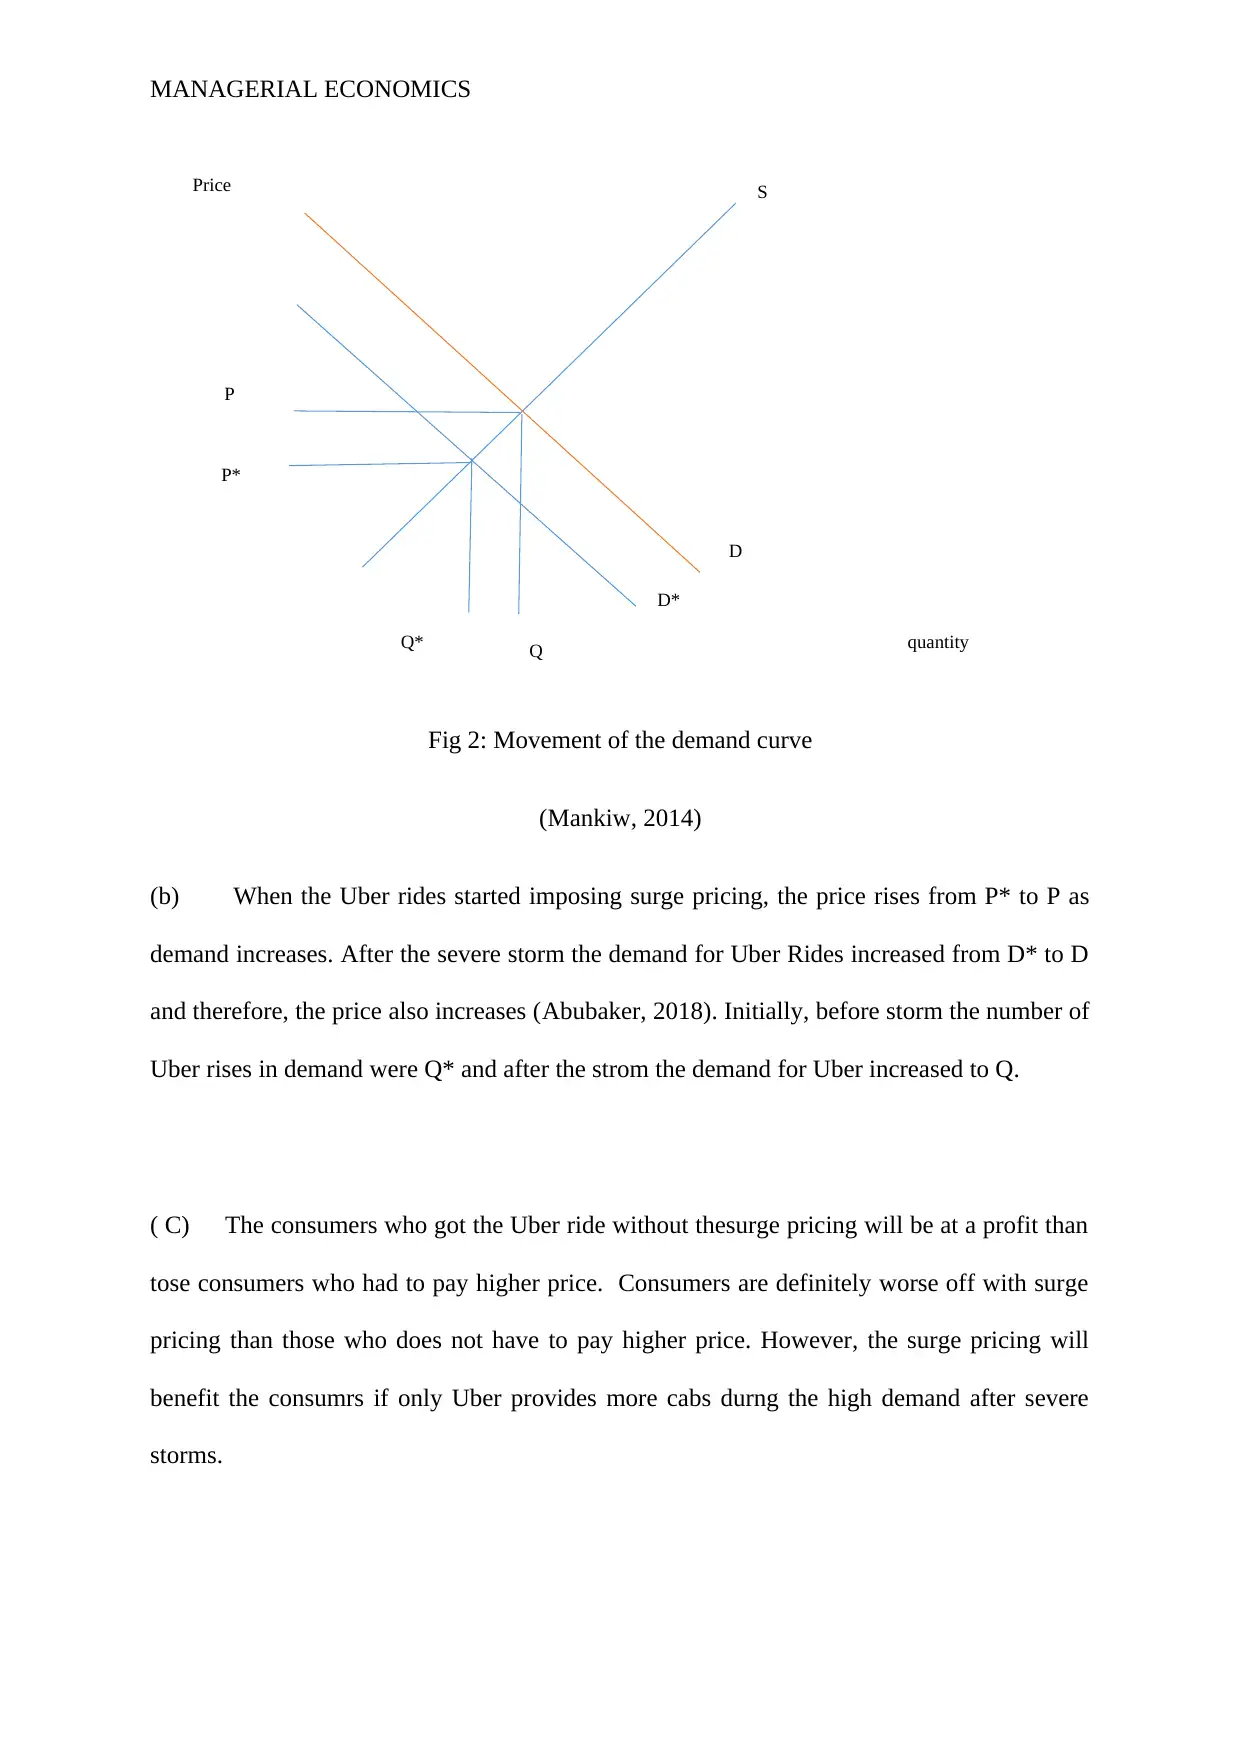
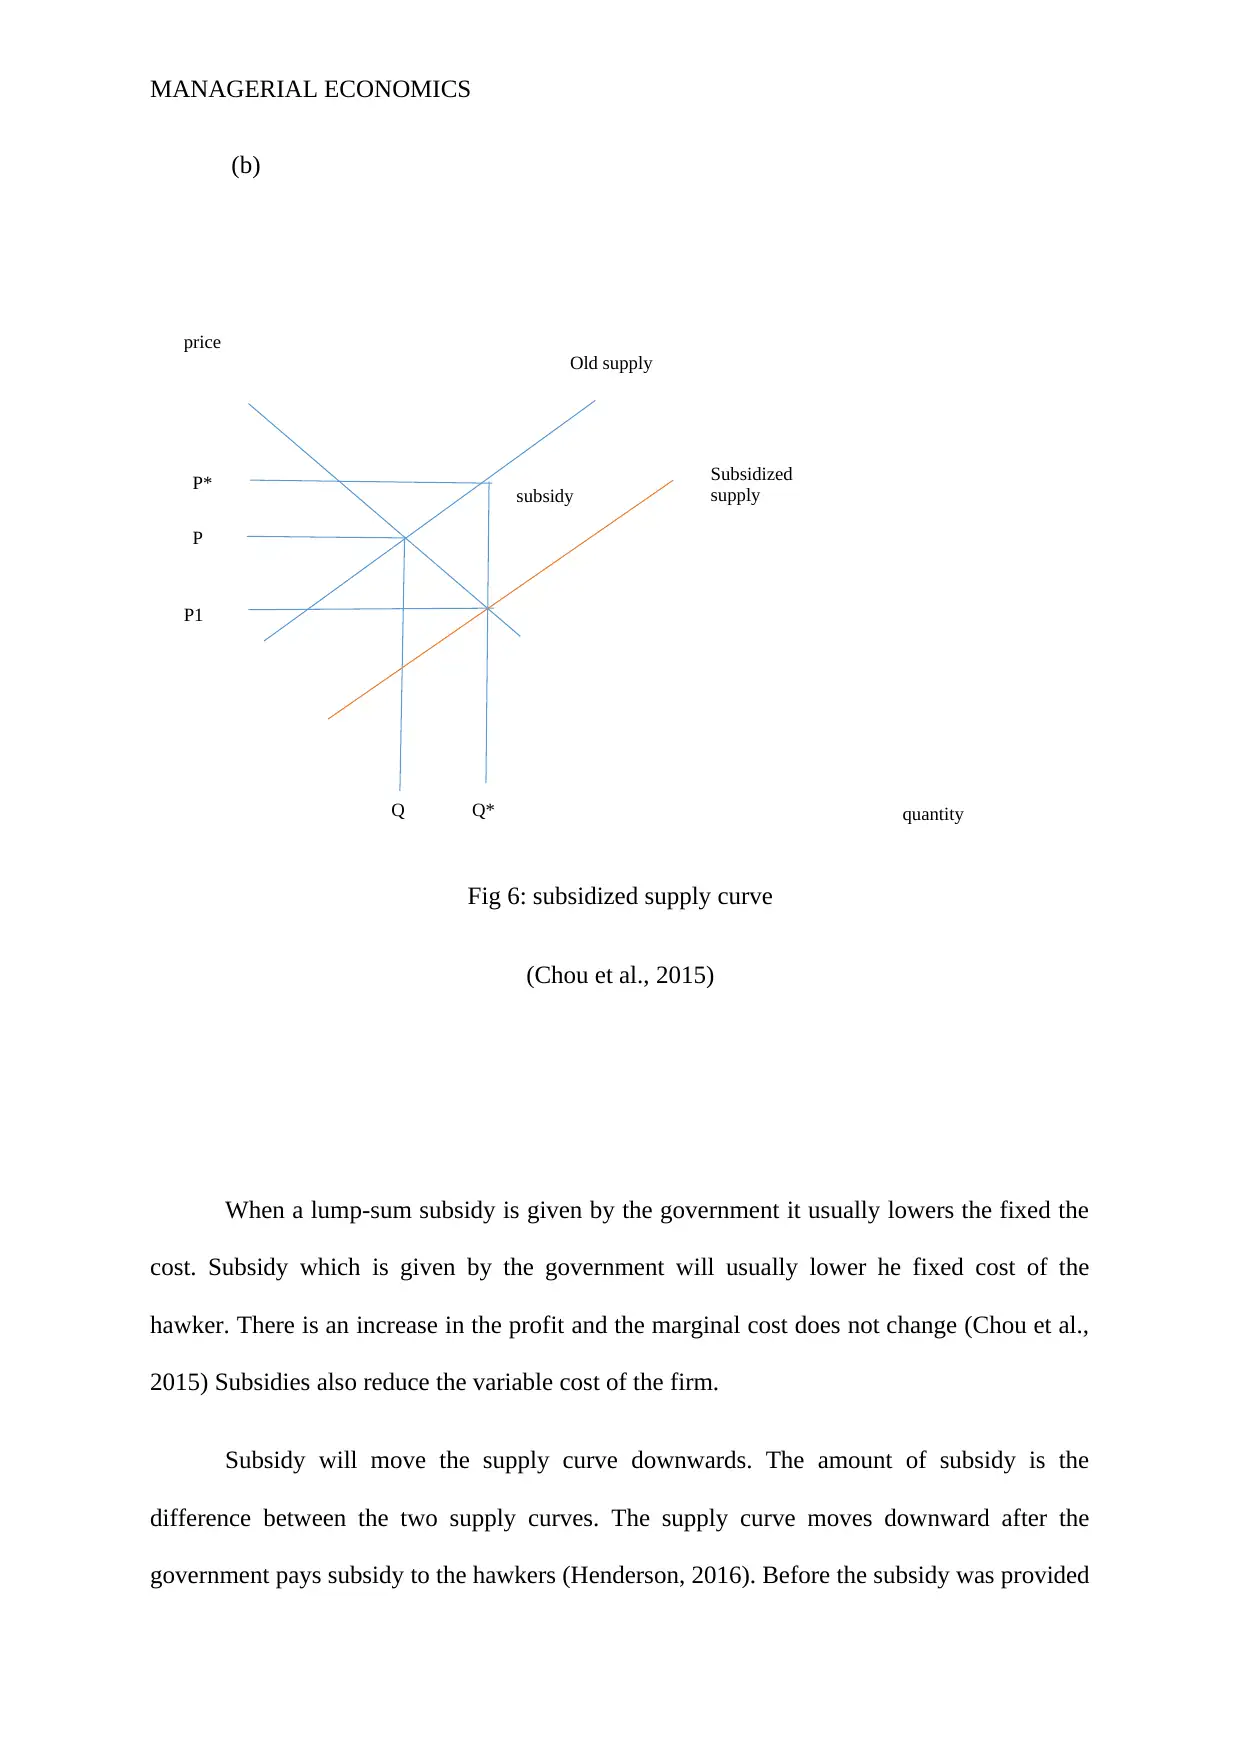
This assignment delves into key concepts of managerial economics, analyzing market dynamics through the lens of demand and supply. It begins by examining the Uber market, focusing on the impact of severe storms and surge pricing on equilibrium. The analysis uses demand/supply models to illustrate shifts in demand curves and price changes. Subsequently, the assignment explores the demand for land in top cities and the implications of land value tax, again employing demand/supply diagrams to explain price variations. Finally, it investigates the effects of government subsidies on the hawker food market, demonstrating how subsidies influence supply curves, prices, and profits. The assignment leverages economic principles to provide a comprehensive understanding of market forces and policy interventions. Desklib offers a wealth of similar solved assignments and study tools to aid students in their academic pursuits.
tabler-icon-diamond-filled.svg

Contribute Materials

Your contribution can guide someone’s learning journey. Share your documents today.
Document Page
0Running head : MANAGERIAL ECONOMICS
Managerial Economics
Name of the student
Name of the university
Author note
tabler-icon-diamond-filled.svg

Secure Best Marks with AI Grader

Need help grading? Try our AI Grader for instant feedback on your assignments.
Document Page
MANAGERIAL ECONOMICS
Table of contents
Question 1..................................................................................................................................2
Question 2..................................................................................................................................4
Question 3..................................................................................................................................7
Reference list............................................................................................................................10
Document Page
Q Q*
A B
P
QUANTITY
D D*
MANAGERIAL ECONOMICS
Question 1
(a)
Fig 1: Shift in demand curve
(Mankiw, 2014)
Uber rides are initially at equilibrium at the point A. The initial equilibrium was at
point Q. After severe storms the demand for Uber rides usually rises and therefore, there is a
rightward shift in the demand curve. Here, Uber charges the same price in spite of the high
demand as a result of severe storm. The demand curve shifts from D to D* and the
equilibrium point moves from A to B. initially, the demand for Uber rides were Q and after
the result of severe storm the number of Uber Rides increased to Q*. As Uber was not
charging any surge price at that point of time, the price remained constant at P.
PRICE
Document Page
S
D
D*
P
P*
Q* Q
Price
quantity
MANAGERIAL ECONOMICS
Fig 2: Movement of the demand curve
(Mankiw, 2014)
(b) When the Uber rides started imposing surge pricing, the price rises from P* to P as
demand increases. After the severe storm the demand for Uber Rides increased from D* to D
and therefore, the price also increases (Abubaker, 2018). Initially, before storm the number of
Uber rises in demand were Q* and after the strom the demand for Uber increased to Q.
( C) The consumers who got the Uber ride without thesurge pricing will be at a profit than
tose consumers who had to pay higher price. Consumers are definitely worse off with surge
pricing than those who does not have to pay higher price. However, the surge pricing will
benefit the consumrs if only Uber provides more cabs durng the high demand after severe
storms.
tabler-icon-diamond-filled.svg

Secure Best Marks with AI Grader

Need help grading? Try our AI Grader for instant feedback on your assignments.
Document Page
P*
P
price
Q Q* Quantity
D*
D
S
MANAGERIAL ECONOMICS
Question 2
(a) The article of the attachment 2 states that the demand for land in the top cities are
very high as there is a presence of lot of employment opportunities. Due to the high
demand for land the government had also added land value tax. The article also states
that the economic potential of a rural land in Kentucky is much lower than the Silicon
Valley of the city Santa Clara which is quite unique.
(b)
Fig3: Movement of the demand curve
(Mankiw, 2014)
The above diagram shows that there has been a rise in the demand for land
from D to D* and therefore, there has been a rightward shift which results in rise in
the price from P to P*. The red line above depicts the new demand curve D*.
Document Page
Supply of land
Price
Quantity
Land value tax
MANAGERIAL ECONOMICS
As the land in Bangalore, Milan and Paris have become precious due to the
presence of more employment opportunities, the demand of those lands has increased
along with the price.
The article states that the demand for the land with high employment
opportunities have increased (Brim, 2017). The article also states that in order to
increase the economic activity of the land, the government has introduced a land value
tax. Although the tax does not reduce the supply of land, however it penalises for
keeping the land unproductive.
The value of land in Bangalore, Milan, Paris and Austin has increased over
time because these top cities has become a place of innovative activities. Most of the
people have started settling in these particular cities which resulted in the increase in
employment opportunities along with rise in income.
(C)
Fig 4: Land value tax
(Garza & Lizieri, 2016)
Document Page
MANAGERIAL ECONOMICS
From the above diagram it can be seen that the supply of land is fixed and therefore,
land value tax cannot reduce the supply of land. It is a kind of tax which is imposed on the
unimproved value of land (Garza & Lizieri, 2016). As the supply of land is fixed, a tax
cannot increase or decrease the supply of land.
tabler-icon-diamond-filled.svg

Paraphrase This Document

Need a fresh take? Get an instant paraphrase of this document with our AI Paraphraser
Document Page
P
AR=MR=P
Q
MANAGERIAL ECONOMICS
Question 3
(a)
Fig 5: Long run equilibrium in perfect competition
(Abubaker, 2018)
When the government does not provide any subsidies, the initial long run equilibrium
looks like the above diagram. The above diagram shows that in the long run equilibrium
marginal revenue equals marginal cost and the long run average cost. This suggests that the
market for hawker food will earn normal profit in the long run.
MC
AC
Document Page
subsidy
Old supply
Subsidized
supply
quantity
price
P*
P
P1
Q*Q
MANAGERIAL ECONOMICS
(b)
Fig 6: subsidized supply curve
(Chou et al., 2015)
When a lump-sum subsidy is given by the government it usually lowers the fixed the
cost. Subsidy which is given by the government will usually lower he fixed cost of the
hawker. There is an increase in the profit and the marginal cost does not change (Chou et al.,
2015) Subsidies also reduce the variable cost of the firm.
Subsidy will move the supply curve downwards. The amount of subsidy is the
difference between the two supply curves. The supply curve moves downward after the
government pays subsidy to the hawkers (Henderson, 2016). Before the subsidy was provided
Document Page
MANAGERIAL ECONOMICS
the initial equilibrium price and quantity were P and Q respectively. The hawkers can now
earn a revenue with the help of subsidy. The consumers now have to pay a less price P1
compared to the old price P. The subsidy might help the hawkers to find a better place to sell
food in the long run. In the short run on the other hand the supply of food will increase as the
result of subsidy and henceforth the hawkers will also earn huge revenue due to the subsidy.
tabler-icon-diamond-filled.svg

Secure Best Marks with AI Grader

Need help grading? Try our AI Grader for instant feedback on your assignments.
Document Page
MANAGERIAL ECONOMICS
Reference list
Abubaker, R. (2018). Principles of Microeconomics.
Beaudry, P., Green, D. A., & Sand, B. M. (2016). The great reversal in the demand for skill
and cognitive tasks. Journal of Labor Economics, 34(S1), S199-S247.
Brim, O. (2017). The economic theory of representative government. Routledge.
Chou, S. Y., Nguyen, T. A. T., Yu, T. H. K., & Phan, N. K. P. (2015). Financial assessment
of government subsidy policy on photovoltaic systems for industrial users: A case
study in Taiwan. Energy Policy, 87, 505-516.
Garza, N., & Lizieri, C. (2016). A spatial-temporal assessment of the land value development
tax. Land Use Policy, 50, 449-460.
Henderson, J. C. (2016). Foodservice in Singapore: Retaining a place for hawkers?. Journal
of foodservice business research, 19(3), 272-286.
Mankiw, N. G. (2014). Principles of macroeconomics. Cengage Learning.
chevron_up_icon
1 out of 11
circle_padding
hide_on_mobile
zoom_out_icon
logo.png

Your All-in-One AI-Powered Toolkit for Academic Success.

Available 24*7 on WhatsApp / Email

[object Object]